
Measuring System Drift Metrics When Invariant Cached Responses Mask Underlying Structural Degradation Protocols
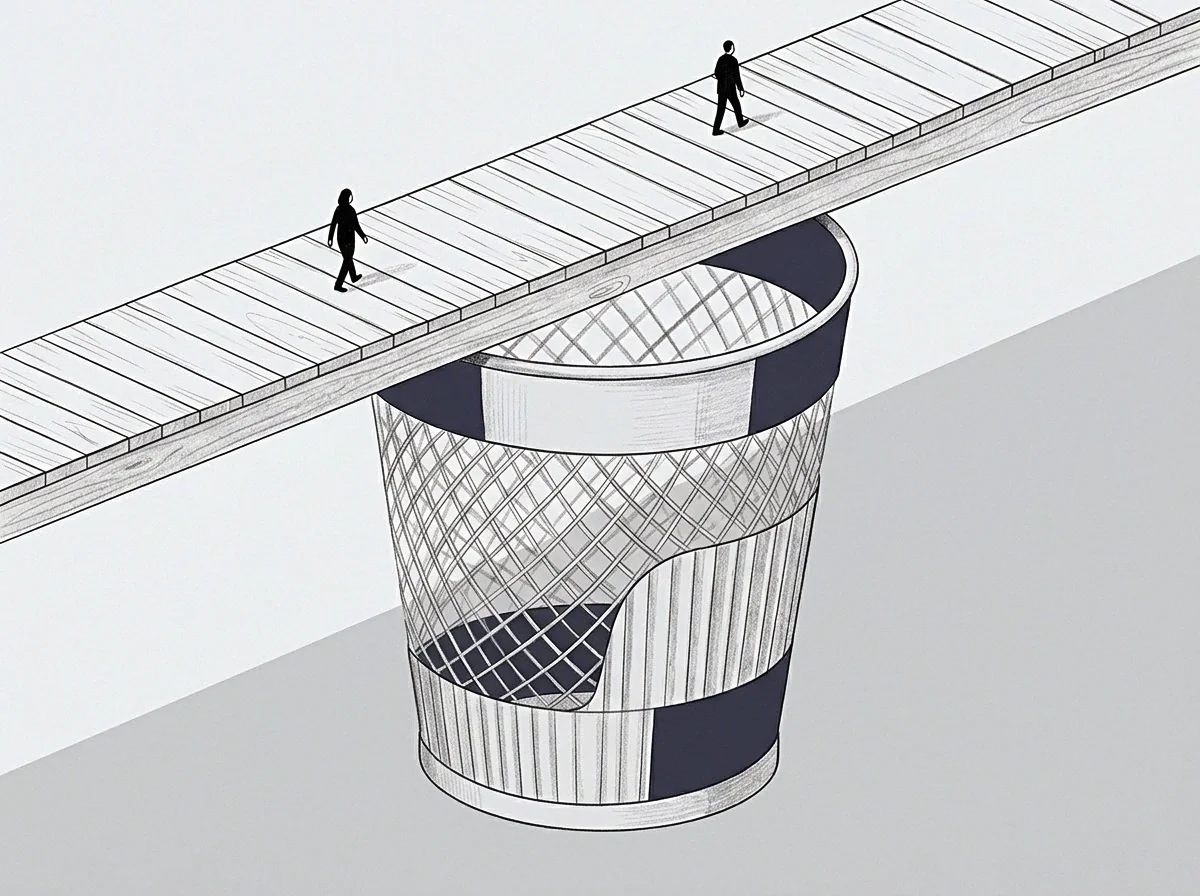
Invariant cached responses mask substrate degradation by severing edge metrics from origin compute health, hiding deep system drift until cache eviction.

Plate

Latency Masking Under Static Returns
A monitoring system reports sub-millisecond latencies for six consecutive weeks while the underlying database cluster quietly loses quorum. The client reads twenty-four green lights on a wall mount. Every query hits a distributed memory layer returning an invariant payload formed during a deployment cycle from the prior quarter.
The production storage pool sits exhausted, replication streams stall across four availability regions, yet external uptime calculations record four nines. Cached responses mask structural degradation. The surface metric records the retrieval speed of a stored artifact, offering no visibility into the health of the downstream execution path.
Instrumentation regimes often track transit duration rather than state evolution. When a query returns identical bits regardless of upstream partition health, the observer evaluates storage topology rather than system competence. Sampling entry and exit timings exclusively at the cache perimeter treats fast reads as operational durability.
As the measurement window widens, variance in responses drops to zero while the computing substrate underneath deteriorates behind an immutable buffer.
A stored payload returns identical bytes while the execution substrate behind it drops writes.
Measuring drift under these conditions requires splitting the pipeline into separate observation planes: one for the retrieval of frozen state, and another for the thermodynamic work of running fresh state against underlying storage engines. Operators who depend strictly on user-facing latency percentiles leave degradation protocols dormant until the memory tier evicts keys or loses power. The gap between cached response times and live execution paths provides the direct indicator of structural drift.

Probe
Synthetic Perturbation Across Invariant Layers
Bypassing the memory perimeter requires synthetic probes engineered to defeat key-value deduplication without inducing denial-of-service cascades. Standard caching layers collapse identical query patterns into single memory lookups, concealing a failing database engine until an unindexed or novel query penetrates the filter. Detecting drift demands forced misses through bounded, intentional inputs that test the execution substrate directly.
A synthetic probe introduces controlled entropy into the parameter space. The system processes the request, misses the local index, and routes the work into the execution pipeline. At that point, instruments capture actual latency, disk input-output waits, and connection pool saturation.
Tracking the ratio between this synthetic execution cost and the baseline established at initialization indicates the rate of underlying architectural rot.
- Entropy injection forces a known percentage of read operations to bypass local memory buffers through uncollated query mutations.
- Substrate pinging issues lightweight transactional writes directly into replica logs to test distributed write consistency over forty-eight hours.
- Shadow execution mirrors five percent of inbound read traffic into an uncached testing harness to register downstream compute strain.
- Replication lag verification audits write-head positions against read-replica commit pointers at sixty-second intervals without touching query frontends.
Substrate probing carries immediate operational expense. Directing synthetic load at an already failing storage partition accelerates hardware exhaustion. Engineering practices diverge on interrogation intensity: one approach applies continuous baseline interrogation via low-frequency writes, while another relies on periodic burst evaluations separated by multi-hour cool-down windows.
Continuous probing imposes a steady drag on query buses, whereas burst methods can destabilize a fragile primary replica during unpredicted spikes in organic traffic.
Regardless of method, probe outputs must register on an ordinal vector. Numerical latency values mislead when a failing network interface card completes ninety-nine reads quickly and stalls on the hundredth. Tracking whether each subsequent execution cycle consumes more physical CPU cycles than the preceding one establishes the drift vector over a thirty-day window.
If the work required to parse fifty unindexed records climbs across four consecutive deployments, structural degradation is underway regardless of what the front-end dashboard displays.
The client looks at the dashboard and sees instant results. The client does not pay for storage rebuilds until the memory layer clears.

Table

Comparative Metrics in Live and Buffered Regimes
Evaluating drift requires keeping perimeter indicators strictly separated from substrate telemetry. Mixing these signals produces uninterpretable composite figures. A high cache hit ratio appears efficient to management, yet it functions as an operational screen that hides write backlogs, schema deadlocks, and disk saturation.
| Measurement Vector | Perimeter Cached Regime | Substrate Execution Regime | Degradation Indicator |
|---|---|---|---|
| Query Latency | Deterministic sub-millisecond retrieval | Stochastic progression toward timeout | Variance widening between cache and origin |
| Error Rate | Zero percent on known keys | Climbing write rejection count | Asymmetric failure on write-through mutations |
| Resource Consumption | Flat memory utilization profiles | Ascending memory fragmentation and thread wait states | Thread pool starvation under synthetic misses |
| Throughput Capacity | Linear scalability up to network saturation | Sharp collapse past nominal connection boundaries | Steep drop in transaction volume during cold misses |
The comparative data shows how an invariant cached layer obscures deep failure. The outer layer presents uniform stability. Inbound queries touch memory locations established days prior, generating flat lines on telemetry charts.
Meanwhile, the live computation path drifts into pathological resource contention. Downstream database threads queue behind locks, waiting for storage transactions that never finalize. If the operational playbook specifies alerts based on ninety-ninth percentile client response times, the alert fires only after the cache infrastructure suffers complete failure.
A flat telemetry chart on an edge node hides an exponential queue depth at the origin.
Operators evaluate these disparities by monitoring the divergence velocity between the two regimes. If perimeter latency holds at four milliseconds while origin server latency climbs from fifty milliseconds to four hundred milliseconds across three weeks, degradation protocols must trigger immediately. Waiting for perimeter metrics to reflect substrate decay guarantees an emergency failover under uncontrolled load.
The contract requires four nines of availability at the edge, so the team leaves the failing database alone until Monday morning.

Rift

Decoupling Eviction Schedules from Health Declarations
Memory caches employ eviction policies such as least recently used or time-to-live expirations to manage memory footprints. These rules operate on temporal cycles independent of backend capacity. When a system relies on automated time-to-live policies, an unexpected cascade occurs during mass invalidation: expired keys drive traffic straight to origin nodes, where latent decay causes an immediate collapse under the unbuffered computational load.
Consider an enterprise logistics service operating across five regional nodes, caching inventory balances for four hours to manage database read volume. Over twelve hours, disk controller errors silently corrupt write-ahead logs on three secondary nodes. The application serves inventory records to customers without interruption because the queries resolve from memory.
The moment the four-hour expiration hits, thousands of concurrent threads descend on the corrupted storage partition. The system enters an unrecoverable crash loop.
Measuring drift in these architectures requires health evaluations that bypass local memory states. An evaluation agent isolates a single node, raises the memory invalidation flags for that node, and runs an end-to-end reconciliation cycle across all active tables. This audit operates out of band, drawing dedicated compute capacity so it does not interfere with primary traffic lanes.
This yields the substrate impedance ratio: the origin execution duration divided by the baseline established during initial infrastructure validation. An impedance ratio of 1.0 indicates alignment with the baseline. An impedance ratio climbing past 2.5 signals deep rot within the execution stack, even if the production cache maintains a ninety-eight percent hit rate and client tickets remain nonexistent.
Systems fail catastrophically when operations teams treat cache hits as clean operational audits.
Gear

Mechanical Interventions for Latent Architectural Rot
Remediating structural decay behind an invariant facade demands changes to engineering routine. Automation must induce periodic cold execution to verify backend viability. An architecture that never routes unbuffered traffic into its backend engines eventually loses the capacity to execute unbuffered operations altogether.
One direct intervention introduces controlled entropy into cache routing through canary bypass ratios. An automated governor routes a fixed slice of standard traffic past the memory tier directly into raw compute nodes. The system records the operational profile of these canary transactions separately from edge metrics.
If the origin path exhibits elevated latency, connection leaks, or storage wait states, the governor alerts the engineering desk prior to systemic failure.
- The control loop samples inbound production queries at a deterministic rate of one in ten thousand requests.
- The bypass mechanism strips cache-control headers, forcing the request to traverse the entire underlying compute and storage stack.
- The logging subsystem tags the resultant trace, routing its execution metrics to a segregated substrate dashboard.
- The drift evaluation engine compares the execution profile against baseline measurements logged during the most recent production deployment.
- The remediation protocol raises automated isolation tickets when the origin execution duration drifts more than two standard deviations from baseline.
This approach introduces a persistent computational overhead of less than one-tenth of one percent across the cluster. In exchange, the engineering group eliminates the blind spot created by static edge caching. Structural decay is observed, quantified, and addressed while the primary application workload continues to serve clients from high-speed memory buffers.
A system that never executes cold paths loses the capacity to survive cold starts.
A second technique uses dynamic cache TTL reduction during suspected degradation windows. When background telemetry hints at storage partition issues, the caching layer automatically contracts its retention windows. Keys expire faster, forcing a controlled increase in origin traffic.
This deliberate stress test either validates origin competence or exposes latent degradation at a manageable scale before an unmanaged eviction avalanche forces total system failure.
The operator balances the cost of intentional backend strain against the catastrophic cost of unannounced storage collapse.

Room

Physical Infrastructure Audits and Hardware Drift
Software abstractions eventually terminate in physical cabinets, copper buses, and silicon dies. Structural degradation frequently originates at the physical layer, disguised by caching tiers running inside volatile memory chips. Solid-state drive endurance degradation provides an exact illustration of this failure mode.
As flash memory cells endure write cycles, write amplification climbs and erase block provisioning shrinks. Controller chips compensate by remapping bad blocks and lengthening write cycles. An application reading from memory caches observes zero degradation because reads bypass physical disk cells entirely.
Meanwhile, the physical drives quietly drift toward complete read-only lockouts as their spare block reserves vanish. When the caching tier restarts following an operating system security patch, the system attempts to reload state from physical drives that can no longer sustain concurrent read streams.
Measuring drift at this level requires interrogating device-level telemetry: SMART attributes, PCIe bus error counts, and storage controller thermal throttling states. A hardware audit protocol extracts these metrics independent of software application performance. If a drive controller logs an ascending count of reallocated sectors over a fourteen-day sampling period, the system is decaying.
The software engineers reading API response metrics will remain ignorant of this decay until the underlying chassis fails to mount its partitions.
Power delivery systems exhibit similar silent rot. Voltage regulator modules on server motherboards drift in thermal efficiency over years of sustained operation. As components degrade, they introduce clock throttling on central processing units to prevent overheating.
A memory cache hides this reduction in computational capacity because retrieving bytes from memory uses few execution cycles. Live transactions, however, encounter throttled cores, multiplying processing delays across the entire cluster.
The desk tracks these physical shifts through baseline comparisons logged during hardware provisioning. If the clock speed required to handle a standard batch of cryptographic hashes drifts downward across identical ambient server room temperatures, the hardware is decaying behind the operational software facade.
Physical hardware rots quietly while RAM continues to return yesterday’s numbers without error.

Gauge

Should Observability Systems Blind Themselves to Edge Buffers?
Architects debate whether edge caches should be excluded from foundational system health metrics altogether. One faction contends that including cache metrics in service level calculations creates structural blindness. They argue that service level objectives must reflect only the capacity of the system to process cold, unassisted operations from raw storage to client delivery.
Excluding cache layers from system health metrics creates an alternate problem: it divorces operational measurement from real user outcomes. If ninety-nine percent of users experience low latencies and correct data returns, declaring the system broken based on origin substrate metrics can trigger unnecessary emergency interventions. Engineering teams burn operational hours and attention responding to internal substrate alarms while users experience normal system utility.
The resolution lies in treating origin health and edge performance as separate, orthogonal vectors. Edge performance measures immediate commercial utility. Origin telemetry measures architectural survival over a multi-month window.
An operator must read both without conflating them into a single aggregate index. When the edge vector is stable and the origin vector shows drift, the system is consuming its architectural safety margins. It is burning down its runway while the instruments show clear skies.
A practical operational posture requires tracking the ratio between edge volume and origin capacity. When origin capacity degrades, resilience to cache invalidation collapses toward zero. An organization that tracks only the edge metric operates under an unhedged liability, waiting for an operational shock to strip away the cache and expose an inoperable compute substrate.
Whether an operational group can sustain continuous cold-path validation without bankrupting its infrastructure budget remains an open debate across high-throughput distributed systems.