
Mapping Systemic Boundary Limits When Multi Axis Metric Variance Overwrites Latent Capacity Vectors
Multi-axis metric variance hides baseline capacity depletion by prioritizing positive operational outputs over degrading recovery reserves.

Drift
The daily reporting dashboard shows forty consecutive days of revenue increases while customer renewal conversations stall after the first invoice. Readouts across operational channels display green thresholds, yet the capacity to absorb a sudden technical migration has dropped to zero. Systems that track performance across multiple discrete indices frequently mask the exhaustion of reserve energy.
When metric variance across operational branches conflicts, the organization defaults to the numerical series that displays upward progress, suppressing awareness of baseline exhaustion until operational failure forces a recalculation.
Under rapid operational acceleration, surface metric gains mask the depletion of underlying recovery reserves.
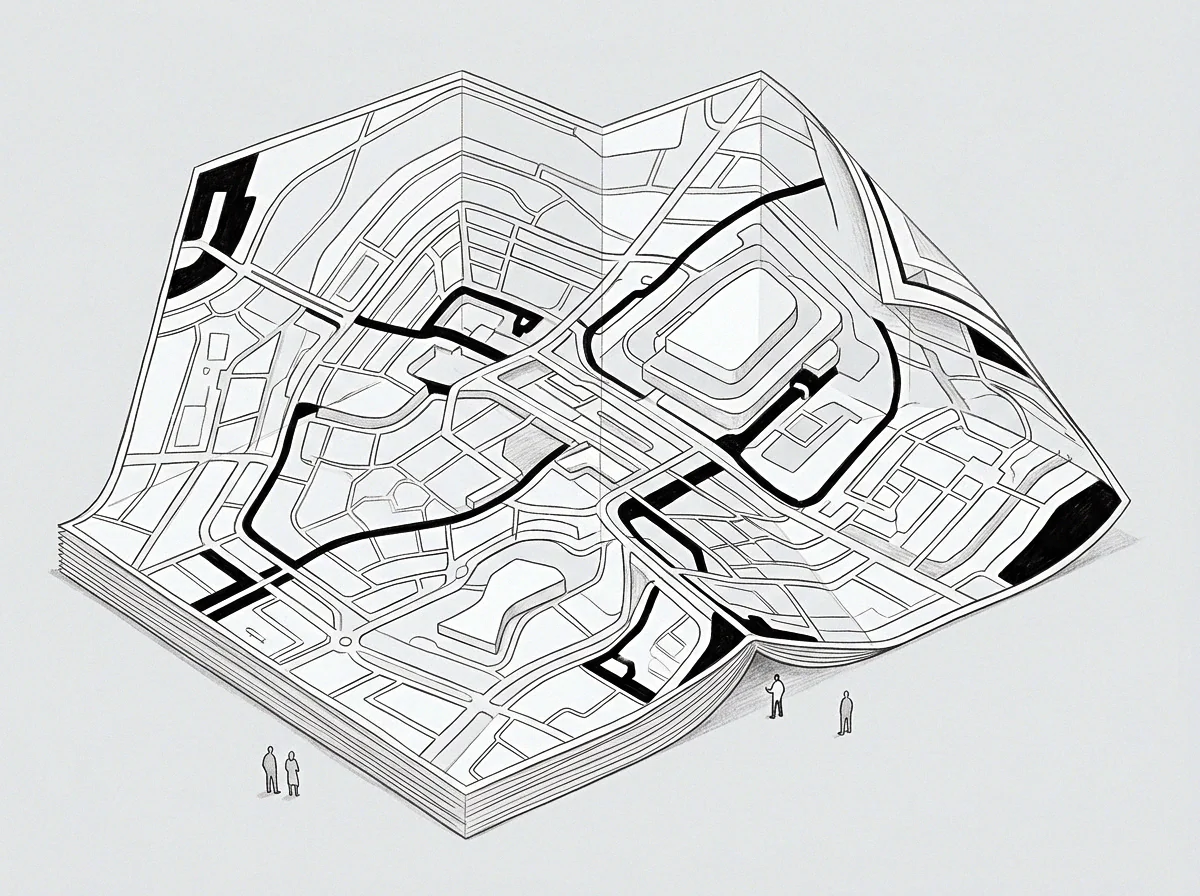
Observable Inconsistencies Across Operational Indices
A business unit tracks throughput, customer acquisition speed, and ticket resolution velocity, with each index reporting positive rates of change. At the same desk, engineers responsible for infrastructure maintain three parallel workarounds to prevent server outages during midday traffic spikes. The recorded metric measures resolution speed rather than architectural stability.
The operational team routes around the underlying instability because addressing it stops feature releases for two consecutive quarters. Measuring visible output substitutes for observing system stability, piling up structural debt behind every preserved performance figure.
Resource depletion occurs quietly beneath steady output. The operational baseline shifts downward while current velocity consumes latent structural buffers. When a sudden demand shock hits, expected elasticity is absent; the organization discovers its real perimeter only when the unmeasured substrate fractures under ordinary load.

Seat
The occupant of an executive post often evaluates organizational health through aggregated performance scores rather than direct inspection of operational slack. Structural position dictates what information moves upward. Incoming briefs summarize multi-axis indicators into composite scores that conceal how one team operates at eighty hours per week to compensate for tooling deficits, insulating the post from the friction generated by daily execution.

Structural Isolation in Executive Roles
Distance from daily labor encourages reliance on secondary indices. A regional director observes that customer satisfaction scores remain at ninety-two percent without seeing that client support staff manually rewrite automated responses after every software release to protect those ratings. The labor buffer vanishes into metric maintenance, and latent capacity disappears without leaving a mark on the weekly balance sheet.
| Metric Track | Reported State | Underlying Reserve State | Systemic Consequence |
|---|---|---|---|
| Customer Acquisition Rate | Linear Growth | Onboarding Labor Depleted | Service Degradation on Third Renewal |
| Feature Delivery Cadence | On Schedule | Code Refactoring Deferred | Exponential Cost on Infrastructure Patching |
| Support Ticket Closure | Contract Target Met | Staff Retention Timeframe Halved | Abrupt Loss of Institutional Memory |
The table reveals how positive operational readouts coexist with critical reserve deficits. Tracking isolated vectors creates an illusion of elasticity where none remains.
Unmeasured labor buffers absorb structural stress until human fatigue halts production.
The person in the seat reads the positive report and assumes the operational unit can absorb an immediate expansion.

Lattice
Interlocking dependencies distribute load across technical and human structures. When multi-axis variance distorts visibility, interconnecting nodes absorb unequal strain. Some maintain output by cannibalizing internal maintenance intervals, while others report apparent stability simply because upstream bottlenecks restrict incoming work volume.
The entire network behaves like a rigid frame where elasticity has been replaced by brittle resistance.

Where Does Reserve Exhaustion Conceal Structural Stress?
Resource buffers degrade unevenly across functional groups. A software architecture team absorbs architectural instability by writing temporary bridging scripts while sales teams report record client volume. Load transfers entirely to the maintenance group without triggering an alert on the commercial dashboard, pushing the system to its limit while separate reporting streams display normal variance.
- Buffer decay accelerates when routine maintenance windows convert into continuous production uptime without compensatory rest cycles.
- Secondary labor reliance conceals systemic weakness through unrecorded manual interventions by tenured operators.
- Metric decoupling occurs whenever operational indicators register expansion while underlying infrastructure reaches thermal boundaries.
Observing systemic boundaries demands measurement of recovery time rather than output rate. A system operating at peak throughput with zero recovery margin sits on the edge of a stall. When metric variance overwrites these latent vectors, planning models assume infinite linear elasticity, committing the organization to external delivery timelines based on capacity figures that exist solely on paper.
A production network operating without recovery intervals treats borrowed time as permanent throughput.
What structural mechanism separates temporary operational strain from permanent capacity loss across interdependent production nodes?

Fault
Fracture lines open at the intersection of unrecorded labor and rigid delivery commitments. When reality reasserts itself, the collapse is sudden and nonlinear; a single resignation or server crash cascades across the operational sequence. The organization then attempts to diagnose the failure using the same multi-axis dashboards that obscured the vulnerability.
True boundary limits remain invisible until the underlying substrate refuses further load.
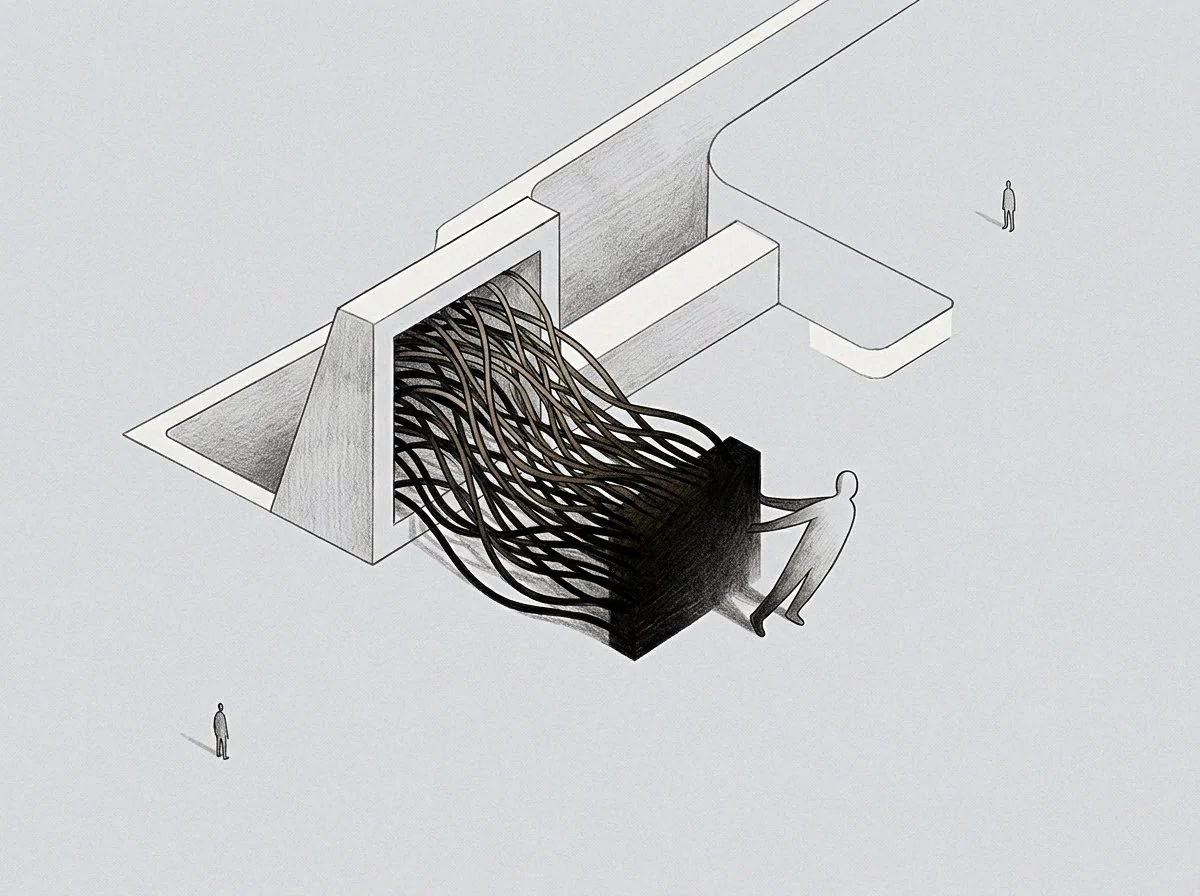
Mapping Latent Capacity Boundaries
Direct inspection of reserve volume replaces reliance on output indices. The evaluator tracks the time required for a unit to return to baseline readiness after an unexpected demand spike. If recovery time increases while output remains constant, the boundary limit sits immediately ahead.
The operator maps the system by measuring what it cannot absorb rather than what it currently produces.
Accurate boundary mapping requires tracking unspent capacity vectors across every operational axis. A healthy production unit maintains measurable reserves in tooling redundancy, labor margin, and temporal slack. When multi-axis variance threatens to overwrite these reserves, the operator halts metric optimization to rebuild physical baseline capacity, preserving unspent potential to maintain system survivability across uncertain operational conditions.