
Calibrating Multi-Region Operational Metrics Against Structural Infrastructure Disparities Without Distorting Capital Allocation
Decouple operational evaluation from capital allocation by indexing managerial velocity against local infrastructure while deploying cash on raw returns.

Rail
Operations across disparate geographies run on unequal foundations before work even starts. A distribution hub in an area with continuous electrical uptime, paved transit corridors, and predictable customs clearances turns inventory faster than an identical facility sited where brownouts occur weekly and freight sits for days at border checkpoints. Physical terrain establishes the baseline pace.
When executive management scores both facilities against the same cardinal output target, the comparison reads local infrastructure variance as managerial capability. Capital allocators tracking these unadjusted figures direct expansion funds straight to the developed market, starving the constrained site of the capital needed to install basic redundancy.
The misreading comes from treating raw operational figures as pure measurements of local skill. A plant running automated sorting lines on an unstable grid suffers continuous micro-stoppages: each voltage drop triggers a reset, resets cause mechanical wear, and wear pulls down hourly throughput. Regional transit delays disrupt scheduled dispatches.
Operators in the constrained zone absorb these conditions by carrying safety stock, hiring dedicated maintenance labor, and running diesel generators at three times the marginal utility cost of grid electricity.
A raw productivity metric recorded across disparate regions measures the quality of municipal infrastructure rather than the execution of the team on site.
Comparing these territories requires separating physical external drag from operational execution. An operator maintaining ninety percent uptime through chronic grid failures demonstrates tighter process control than an operator reaching ninety-four percent uptime on an uninterrupted municipal grid. When capital allocation systems miss this distinction, capital clusters where public infrastructure absorbs the operational load, widening geographical disparities while subsidizing weaker operational discipline in favored hubs.
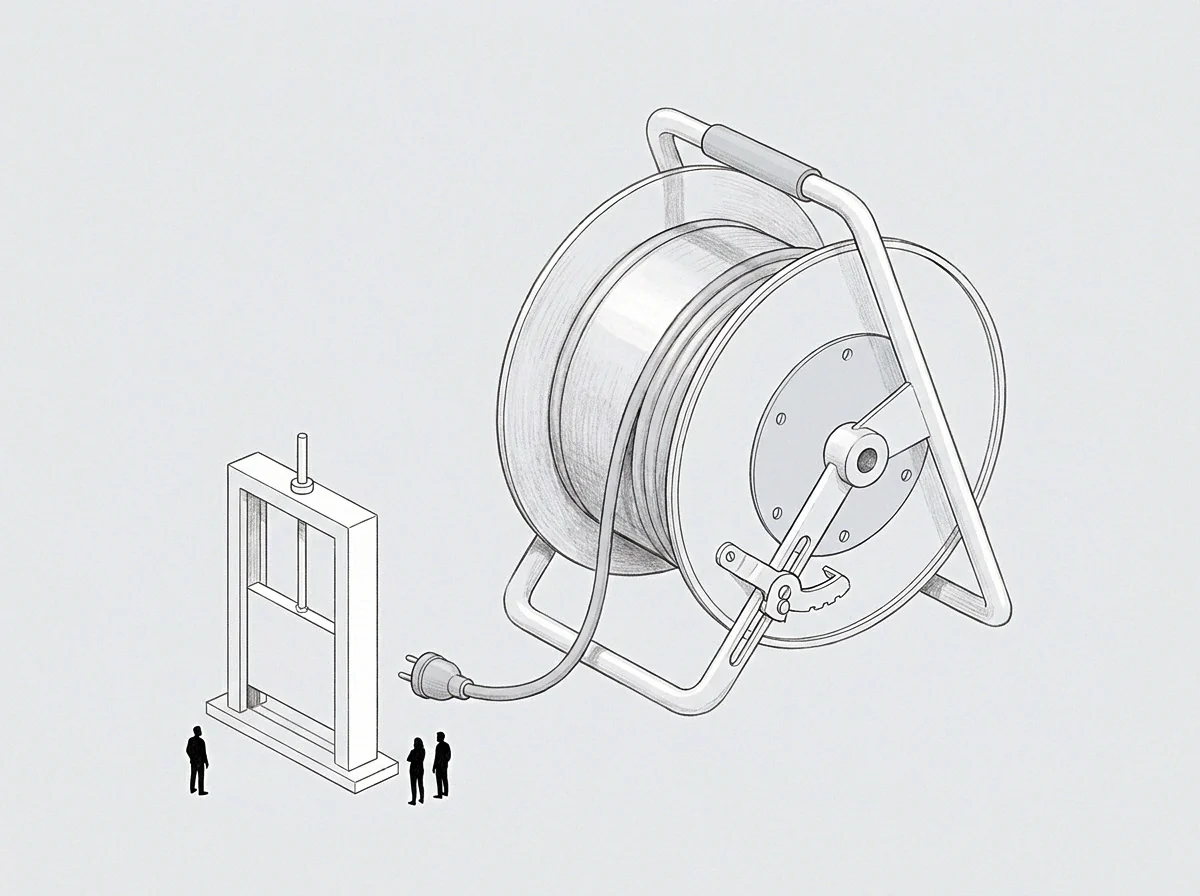
Exogenous Drag and Municipal Variance
Municipal infrastructure gaps distribute operating friction unevenly across regional balance sheets. Fleets running unpaved secondary roads experience tire wear, suspension fatigue, and route recalculation delays that never affect fleets on maintained highways. Grid instability accelerates equipment wear.
Consequently, the capital expenditure budget at a constrained facility absorbs premature machine amortisation, depressing return on invested capital despite disciplined route planning.
Baseline operational friction splits across three measurable environmental vectors: utility stability, transport network latency, and administrative clearing speed. Measuring these variables against individual units establishes the actual baseline against which operational performance deltas should be evaluated.
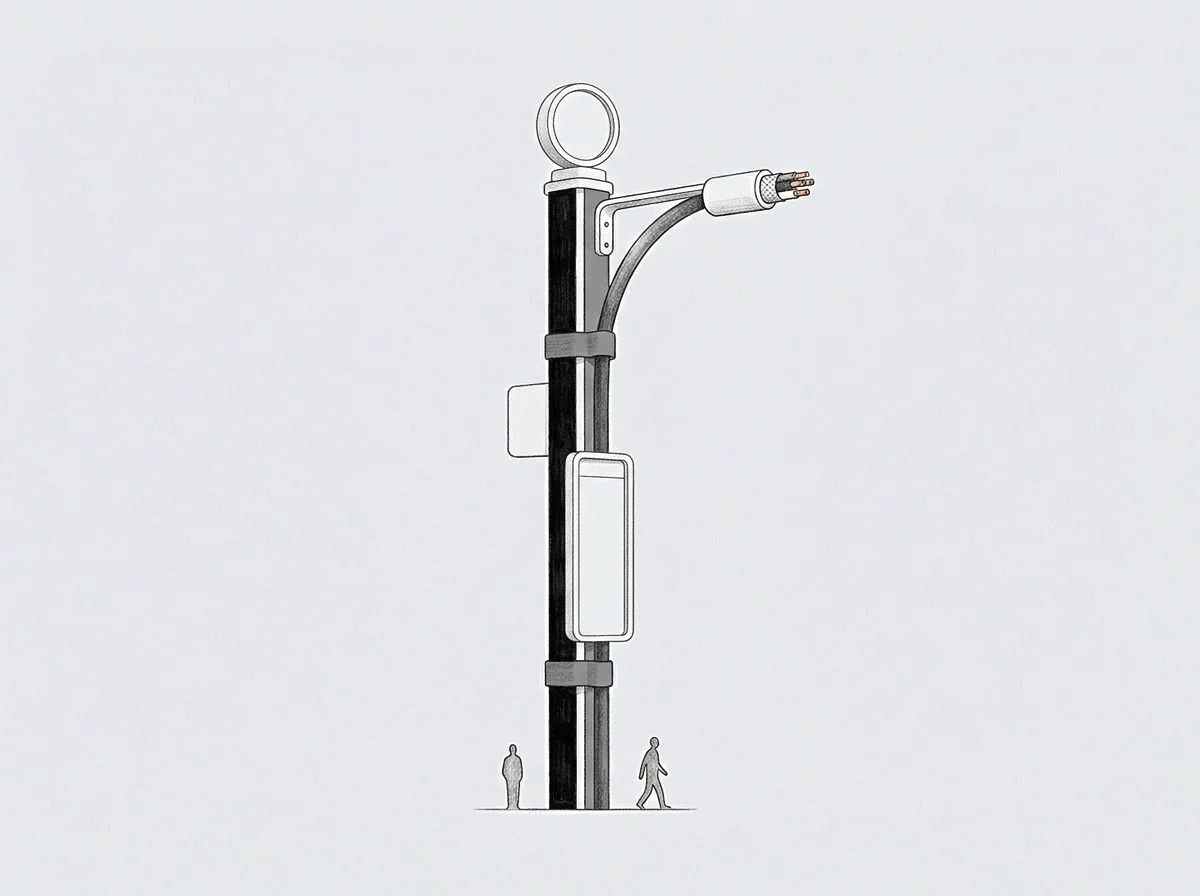
Variance
Correcting for regional infrastructure disparities requires separating structural overhead from discretionary execution. Structural overhead covers the delays and expenses imposed by external conditions outside local operational control. Discretionary execution measures the rate at which available inputs convert to finished outputs during active production windows.
A regional normalization model evaluates operating units against localized synthetic baselines rather than a single corporate standard. When a regional grid goes dark, downtime logging isolates the municipal failure period from operator-controlled maintenance hours. Operational velocity is calculated strictly while municipal inputs meet standard operating thresholds, keeping external disruptions out of managerial efficiency ratings.
Equipment wear accelerates under unstable voltage and converts local grid failures into premature balance sheet depreciation.
Over-correcting introduces its own risk: allocators can easily lose sight of underlying cost realities. An operating unit adjusted for heavy regional logistics friction may show high managerial efficiency on paper, even while the facility loses money on fuel bills and transport breakage. Capital cannot be deployed on adjusted performance alone; it must reflect the cardinal cash cost of completed deliveries.

Decomposing Structural and Discretionary Performance
The decomposition model tracks two indices simultaneously. Operating discipline is measured through an input-adjusted technical efficiency index, while investment returns are tracked through an unadjusted cash conversion rate. The efficiency score guides promotions, performance bonuses, and process reviews, while cash conversion dictates capital allocation thresholds.
When technical scores are high but cash conversion stays low, the appropriate allocation response is targeted infrastructure spending, such as on-site power generation or dedicated warehousing, rather than withholding capital or changing management. No amount of internal route optimization paves the twenty miles between the highway and the loading dock.

Index
Building a regional calibration index requires isolating input variables over continuous measurement windows. The operational baseline is indexed against regional infrastructure friction coefficients calculated across ninety-day observation periods. These coefficients adjust cycle time targets according to documented external delay factors.
| Operating Territory | Infrastructure Friction Coefficient | Raw Unadjusted Throughput | Calibrated Technical Delta | Real Cash Capital Return |
|---|---|---|---|---|
| Primary Metropolitan Corridor | 1.02 | 100 Units / Hour | +1.2% Against Baseline | 14.8% ROIC |
| Developing Industrial Zone | 1.48 | 76 Units / Hour | +6.4% Against Baseline | 11.2% ROIC |
| Isolated Hinterland Terminal | 2.15 | 52 Units / Hour | +8.1% Against Baseline | 6.4% ROIC |
The table shows the central tension in multi-region governance. The isolated hinterland terminal records the highest technical delta above its friction-adjusted baseline, reflecting strong floor discipline, yet produces the lowest real cash capital return. The primary metropolitan corridor delivers the highest cash return alongside flat technical progress.
Applying uniform capital hurdles without metric calibration leads allocators to cut maintenance budgets at the isolated facility, mistaking its 52-unit raw output for operational failure. Decoupling technical evaluation from capital return calculations prevents structural geographic penalties from being misclassified as weak management.
Applying this calibration across operating units requires three explicit control parameters:
- Environmental Drag Coefficients quantify third-party transit delays, regional power interruptions, and customs dwell intervals over rolling quarter windows.
- Localized Asset Degradation Adjustments restate standard machine amortization schedules to reflect physical stress from local operating realities.
- Structural Capital Thresholds set distinct capital recovery hurdle rates that reflect the cardinal cost of regional operating constraints without skewing managerial incentives.
Under regional subsidiary contracts, management performance bonuses track the calibrated technical delta, while capital expenditure approvals depend on clearing the unadjusted structural capital threshold.

Split
Capital distortion follows when organizations try to resolve regional operational gaps purely through accounting adjustments. When corporate scorecards normalize metrics so that constrained sites look identical to mature hubs, allocators end up directing capital into compromised environments that cannot generate sustainable cash returns.
A manufacturing unit running on an unstable municipal water supply and irregular voltage burns through replacement components and ties up cash in emergency buffer inventory. Rewarding a plant manager for controlling scrap rates under those operating constraints is sound practice. Pouring growth capital into that unit on the expectation that it will scale at the same cost trajectory as a facility on a stable grid is a capital misallocation.
Adjusted operational metrics guide managerial evaluation while unadjusted cash realities govern capital preservation.
Balancing metric calibration with capital allocation depends on keeping the two data streams distinct. Operational telemetry should be normalized to reflect execution, process control, and local optimization under environmental drag. Financial reporting must remain raw, cardinal, and grounded in cash returns.
Blending the two tracks causes an organization to penalize capable teams in difficult territories or misallocate capital by treating subsidized operating environments as naturally productive units. The operational question is how long an enterprise can fund an infrastructure-constrained site before the absolute cost of physical work overtakes the benefits of strong local discipline.

Audit
Auditing a multi-region calibration model requires tracking environmental conditions over time. Regional infrastructure is dynamic: municipal grids stabilize, logistics corridors open, and port backlogs clear. A static calibration coefficient becomes counterproductive if regional infrastructure improves while a facility continues to claim an artificial discount against its baseline.
Once set, infrastructure friction coefficients must be reviewed every six months against external data, including regional grid reliability logs, commercial freight transit velocities, and municipal utility rates.
The audit protocol checks whether local operating gains translate into actual operational resilience. As municipal infrastructure improves, the calibrated delta should converge with the raw throughput figure. If grid uptime rises by twenty percent while local throughput stays flat, the production gap points to internal operational slack rather than external utility drag.
Adjust metric baselines against external physical realities continuously, yet allocate investment capital strictly by raw cash generation.