
Capital Allocation Mechanics Beyond Categorical Enterprise Matrix Sorting
Capital allocation moves beyond enterprise matrix sorting by replacing static taxonomy buckets with continuous mathematical return gradients computed across hurdle baselines.

Floor
An executive committee sits in a quarterly planning session with fifty million dollars in unallocated expansion capital. On screen, a matrix divides four division portfolios into classic quadrant buckets: cash-generating core products, high-growth speculative units, low-yield legacy lines, and declining services. Each bucket carries a standardized allocation rule.
Cash-generating units receive reinvestment capped at depreciation, speculative units receive seventy percent of discretionary capital, and declining units receive zero. The allocation logic appears disciplined because the categories are tidy. Inside the legacy division, an obscure sub-project in logistics routing holds an eighteen percent marginal return slope on its next two million dollars of capital.
Across the room, the high-growth unit absorbs twenty million dollars into broad market acquisition, where channel saturation has flattened the marginal return slope to four percent. Matrix sorting aggregates performance across entire units, blinding allocators to continuous micro-gradients of return.
The enterprise ledger measures historical expenditure in cardinal dollar values, while internal allocation operates on ordinal cost preferences. Cardinal prices record what an asset cost to buy; ordinal cost reflects what the enterprise surrenders by placing capital in one division rather than another. When capital allocation relies on static matrix categories, resources flow to broad organizational buckets instead of specific return slopes.
The baseline against which all capital must be priced is the enterprise hurdle rate. Capital sits where metrics freeze.
Static categories hide local decay while masking small high-yielding growth opportunities inside decaying business units.
Categorical enterprise matrices sort business units by historical revenue, aggregate gross margins, or industry benchmarks, treating every dollar placed inside a unit as though it yields the same return. Enterprise reality operates as a continuous scalar field of individual investment opportunities, each with its own return trajectory. Moving past quadrant bucketing turns capital allocation into a continuous computation of directional derivatives across the return landscape.
The corporate capital hurdle rate defines the minimum baseline slope acceptable for investment. Any project whose marginal yield trajectory drops below this baseline floor consumes enterprise value, regardless of whether it sits inside a division designated as a high-growth asset.
A capital deployment policy stating that discretionary funds flow exclusively to units maintaining a continuous marginal return slope above twelve percent redefines project eligibility without regard to traditional enterprise quadrant boundaries.

Descent
Continuous capital optimization evaluates the partial derivative of return relative to capital committed across every active project line. Rather than treating a business unit as a monolithic destination, the allocation system reads the local slope of return for each incremental dollar deployed. Movement along a yield surface follows the direction of steepest gradient.
Where a traditional matrix asks which quadrant an asset belongs to, a gradient approach asks how much additional value one further dollar generates at the current deployment point.

Marginal Returns Across Continuous Trajectories
Deploying capital along a continuous return gradient requires constant recalculation of marginal efficiency. As capital enters a specific initiative, marginal returns diminish under organizational capacity constraints, market saturation, or managerial overhead. Project yield curves are rarely linear: an initial deployment of five hundred thousand dollars might yield a steep twenty-five percent return slope, whereas expanding that deployment to five million dollars flattens the local derivative to zero.
Categorical matrices miss this curvature because they treat investment as a binary choice: fund the unit or defund it. Continuous gradient tracking adjusts deployment volume dynamically, halting capital flow the moment the local derivative intersects the corporate hurdle floor.
| Evaluation Dimension | Categorical Enterprise Matrix Sorting | Continuous Gradient Capital Allocation |
|---|---|---|
| Allocation Unit | Aggregated Business Division or Product Line | Incremental Capital Trajectory per Project |
| Measurement Geometry | Static Discrete Quadrants (2×2 Matrix) | Continuous Derivative along Return Surface |
| Resource Mobility | Lumpy, Periodic Annual Reallocations | Fluid, Continuous Marginal Realignment |
| Threshold Sensitivity | Average Unit Historical Performance | Local Instantaneous Yield Curve relative to Baseline Floor |
The enterprise routes around illiquid assets. Capital distribution governed by static categories generates structural friction across division walls, where leaders hoard unspent allocations to preserve budget scale and create artificial internal illiquidity. When capital allocation shifts to continuous gradient analysis, those internal boundaries become permeable to value flows.
When capital flows along the local return gradient, resource distribution converges toward maximum efficiency without discrete categorical reclassification.

How Does Marginal Capital Drift Across Internal Boundaries?
Internal capital drift occurs when funds remain locked within low-yielding divisions due to administrative friction and categorical budgeting rules. When an enterprise assigns capital based on historical matrix designations, funds become sticky. A cash cow division retains capital for low-return maintenance projects while an adjacent emerging unit starves for expansion funds because its historical revenue baseline remains small.
Eliminating categorical boundaries allows capital to move freely toward the highest local slope across the firm, continuing until return slopes equalize across all operating divisions. Because friction alters the effective slope, the cost of transferring resources between divisions introduces a local drag coefficient in the gradient equation. When transfer costs exceed the differential between two return slopes, capital remains stationary, marking a structural limit to reallocation.
Failing to account for internal friction leads to reallocation mandates that destroy value when administrative dislocation costs exceed the marginal yield differential.
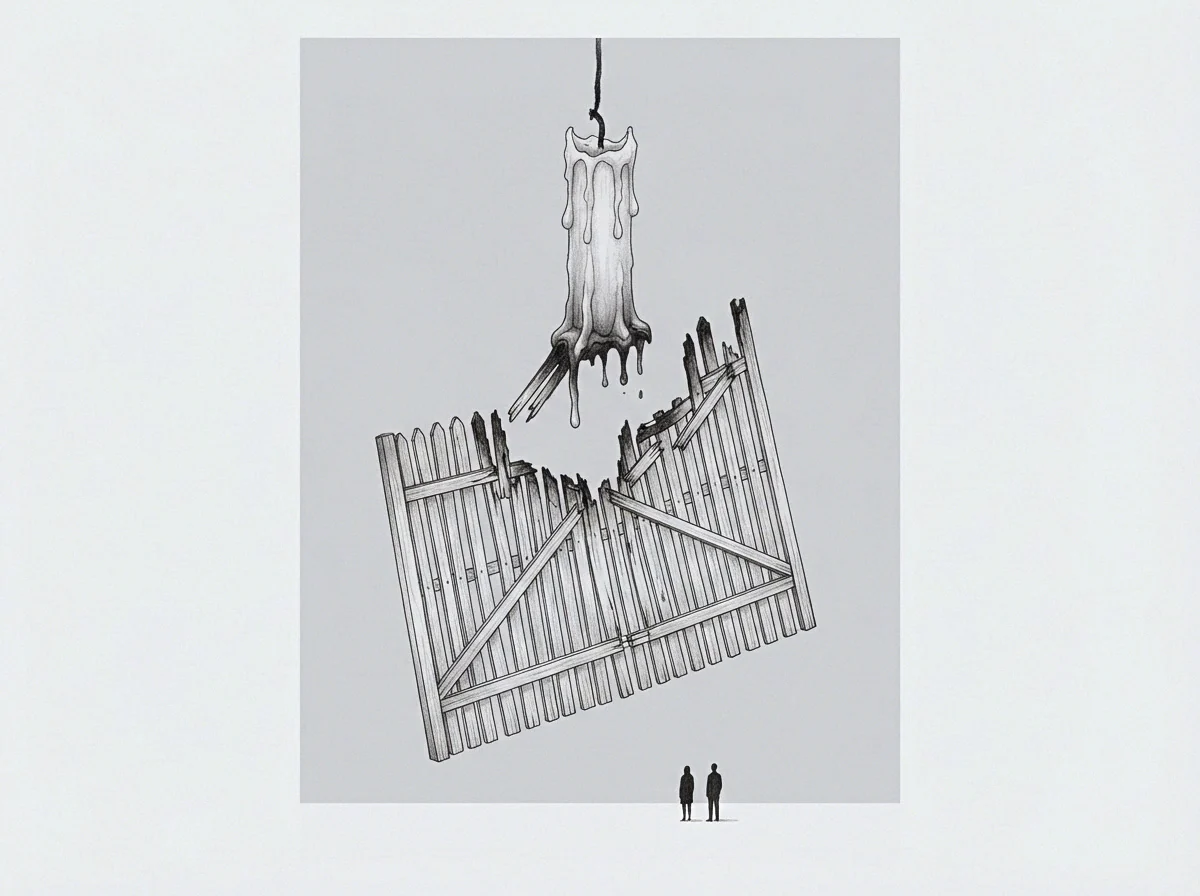
Mirror
Every negative return gradient calculated across an underperforming division reflects an equivalent latent potential above the baseline when mirrored across the enterprise hurdle floor. Unprocessed inefficiencies represent trapped operational capability. When a system routinely routes around a bottlenecked division, unspent yield potential in that division accumulates, matching the scale of structural avoidance.

Latent Potential Above the Hurdle Baseline
Enterprise matrix sorting often writes off low-performing divisions without analyzing the mechanisms creating low aggregate yield. A division can display a low average return simply because eighty percent of its capital is tied up in obsolete infrastructure while twenty percent feeds an exceptionally high-yielding niche service. Sorting the entire division into a low-priority matrix bucket starves the high-yielding niche alongside the legacy core.
Mirroring the negative gradient shifts the analytical frame. Instead of measuring total divisional underperformance, the allocator maps the points where capital removal restores efficiency, isolating high-slope opportunities embedded inside the unit.
- Capital Stagnation Vector describes the institutional persistence of funding underperforming initiatives due to legacy commitments or fixed asset inertia.
- Categorical Aggregation Drag occurs when high-yielding micro-projects are hidden inside low-performing division metrics and denied expansion capital.
- Hurdle Misalignment Shift happens when corporate hurdle rates are set without accounting for variable division risk profiles, mispricing capital allocations.
The gradient carries no institutional judgment, providing a mathematical measure of directional return per additional unit of resource input. Latent potential is unspent volume waiting for friction-free allocation paths.
Unspent capital volume accumulates precisely where internal operating friction prevents continuous deployment.
When an enterprise maps its internal return surfaces, areas of high operational friction show up as steep drops in return gradients. Avoiding these zones leaves trapped capital volume behind the organizational wall—the current boundary of an operating model built from processes, systems, and habits preserved to avoid administrative expense.
Unprocessed return vectors accumulate quickly. Working at the boundary requires pressing against these friction walls rather than routing capital into easier, lower-yielding paths.
Capital deployed without continuous local gradient measurement predictably settles into local return minima.

Cost
Consider a worked allocation situation involving an enterprise operating two primary business divisions, Division Alpha and Division Beta, under a corporate hurdle rate floor of ten percent. The enterprise holds ten million dollars in unallocated funds. Division Alpha is historically classified as a cash cow, producing forty million dollars in stable annual revenue with an average return on invested capital of twelve percent.
Division Beta is classified as a speculative growth unit, generating five million dollars in revenue with a current aggregate return on capital of five percent.
Under traditional enterprise matrix rules, seven million dollars of the available capital is assigned to Division Beta to stimulate growth, while three million dollars goes to Division Alpha for maintenance. Matrix sorting relies entirely on average return figures and divisional labels.

Worked Allocation Under Variable Friction
A continuous gradient analysis evaluates the marginal return slope of specific projects proposed within each division, rather than relying on historical divisional averages.
- Division Alpha presents a supply chain automation project requiring three million dollars, carrying a projected local marginal return slope of twenty-four percent on the first million, eighteen percent on the second million, and fourteen percent on the third million.
- Division Alpha presents a facility expansion project requiring two million dollars, carrying a marginal return slope of eight percent, which falls below the ten percent corporate hurdle floor.
- Division Beta presents a customer acquisition scaling project requiring five million dollars, carrying a marginal return slope of sixteen percent on the first million, eleven percent on the second million, and six percent on remaining volumes due to rapid channel saturation.
Continuous allocation mechanics reassign the ten million dollars strictly on marginal slope relative to the hurdle floor, disregarding historical divisional labels and broad aggregate averages.
The first million dollars flows to Division Alpha’s automation project at twenty-four percent yield. The second million flows to Division Alpha’s automation project at eighteen percent. The third million flows to Division Beta’s acquisition project at sixteen percent yield.
The fourth million flows to Division Alpha’s automation project at fourteen percent yield. The fifth million flows to Division Beta’s acquisition project at eleven percent yield. At this point, all remaining project options across both divisions carry marginal return slopes below the ten percent corporate hurdle floor.
The remaining five million dollars is held in reserve or returned to shareholders.
A fixed hurdle rate applied to heterogeneous business units creates artificial capital starvation in emerging high-slope initiatives.
Cardinal price accounting logs the initial ten million dollars as fully allocated under traditional matrix rules, masking the fact that four million dollars went to sub-hurdle projects. Ordinal cost vectors show that assigning four million dollars to sub-hurdle efforts surrendered high-yielding reserve options elsewhere, marking the boundary where measurement informs directional movement.
Capital rules favoring short-term operational automation over long-term market presence risk conflicting with strategic growth charters.

Route
Moving from categorical matrix sorting to continuous gradient allocation requires real-time feedback mechanisms for tracking capital. Deployment becomes an iterative loop where funds are released in smaller tranches matched to local slope validation. As soon as empirical measurement shows a project’s marginal return slope declining toward the hurdle floor, deployment halts.
The enterprise treats capital allocation as a dynamic steering vector rather than an annual budgeting ritual.

Executing Gradient Reallocation at the Capacity Wall
Executing gradient allocations exposes the organizational wall where model boundaries break down. Operational capacity limits, talent constraints, and structural delays represent physical boundaries where return gradients collapse steeply. Discomfort at the boundary indicates that the system is engaged in actual computation and adaptation rather than passive retrieval of historical patterns, updating the baseline as conditions change.
The model boundary expands only by pushing directly into high-friction zones where return slopes are steep but administrative resistance is high. Routing capital around operational bottlenecks preserves immediate comfort at the cost of long-term structural inefficiency. Tracking local error signals between projected and realized marginal return slopes provides exact coordinates for operational intervention.
While capacity limits bound the response and ordinal costs govern capital velocity, the ledger records past deployment while directional derivatives dictate future performance. By anchoring allocation mechanics strictly in continuous return gradients computed above a rigorous hurdle floor, the enterprise moves beyond arbitrary matrix categories into true capital efficiency.
What structural friction remains unmeasured inside the enterprise transfer pricing model that prevents marginal capital from flowing toward its highest immediate return slope?