
Quantifying Systemic Friction Costs Introduced By High Frequency Executive Pivots Based On Uncalibrated Metrics
Frequent directional changes based on uncalibrated data signals erode engineering momentum and compound operational friction far beyond initial resource allocation.
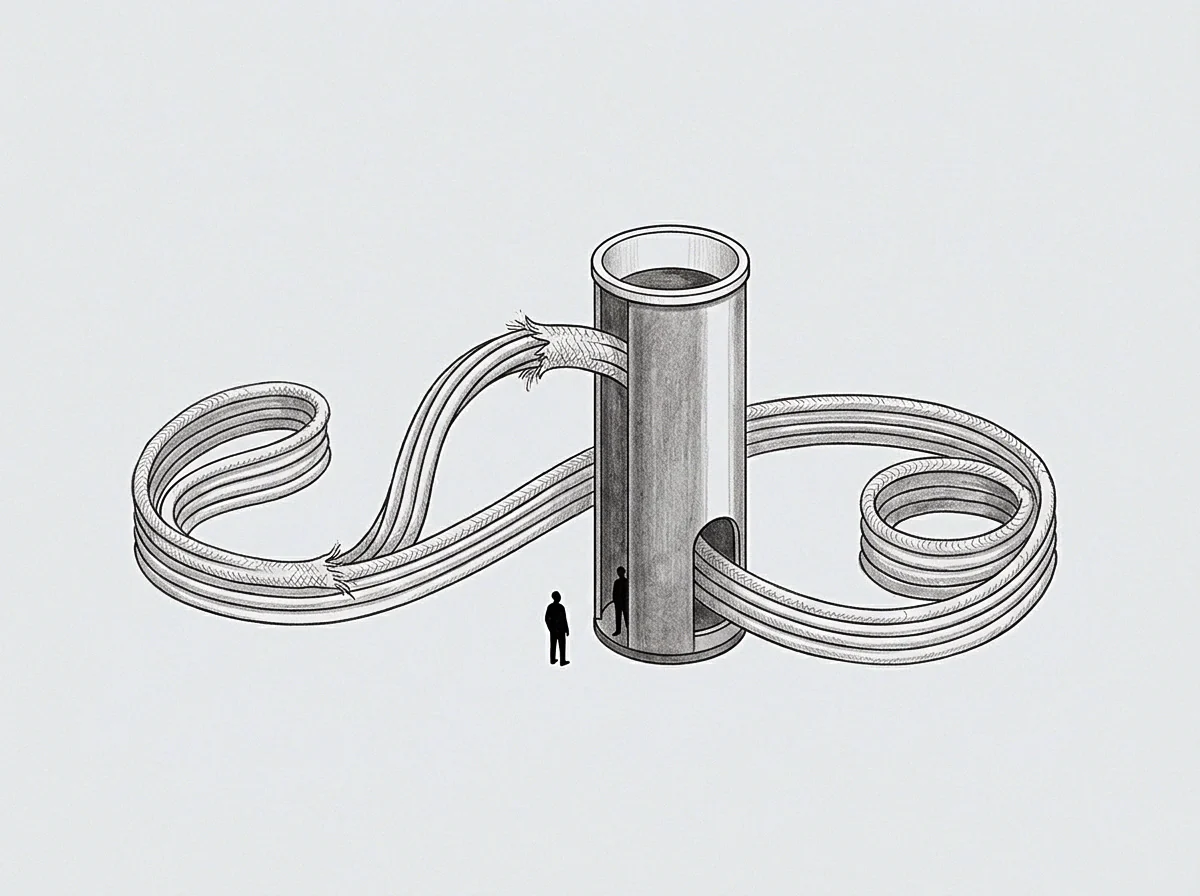
Room
An engineering lead pauses work on a quarterly release because a Monday dashboard reading moved three points. The repository branch sits idle. A single conversion metric dropped over forty-eight hours, and executive leadership interpreted the dip as a structural failure demanding immediate intervention.
Work stops immediately. Teams abandon active feature branches, clear sprint backlogs, and assemble for emergency reorientation meetings. This operational sequence recurs whenever leadership treats early, uncalibrated telemetry as a directive for strategic realignment.

Executive Reaction to Early Metric Volatility
Executive seats frequently act as high-gain amplifiers for uncalibrated signals. When a metric displays short-term variance, the internal demand for immediate action creates a administrative shortcut. The executive selects a cached response: change course, shift resources, and mandate new priorities.
Certainty arrives too fast. This immediate reorientation bypassing baseline observation disrupts ongoing execution across engineering, product, and operational groups. The fast answer feels like active leadership, yet it represents an invariant reaction to normal statistical noise.
Executive directional changes executed before a reading window reaches steady state introduce immediate work invalidation across secondary teams.
The immediate consequence of high-frequency directional shifts is task invalidation. A software architecture designed to handle long-term scale gets refactored midway through implementation to address a short-term metric anomaly. Designers abandon finalized wireframes to draw interfaces targeting an unvalidated audience segment.
The cost of this churn does not appear on the balance sheet as an explicit line item; it manifests as destroyed momentum, lost context, and abandoned code branches. The sprint goals changed three times this month, so no active branch will reach production.

Scale
Raw numbers presented without variance boundaries create false urgency among leadership. Noise masks true signal. An uncalibrated metric is any data stream evaluated without a historical baseline, a defined window of observation, or a statistical reference class.
When executive decisions rely on these raw telemetry spikes, every minor fluctuation triggers a major directional shift.

Why Do Raw Data Spikes Trigger Frequent Directional Shifts?
Leadership often operates without a reference class for new performance metrics. When a company launches a product tier or expands into a new channel, initial data arrives with high variance. Lacking historical baselines, executives evaluate early data points against arbitrary expectations rather than statistical norms.
A five percent dip in daily active users gets interpreted as a product failure rather than expected weekly seasonality. The baseline remains unrecorded. Without a calibrated window to contextualize variations, every data point appears as an emergency demanding strategic intervention.

Separating Noise From Metric Volatility
Metric evaluation requires explicit separation between raw telemetry and structural trends. Uncalibrated management relies on raw figures, whereas calibrated management evaluates data strictly across fixed windows with predefined variance bounds. The following metric miscalibration profiles routinely induce high-frequency directional shifts:
- Lagging Ratio Volatility occurs when executives alter long-term positioning based on short-term ratio changes before the underlying metric sample reaches statistical significance.
- Sample Size Invariance manifests when leadership treats feedback from twenty early adopters with the same strategic weight as data from ten thousand steady-state users.
- Unchecked Outlier Sensitivity happens when a single enterprise customer’s customized request overrides the existing product roadmap for the entire platform.
- Window Truncation Decay arises when management shortens observation windows mid-experiment, declaring failure or success before the baseline measurement period completes.
Evaluating metrics without calibration leads directly to operational instability. The organization spends more energy responding to measurement artifacts than building core capabilities. A metric read over an incomplete window yields pure noise regardless of executive confidence.

Friction
Repeated reorientations force teams to drop half-finished features and clear sprint backlogs. Context switching incurs real expense. When priorities shift every two weeks, the accumulation of incomplete work creates systemic drag across the entire organization.
Technical debt compounds, process documentation becomes obsolete immediately, and cross-functional coordination breaks down under the weight of constant goal realignment.
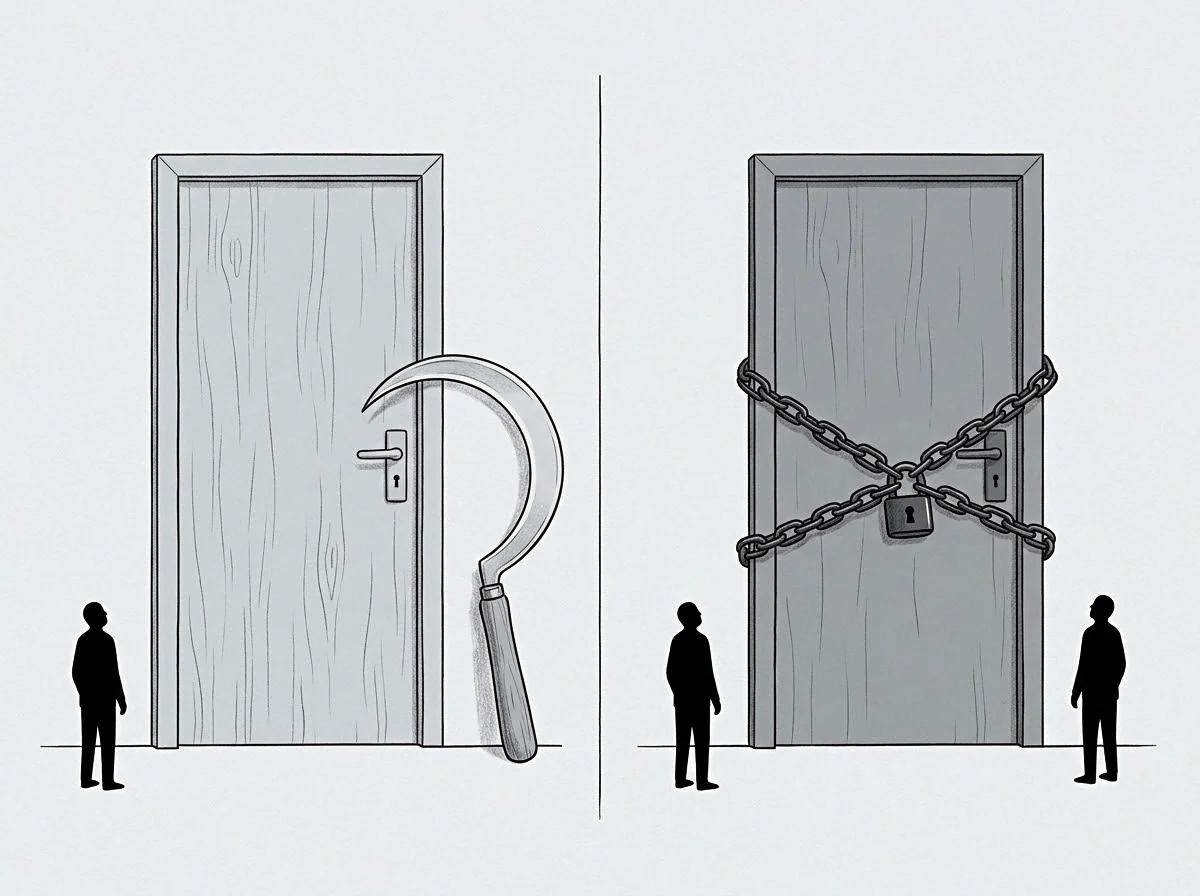
Accumulated Context Switching Overhead
The human and technical overhead of constant strategic shifting accumulates far faster than modern management models account for. When an engineering team abandons a project mid-sprint, the cost extends beyond the discarded code. Engineers abandon partial builds.
Re-establishing mental context on a previous codebase after a two-week diversion consumes substantial cognitive capacity. In industrial manufacturing, re-tooling an assembly line incurs visible physical teardown delays before returning to the main production line; software organizations suffer the exact same physical re-tooling friction, disguised behind silent cognitive fatigue.
Frequent course corrections consume operational capacity while producing zero forward structural momentum.

The Degradation of System Integrity
Systemic friction degrades both software architecture and team execution. High-frequency direction shifts force engineers to build modular abstractions designed to withstand constant change, adding unnecessary complexity to the codebase. Operational debt accumulates quietly.
Over time, the software becomes a fragile patchwork of half-implemented strategic directions, making simple feature additions increasingly expensive.
| Operational Dimension | Reactive High-Frequency Shift | Calibrated Window Management |
|---|---|---|
| Context-Switching Tax | High; teams re-align tools and context every ten to fourteen days. | Low; priorities remain locked for full six-week observation windows. |
| Codebase Attrition | Severe; abandoned branches and half-finished abstractions proliferate. | Minimal; feature branches complete clean merged lifecycles. |
| Measurement Integrity | Zero; observation windows are cut short by sudden directional jumps. | High; datasets reach statistical significance before evaluation. |
| Ordinal Cost Vector | Compounding drag; operational capacity devoted to overhead increases. | Linear spend; operational capacity translates directly to output. |
Systemic friction eventually alters the cultural fabric of the enterprise. When employees learn that current priorities will be invalidated by next week’s dashboard reading, they reduce their emotional and technical investment in active projects. Unmanaged task switching ultimately transforms senior engineers into context-weary maintainers who refuse to commit to long-term architectural refactoring.
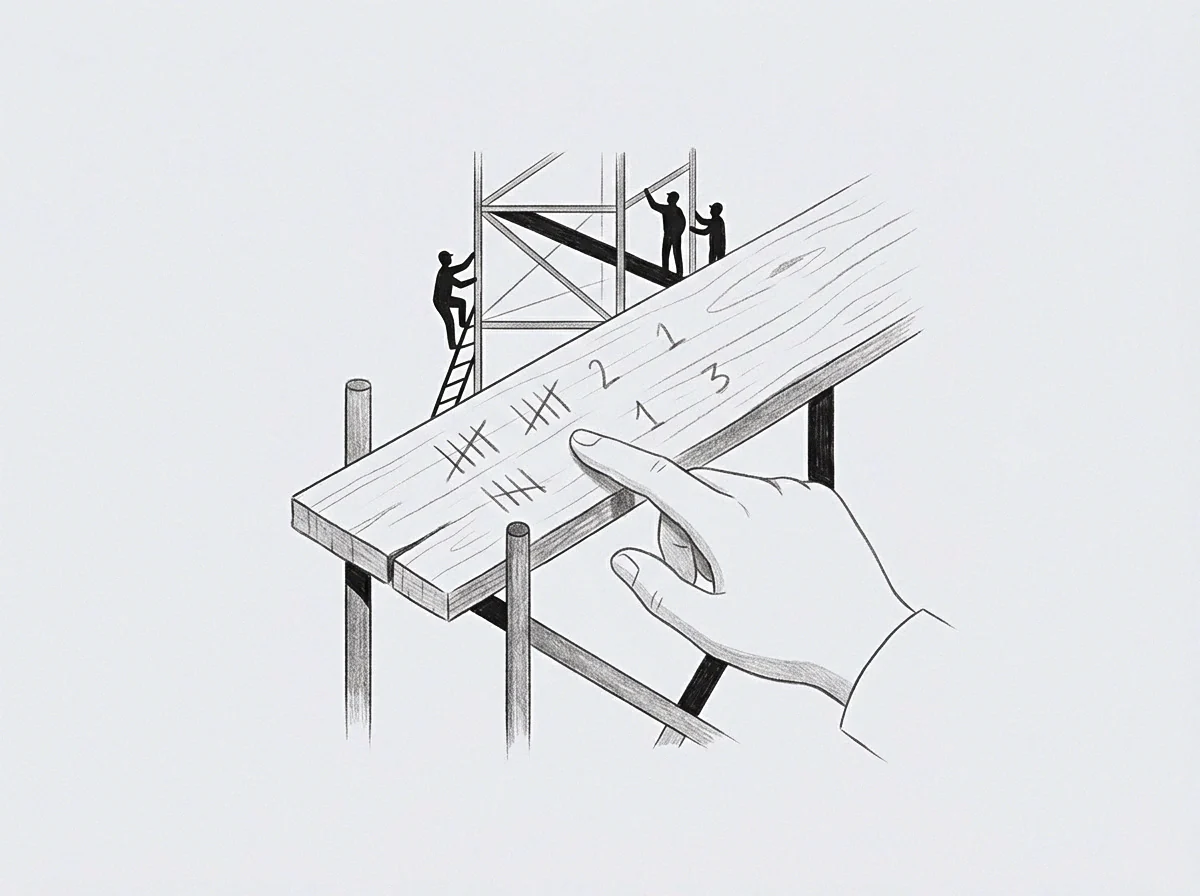
Cost
Consider a product group of forty engineers operating on six-week planning intervals. The annual cash burn for this unit stands at eight million dollars, representing a direct cardinal price. However, the ordinal cost vector introduced by uncalibrated executive shifts paints a far more severe picture of resource destruction.

Quantifying Ordinal Friction Vectors
To quantify systemic friction, measure the delta between available execution hours and productive output delivered over a fixed window. Assume an executive executes a strategic shift every eleven days based on uncalibrated daily conversion telemetry. Each shift invalidates seven days of active work across the product group, requiring four additional days for teams to re-evaluate requirements, re-architect software models, and reschedule dependencies.
Capacity degrades rapidly. Over a six-month window, the forty-person team undergoes fourteen distinct directional course corrections. The mathematical breakdown of capacity loss follows a predictable sequence:
- Immediate invalidation of active sprint work, discarding existing code commits and product specifications.
- Cognitive re-tooling overhead as engineers digest new strategic mandates and clear existing technical pipelines.
- Architecture refactoring to support new requirements without sunsetting partial legacy infrastructure.
- Cross-departmental alignment friction as sales, marketing, and customer success update external messaging.
- Morale decay resulting in lower execution velocity during active operational windows.
When target metrics change faster than system release cycles, technical debt compounds at an exponential rate.

Assumptions of the Forty Person Organization
Under these declared conditions, the team spends less than thirty percent of its total operational hours completing forward-moving feature code. The remaining seventy percent vanishes into context switching, refactoring, and documentation updates. The cardinal price remains eight million dollars in payroll, but the ordinal output matches that of a disciplined twelve-person team working within locked six-week windows.
Research on reference-class forecasting in software projects demonstrates that executive overconfidence in early metric variance consistently undercounts this context-switching tax by an order of magnitude. While research on cognitive task-switching in complex technical environments provides clear bounds for individual productivity loss, exact measurements of cross-departmental alignment friction in hybrid remote settings remain bounded by high variance; under this specific uncertainty, prudent management enforces hard temporal buffers between directional adjustments. Enforcing a mandatory fourteen-day hold on raw signal inputs converts explosive friction vectors back into stable linear cost projections.

Check
Governance mandates that no directional movement occurs without a pre-registered baseline period. Measurement demands patience. Before an executive can alter product strategy based on a performance metric, that metric must complete a validation window designed to filter out transient noise.

Enforcing Fixed Validation Windows
Establishing operational guardrails requires decoupling raw telemetry displays from immediate decision loops. Executives must implement a setpoint and error signal governance structure. Under this framework, raw metric variance within defined boundaries generates zero strategic response.
The dashboard updates every hour, but strategic decisions occur strictly at designated window boundaries.
A functional check protocol requires three specific conditions:
First, the metric must possess a recorded baseline established over a minimum of sixty days of uninterrupted operational telemetry. Second, management must define explicit variance boundaries; fluctuations within two standard deviations of the historical mean are classified as systemic noise and explicitly barred from triggering strategy changes. Third, any proposed strategic realignment requires an invariance test.
The executive must demonstrate that the proposed direction remains optimal across three alternative metric scenarios, verifying that the change reflects live computation rather than a cached reaction to short-term pressure.
Implementing these checks restores operational stability to execution teams. The feedback loop breaks when uncalibrated data directly dictates weekly work assignments. Whether leadership can resist interrupting an active validation window when raw conversion figures plummet over forty-eight hours remains the fundamental test of governance.

Yield
Organizations that preserve fixed measurement periods generate predictable software releases. The seat becomes an anchor of stability rather than an amplifier of anxiety. When leadership respects baseline calibration and protects execution windows from high-frequency intervention, systemic friction drops immediately.

Restoring Steady State Execution Velocity
The yield of calibrated management manifests as high execution velocity, low technical friction, and resilient architecture. The window holds the answer. By locking strategic direction for six to twelve weeks at a time, engineering teams complete complex, multi-stage implementations without the specter of mid-sprint invalidation.
The resulting software features land cleanly in production, providing high-quality, steady-state data that can actually be used to inform future strategic decisions.
A team that finishes its committed build yields far higher ordinal data value than a team that pivots weekly.
Long-term organizational output relies entirely on the discipline of executive measurement. Replacing reactive course corrections with structured validation windows protects both capital resources and human capacity. By anchoring strategic reorientation strictly to complete validation windows, organizations establish a reference class that accurately separates operational momentum from raw telemetry variance.