
Deriving Operational Resistance Fields From Industrial Telemetry Trajectories
Operational resistance fields derive from subtracting empirical telemetry trajectories from commanded setpoint vectors across industrial state manifolds.
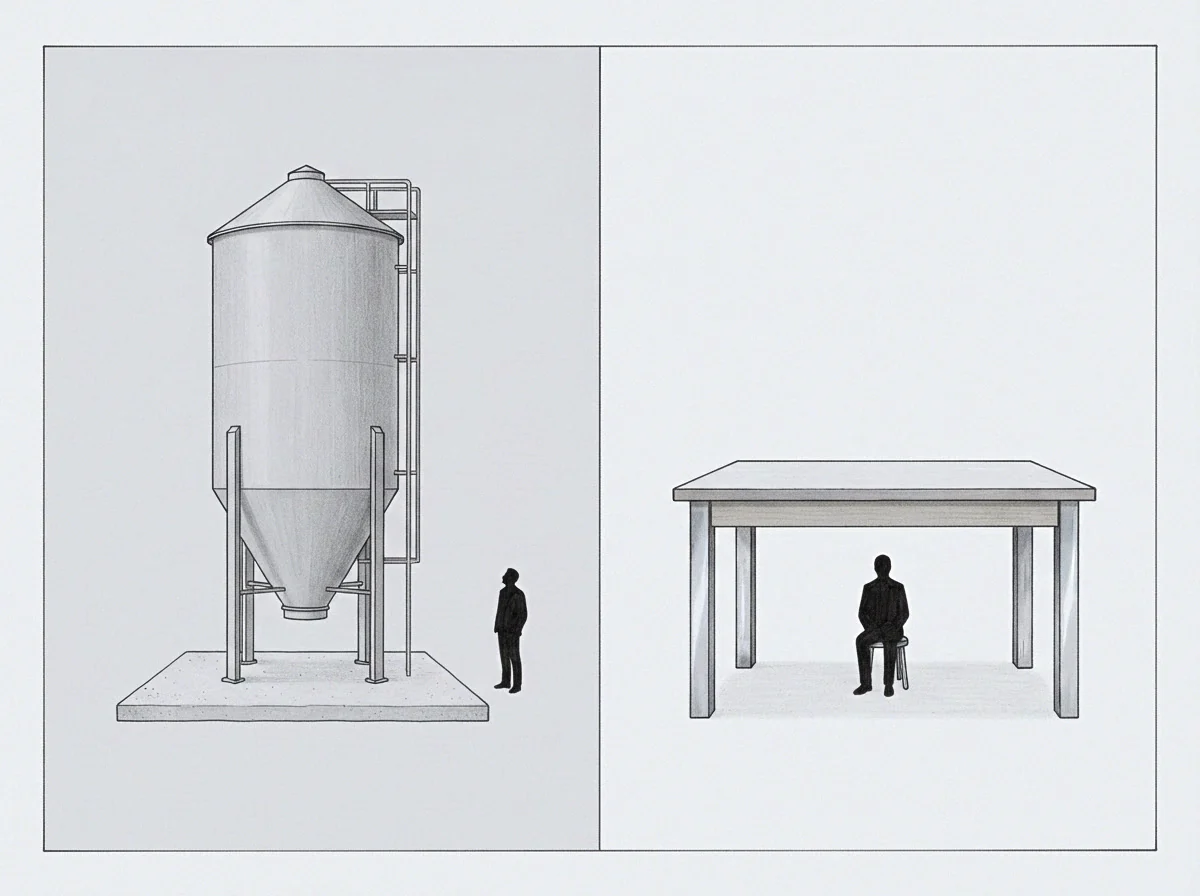
Vector
State observations from continuous plant runs trace trajectories across high-dimensional coordinates of heat, pressure, rate, and mechanical load. Raw sensor data establishes positions in time, but the surface governing machine transitions remains hidden until operators calculate directional derivatives along observed runs. Every physical unit operates along an implicit loss surface where movement costs energy, mechanical wear, or operator intervention.
When a boiler, mill, or compressor shifts between production regimes, the recorded path curves away from a straight geometric line as local mechanical impedance presses against the nominal control setpoint.
The difference between commanded trajectory and observed kinematic path exposes this underlying resistance. Controllers broadcast setpoints based on static equilibrium assumptions, while actual machinery responds to friction, thermal inertia, valve stiction, and manual overrides. When the state vector deflects from the target line, that deflection directly quantifies the local resistance field.
Resistance shows up as persistent curvature.
A system routes around unmodeled mechanical friction whenever continuous state paths bend away from the commanded setpoint.
Computing this field begins by calculating the tangent vector of the empirical run through state space. Subtracting observed acceleration from the commanded force vector yields an instantaneous residual vector, representing the exact resistance exerted by the physical plant at that coordinate. Aggregating thousands of runs across identical operational cycles lets operators reconstruct an empirical vector field spanning the working envelope.
- Observed tangent velocity establishes the realized progression rate through coordinate space, reflecting actual plant throughput under unmodeled load.
- Commanded acceleration error marks instantaneous opposition encountered during setpoint transitions, exposing mechanical drag before component temperature climbs. This differential isolates unmodeled inertia.
- Coordinate deflection angle measures the geometric deviation between programmed targets and realized state positions. A wider angle signals steep localized friction.
The system avoids costly regions.
Engineers examining automated feed lines see this pattern routinely. When operators throttle screw speeds before reaching torque alarm thresholds, telemetry records an early plateau. The equipment never reaches the programmed limit because human vigilance intervenes at the margin.
Treating this plateau as nominal capacity distorts planning, since the intervention itself marks the boundary of system strain.
Shaft
Mechanical assemblies transmit motive force through rotating metal columns, linkages, and fluid couplings, concentrating physical stress along structural members. Inside a high-pressure pumping station, the main drive shaft absorbs torsional shear whenever downstream manifolds throttle slurry volume. Sensor feeds monitoring angular displacement, bearing temperature, and casing vibration record sharp directional changes long before catastrophic failure occurs.
The telemetry trajectory bends across the rotational speed plane, forming a shallow depression where the operator holds the throttle below manufacturer ratings.
This holding pattern reflects defensive operation. Through acoustic feedback and floor vibration, the operator learns that running the drive at nominal speed accelerates packing gland degradation, choosing an inefficient operating point to preserve component life.
Torsion defines the cost axis.
The path of least resistance for the operator leads directly to throughput restriction. Running at lower rotational velocity avoids maintenance downtime at the expense of scheduled yield. When plant management looks only at final production totals, the underlying resistance field remains invisible, masked by an artificial valley created by operational caution.
An operator lowers drive velocity to preserve mechanical packing whenever acoustic resonance threatens structural integrity.
Deriving the field requires mapping the relationship between mechanical stress and throughput loss. Consider two high-pressure slurry lines with identical motor drives. Line Alpha runs under automated supervisory control with rigid setpoints, recording frequent thermal spikes and high component replacement rates.
Line Beta runs with manual trimming, maintaining lower bearing temperatures at the expense of twelve percent daily slurry throughput. Line Beta maps the true resistance field by skirting the thermal boundary through human caution, while Line Alpha repeatedly hits the physical wall.
The cost accumulates in lost volume over the operational quarter. Ignoring this deflection leads management to set unattainable production targets, degrading rotating assemblies while attributing predictable friction to random mechanical breakdowns.
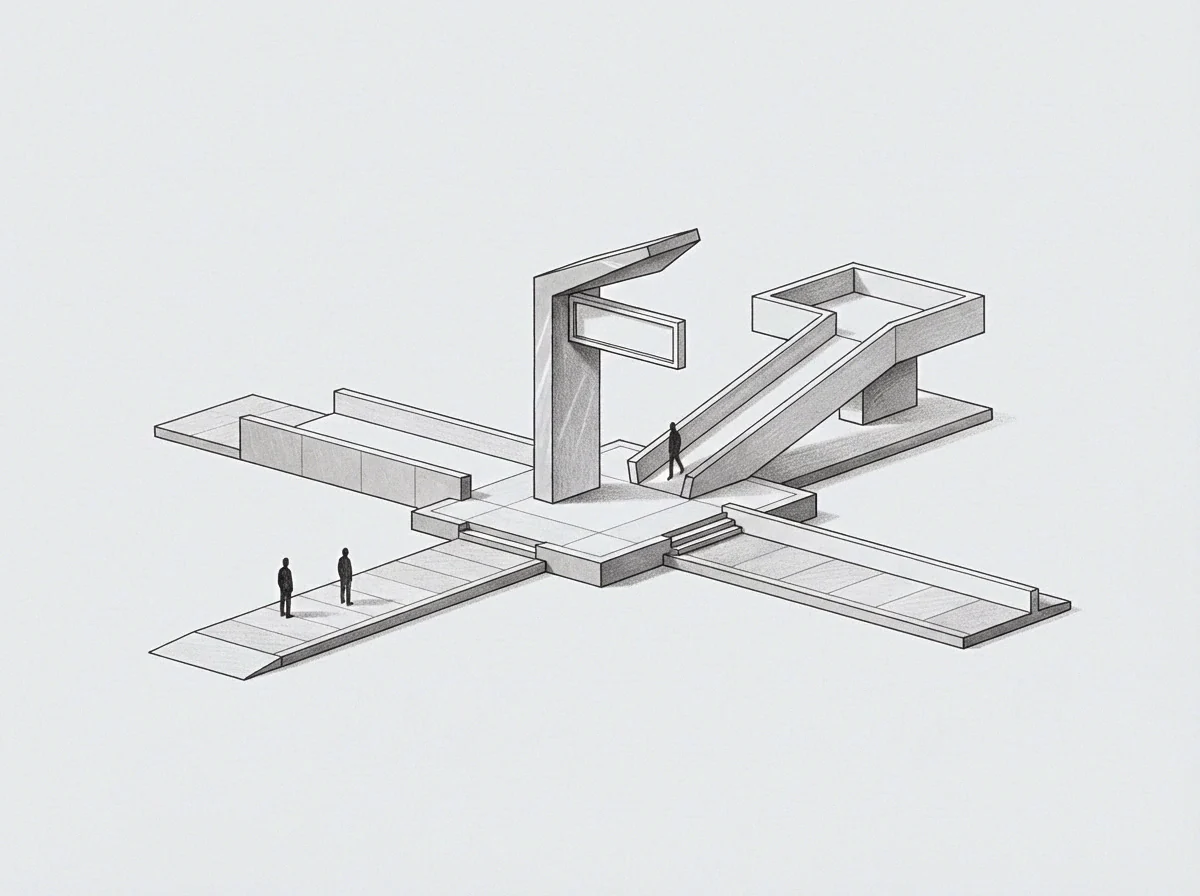
Curl
Rotational components within empirical resistance fields reveal non-conservative forces at work in the process plant. In classical conservative fields, work done moving between two coordinates depends solely on the endpoints. Industrial systems dissipate energy through cyclic hysteresis, thermal accumulation, and variable operator intervention.
Computing the curl of the derived resistance field shows whether drag acts as a predictable potential barrier or as an active loop siphoning energy continuously.
When curl evaluates to a non-zero value across an operational cycle, running the process forward and backward through identical parameters requires different energy inputs. A heat exchanger undergoing continuous fouling shows this exact asymmetry. Descaling schedules and thermal recovery trajectories form closed loops on telemetry plots, enclosing an area proportional to irreversible thermodynamic loss.
| Regime Classification | Field Curl Value | Path Dependency | Underlying Plant Mechanism |
|---|---|---|---|
| Conservative Potential | Zero curl | Reversible state cycles | Static hydrostatic head and elastic pipeline expansion |
| Dissipative Hysteresis | Constant positive curl | Loop area proportional to energy loss | Particulate scaling and thermal boundary layer fouling |
| Nonlinear Drag Vortex | Divergent local curl | Asymmetric recovery trajectories | Cavitation onset and dynamic valve stiction instability |
| Intervention Boundary | Discontinuous curl | Abrupt trajectory deflection | Manual setpoint trim and emergency mechanical bypass |
Energy vanishes into these loops.
Telemetry paths running through high-curl zones trace wide orbital patterns instead of converging on optimal setpoints. A refinery catalytic cracking loop demonstrates this behavior when feed quality drops. Operators adjust airflow, catalyst circulation rates oscillate, and the temperature plot orbits around the desired cracking equilibrium.
The resistance field acts like a vortex, repelling steady-state convergence.
Non-zero curl across a telemetry trajectory loop reveals continuous energy dissipation through irreversible mechanical hysteresis.
Deriving field curl requires computing spatial partial derivatives across neighboring trajectory tracks. Where trajectory density is low, interpolation errors introduce synthetic rotational artifacts. Reliable derivations require overlapping runs collected under varied ambient temperatures and feedstock grades to separate measurement noise from actual non-conservative drag.
A non-zero field curl overturns the assumption of thermodynamic reversibility, proving that process efficiency degrades along closed cycles unless operators clear physical fouling manually.
Manifold
Operational data populates low-dimensional geometric submanifolds embedded within hundreds of telemetry channels. A chemical distillation column may record three hundred individual temperatures, pressures, and valve openings, yet underlying reaction kinetics restrict normal operation to a three-dimensional manifold. Deriving resistance fields requires projecting raw telemetry trajectories onto this intrinsic manifold before computing spatial gradients.
High-dimensional distance metrics distort physical proximity due to sensor redundancy and calibration drift.
Curvature on the manifold isolates mechanical limits. As production demands push flow rates toward pipe capacity, manifold geometry bends sharply upward along the energy axis. Movement along the baseline remains smooth during low-volume hours, but approaches a near-vertical asymptote as equipment nears choked flow regimes.
The boundary of the operational model sits where this geometric curvature approaches infinity.
The boundary rejects further flow.
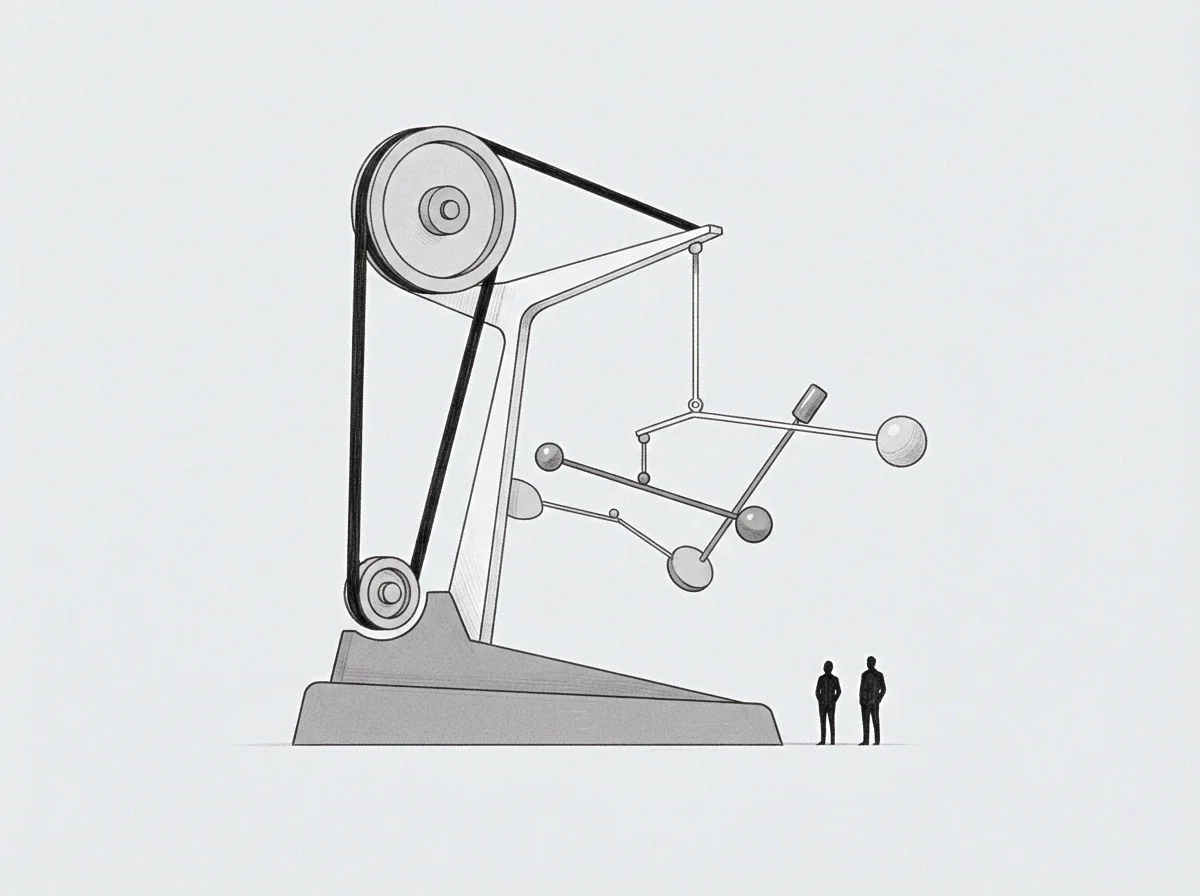
Can Inferred Potential Surfaces Predict State Shifts?
Integrating derived resistance vectors along the manifold produces an empirical potential energy landscape. High-potential ridges correspond to operational zones where components experience severe wear, control instability, or rapid thermal runaway. Valleys represent stable operating basins where machinery runs smoothly with minimal operator intervention.
Telemetry trajectories naturally follow gradient descent into these basins, tracing the path of least mechanical resistance.
Predicting sudden state shifts requires monitoring the depth of these potential basins over time. Mechanical wear, pipeline sedimentation, and ambient temperature shifts erode basin walls. A basin that held state trajectories securely during peak throughput flattens as equipment ages, allowing minor perturbations to push the process into an adjacent, inefficient operating mode.
- Basin depth degradation signals progressive equipment fouling, reducing the operating safety buffer before external shocks trigger plant trips.
- Saddle point migration marks changing thermodynamic equilibrium boundaries caused by ambient climate swings or feedstock variations. State vectors cross these migrating saddles unexpectedly.
- Trajectory dispersion rate quantifies the weakening of restorative feedback forces within the current process regime. Wider path dispersion precedes unstable limit cycles.
Telemetry paths drift toward structural valleys where mechanical resistance reaches its local minimum.
Volume
Mirroring the derived resistance field above the operational baseline exposes unspent latent capacity in the physical plant. Every deflection, loop, and throttle adjustment creates a negative volume beneath nominal design capacity. Inverting this negative field reveals potential capacity trapped behind operational caution.
This volume is no abstract figure; it represents measurable throughput lost to unaddressed vibration, poorly tuned feedback loops, and uncalibrated instrumentation.
The volume locked behind the barrier matches the scale of operational back-off. When maintenance crews accept operator throttling as standard procedure, that volume remains untouched. The wall stays in place because investigating the root cause requires shutdown time, structural inspection, and metallurgical testing.
The plant protects its comfort.
A mineral processing facility provides clear telemetry evidence of this phenomenon. Slurry throughput on Ball Mill Three drops twenty percent every weekday at two in the afternoon. Telemetry trajectories trace an identical downward curve across power consumption, feed tonnage, and sump water addition.
The resistance field derived from this drop indicates an apparent barrier at four hundred tons per hour.
The barrier exists entirely in shift-change protocols. The afternoon operating crew routinely throttles feed rates to minimize slurry sump overflow risks during shift turnover. The physical mill has the capacity to sustain five hundred tons per hour continuously.
The derived resistance field maps an administrative boundary created by work habits rather than mechanical limits.
Latent production capacity mirrors the exact volume of throughput carved away by habitual operational avoidance.
Distinguishing administrative caution from hard mechanical limits determines where capital expenditure yields real throughput gains. Installing larger motor drives on a ball mill achieves nothing when the resistance field stems from operator concern over sump flooding. Telemetry trajectories provide diagnostic geometry, showing where the process moves forward and where it retreats.
Whether future autonomous plant supervisors can distinguish an avoidance field born from genuine mechanical fatigue from one created by administrative caution remains an open empirical question.