
Identifying The Mathematical Point Where Metric Variance Erases System Recovery Thresholds Permanently
Recovery thresholds vanish permanently when metric variance amplitude exceeds the topological distance between the operational baseline and the nearest saddle point.

Bifurcation
A monitoring ledger shows forty days of nominal operating margins while the standard deviation of daily cash settlement times triples. The mean value of the production metric stays anchored within historical ranges, yet the swings between morning troughs and evening peaks expand until they strike the perimeter of daily reserve credit. Systems collapse quietly while their averages look stable.
The arithmetic of resilience depends on the restoring force that pulls an operational state back toward its baseline after an external disruption. When that restoring force weakens, the recovery duration lengthens. In stochastic differential models, this phenomenon appears as critical slowing down.
The mathematical threshold where recovery vanishes completely is the point where the amplitude of metric variance equals the distance between the stable operating state and the nearest unstable equilibrium point.
Every dynamic operating environment functions within an effective potential energy landscape. The baseline state sits in a depression, surrounded by boundaries created by financial reserves, server throughput capacities, or operational recovery windows. Small disturbances displace the operational coordinates up the slope of the depression.
A functioning system slides down the gradient back to the minimum. The restoring vector carries a magnitude proportional to the steepness of that local incline. As internal coordination degrades or external drag intensifies, the curvature of the basin flattens.
The potential well loses stability.
The restoring force of an operating state diminishes in exact proportion to the flattening of its potential well.
Damping drops below the critical coefficient. Consequently, autocorrelations in time-series telemetry begin to climb toward unity. When the system takes longer to dissipate the energy of a small shock, the residue of that shock persists into the arrival window of the next perturbation.
The sequential variances cease to be independent random events. They accumulate along the direction of least structural resistance.
Consider the parameterization of a standard Langevin equation governing an operational metric x over continuous time increment t:
dx = -f(x, r)dt + s dW
In this formulation, f(x, r) denotes the deterministic drift driving the state back toward equilibrium given an environmental parameter r, while s represents the diffusion coefficient scaling the Brownian motion term dW. The deterministic recovery rate corresponds to the first derivative of the drift function evaluated at the stationary coordinate. When parameter r approaches a saddle-node bifurcation coordinate, that derivative approaches zero.
The system routes around depleted capital reserves by stretching payment terms. The variance of metric x expands according to the ratio of diffusion intensity s squared over twice the restoring gradient. When that restoring gradient drops toward zero, metric variance approaches infinity, regardless of how modest the environmental noise term remains.
- Critical Slowing Down marks the mathematical decay of system return speed following standard operational perturbations, measurable by tracking lag-one autocorrelation coefficients across consecutive reporting cycles.
- Variance Explosion develops when internal dissipation capacity drops, causing standard deviations to swallow the operational tolerance margin. The volatility of the indicator replaces the indicator itself as the operational hazard.
- Basin Erosion names the contraction of the topological distance separating the current stable state from the unstable threshold beyond which return trajectories fail.
A system operating under thinning recovery margins sheds its ability to absorb sequential variances long before its headline performance indicators drop.
Curvature
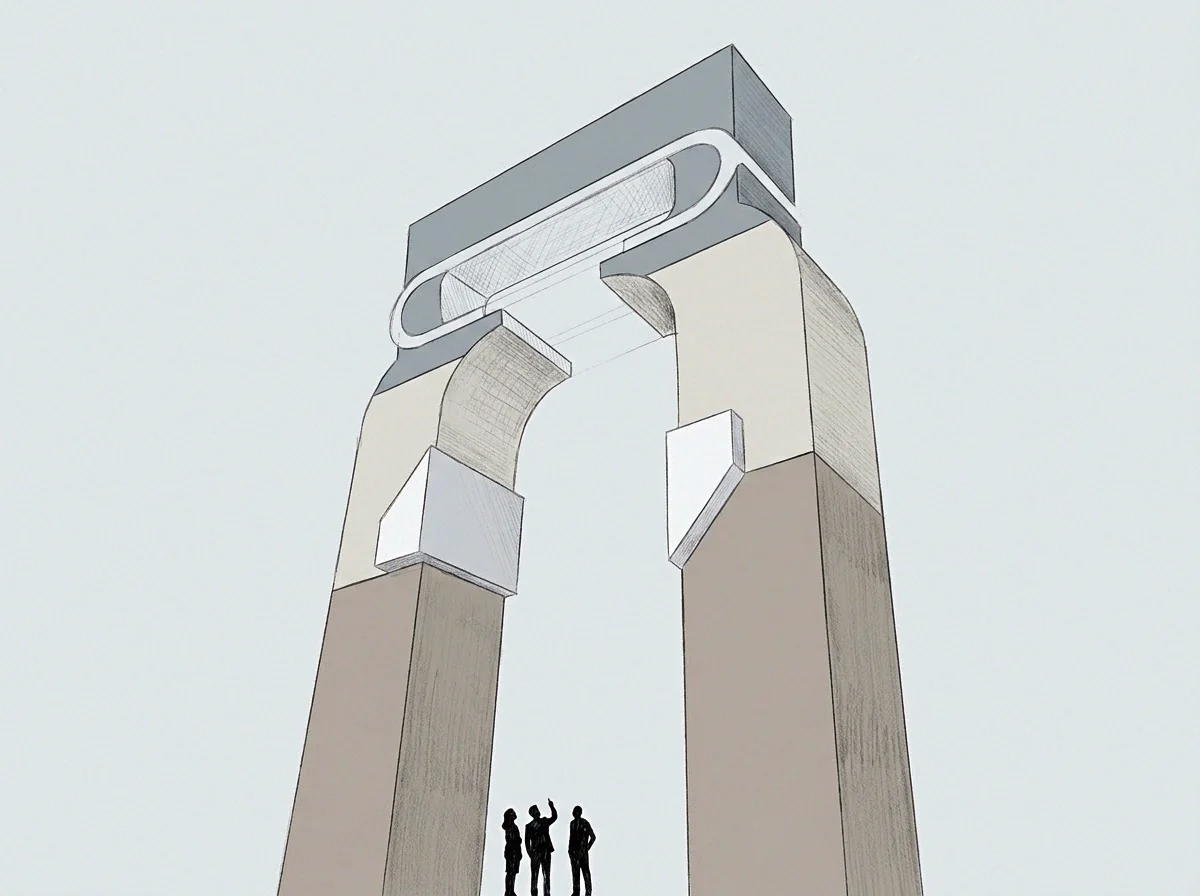
The geometric profile of an organizational or technical baseline determines how much metric dispersion the structure survives. In a deep potential basin, the second derivative of the potential function with respect to the state variable holds a high positive value. This steep local slope generates an aggressive return trajectory whenever a operational deviation occurs.
Recovery trajectories flatten under load.
When operational debt, staffing deficits, or structural balance sheet commitments accumulate, the effective potential function deforms. The valley floor broadens while the ridge separating the current operational regime from an unrecoverable failure state drops in altitude. Mathematical bifurcation theory terms this transformation a fold catastrophe.
As the fold flattens, the restoring gradient drops precipitously. The deterministic equilibrium disappears.
Noise accelerates across the bifurcation point. The operator monitoring an engineering pipeline or capital reserve often mistakes metric variance for random external turbulence. The external turbulence merely provides the mechanical agitation.
The expansion of variance indicates the loss of local curvature in the potential profile of the system. In mathematical terms, the variance acts as an inverse proxy for the stiffness of the system. When stiffness approaches zero, ordinary metric jitter pushes the state across the separatrix.
A metric variance expanding without an increase in environmental noise indicates an internal loss of restoring stiffness.
The separatrix denotes the mathematical boundary surface dividing two distinct basins of attraction. On one side of the separatrix, the system trajectory converges to the baseline operating condition. On the alternate side, the system trajectory falls into a collapsed state, such as insolvency, cascading network deadlocks, or customer attrition spirals.
Under high baseline curvature, crossing the separatrix demands an extraordinary, low-probability exogenous shock. Under diminished baseline curvature, trivial micro-variances supply sufficient kinetic energy to push the system coordinates permanently over the ridge.
Tracking the second derivative of potential energy provides the exact coordinate where stability terminates. In discrete time series, this loss of curvature reveals itself through early warning indicators. The variance computed over a sliding temporal window increases, the distribution of observations skews toward the nearest exit threshold, and power spectra show a concentration of spectral density in the lowest operational frequencies.
The return path closes completely. When a contract binds an entity to deliver performance metrics inside a tolerance band while internal variance matches that entire band width, default becomes an inevitable consequence of stochastic dispersion rather than an intentional choice.
Latch
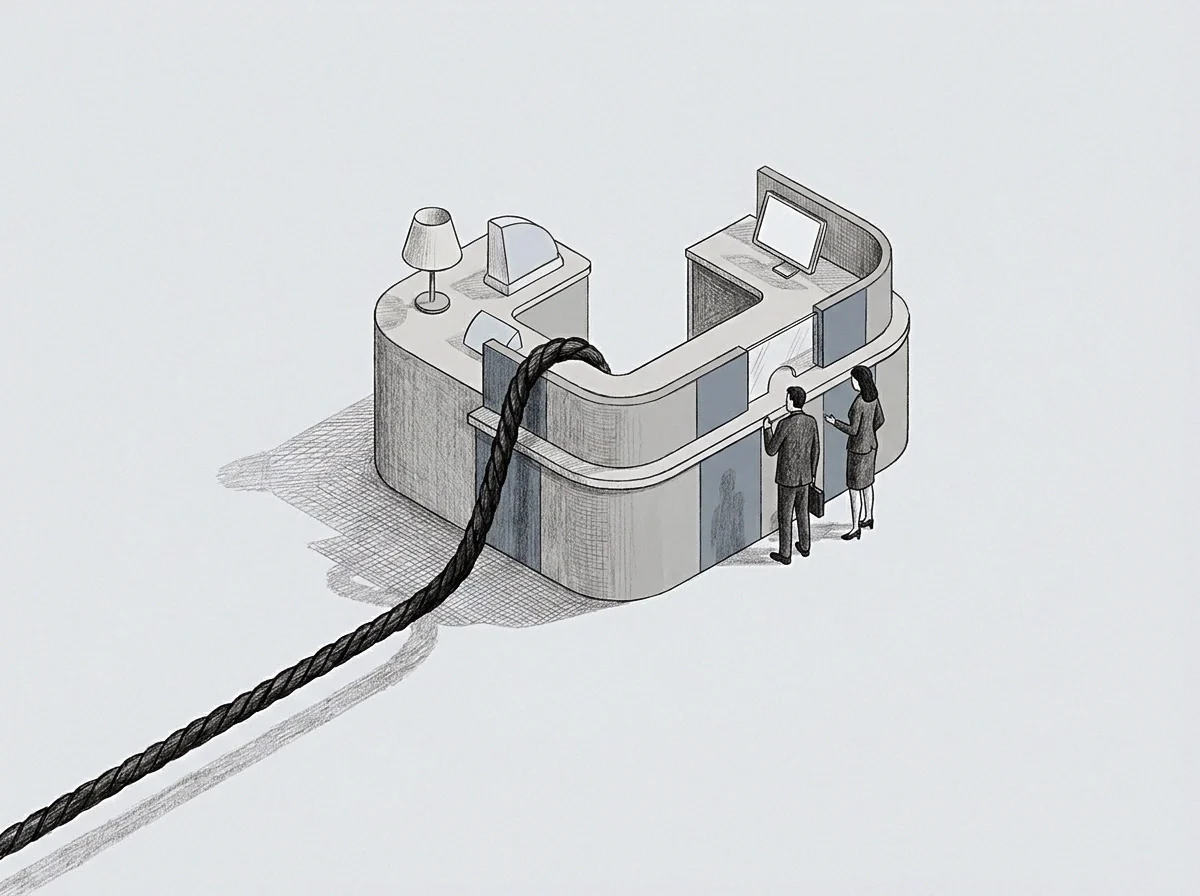
Mechanical latches hold an energy state in place once an operational boundary is breached. In dynamical systems, non-reversible shifts operate through hysteresis loops. Once metric variance pushes an operating state past an unstable threshold, the path back along the same trajectory ceases to exist.
The energy required to reverse the transition exceeds the energy that triggered it by orders of magnitude. State variables settle into permanent traps.
The table below outlines four system archetypes, the specific parameter describing the loss of their restoring threshold, and the operational mechanism that locks the failure state permanently.
| Operating Regime | Observed State Metric | Threshold Boundary Parameter | Latch Mechanism |
|---|---|---|---|
| Short-Term Liquidity | Daily Working Capital Buffer | Credit Line Drawdown Limit | Collateral forfeiture clauses and penalty interest rates prevent balance recapitalization. |
| Software Infrastructure | Request Processing Latency | Thread Pool Queue Capacity | Thread starvation triggers health-check failures, initiating cascading host restarts under active traffic. |
| Talent Retention | Voluntary Turnover Velocity | Institutional Memory Quotient | Senior engineering departures deplete mentoring capacity, accelerating remaining engineer burnout. |
| Supply Chain Logistics | Warehouse Dwell Variance | Physical Dock Holding Margin | Demurrage penalties and yard gridlock eliminate material sorting velocity entirely. |
A founder watching a team burn cash during a product rollout often evaluates runway through a deterministic lens. The arithmetic assumes expenses divide neatly into the bank balance to yield an exact number of calendar months. The operational variance around enterprise sales cycles, invoice collections, and server infrastructure invoices introduces diffusion into that timeline.
When the amplitude of cash flow variance overlaps with the minimum liquidity covenant demanded by debt holders, the covenant activates automatically. The founder loses operational control before the nominal bank account balance reaches zero.
The system routes around missing revenue by delaying payments to critical infrastructure suppliers. Vendor terms contract from sixty days to upfront prepayment. Energy barriers collapse toward zero.
The shift in supplier posture functions as a physical latch. The new commercial constraints remain fixed even if revenue rebounds during the subsequent quarter.
An operational latch establishes a higher energetic barrier to recovery than the barrier that prevented collapse.
We gave you thirty days of forbearance last month, and the contract terms now dictate immediate liquidation upon the next covenant breach.
Basin
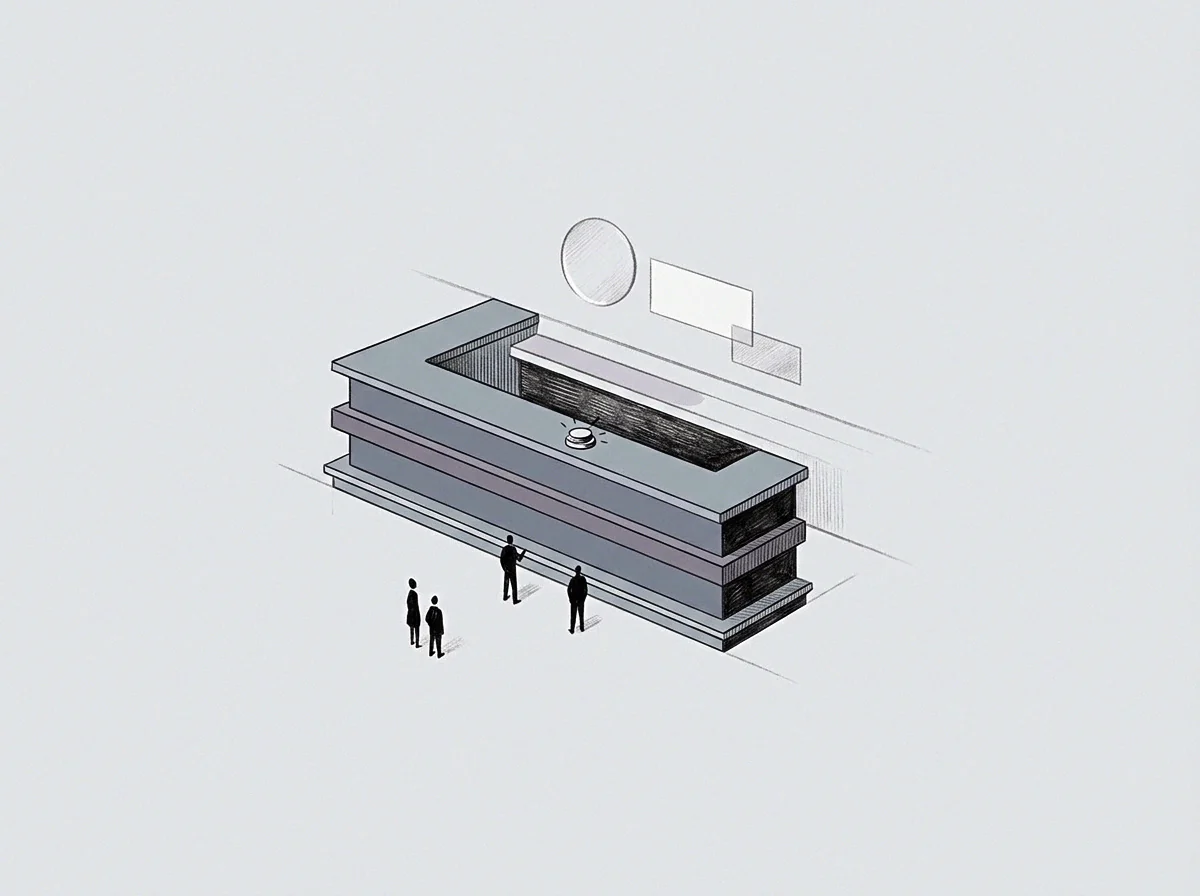
The topological volume of an operational basin of attraction represents the total tolerance an organization retains against variance. When the basin shrinks, metric deviations that once registered as negligible blips trigger unrecoverable transitions. The survival envelope of an enterprise is bounded by its structural basins.
Stochastic perturbations override negative feedback loops.
To quantify this boundary point, one models the probability density distribution of the state variable x against the topological distance to the saddle threshold x_u. Using Kramers escape rate theory, originally derived for chemical kinetics and later applied to complex systems, the mean first passage time tau for a noise-driven system to escape its basin depends on two distinct quantities: the height of the potential barrier Delta U and the intensity of the noise sigma.
tau = (2 pi / sqrt(abs(U”(x_u)) U”(x_0))) exp(2 Delta U / sigma^2)
Here, x_0 represents the coordinates of the stable equilibrium, U”(x_0) marks the curvature of the bottom of the basin, and abs(U”(x_u)) is the absolute curvature of the potential energy barrier at the saddle point. When operational fatigue flattens the barrier Delta U, or when metric variance sigma expands, the exponential term shrinks toward unity. The mean first passage time drops from years to hours.
Instability propagates through downstream components.
Operators frequently attempt to treat the symptoms of metric dispersion without rebuilding the potential barrier. In an engineering context, increasing memory limits on an application server experiencing memory allocation variance postpones the crash while leaving the garbage collection leak intact. In corporate operations, securing an emergency bridge loan without correcting negative unit economics merely extends the coordinate distance to the next cliff edge while increasing debt service burdens.
- Signal Decoupling occurs when executive leadership measures smoothed monthly averages while front-line teams absorb the operational stress of wild high-frequency variances.
- Margin Cannibalization sets in as reserves dedicated to unexpected disruptions are redirected into baseline operational budgets to maintain the appearance of growth.
- Attractor Collapse seals the transition when the operational state crosses the unstable ridge, making baseline performance impossible under existing structural parameters.
Eigenvalues cross into positive territory. When an operating team attempts to absorb structural volatility using personal heroism, the human burnout rate accelerates the reduction of the remaining system buffer, accelerating the terminal transition.
Escape
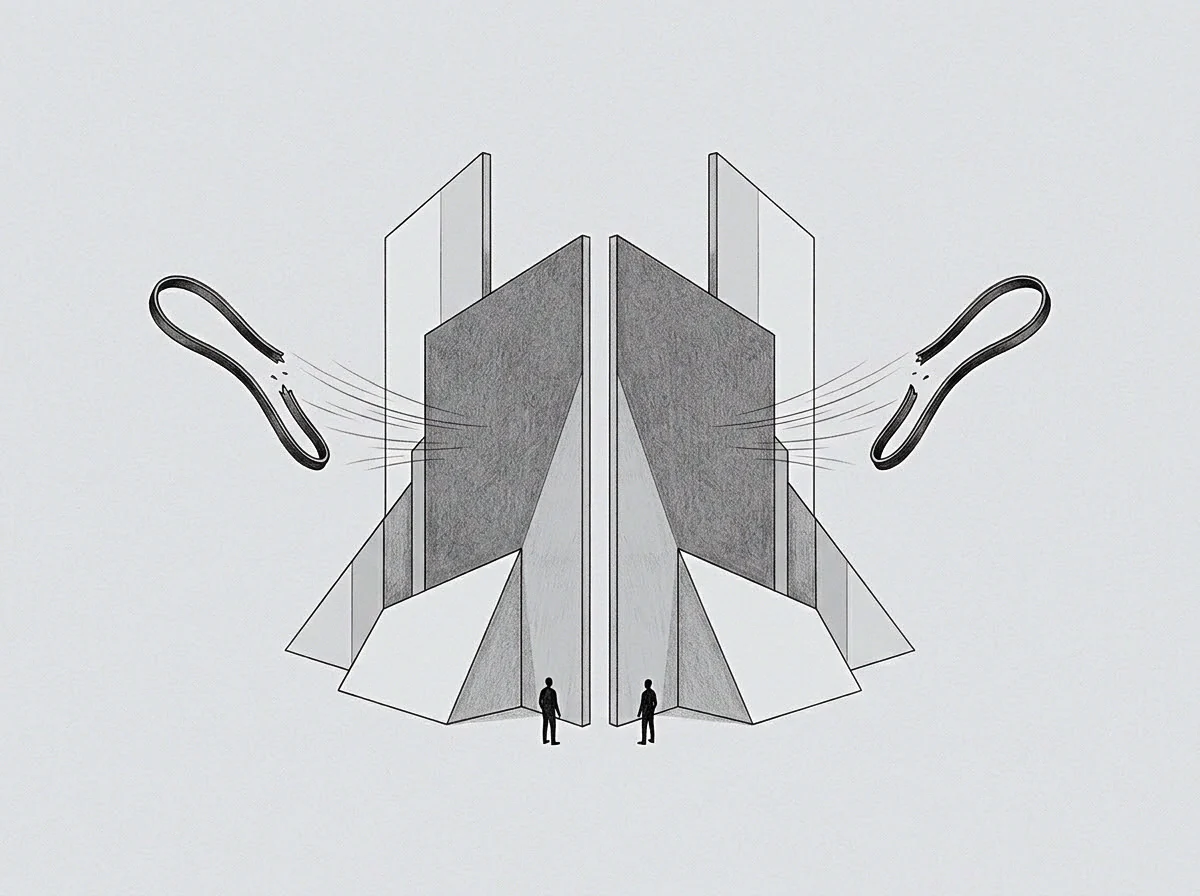
Escaping a degraded attractor once the baseline threshold has been crossed requires abandoning the previous operational configuration entirely. The original baseline no longer functions as an equilibrium point. When variance has erased the recovery margin, searching for incremental optimizations inside the old framework produces immediate failure.
Contract terms freeze during rapid drift.
Variance consumes the restoration margin. The operator facing an erased recovery threshold must locate a distant, alternative attractor and supply sufficient structural energy to force the system into that new basin. In an operational context, this transition means shutting down failing product divisions, executing radical balance sheet restructurings, or re-architecting infrastructure layers from scratch.
The system cannot slide gently back to health; it must be driven over a new topological ridge.
The mathematics of irreversible escape reveal that timing dominates magnitude. An intervention enacted while a system still possesses a positive restoring gradient costs a small fraction of an intervention executed at the saddle point. Once the state passes the saddle point, the deterministic vector points downward toward the collapsed regime.
The system accelerates toward failure on its own inertia. Operator intervention arrives too late.
What remains undetermined is the degree to which internal diagnostic metrics can separate exogenous environmental shocks from endogenous structural softening before the bifurcation point becomes mathematically irreversible.