
Mapping Resource Reallocation Slope Across Enterprise Operating Units
Resource reallocation slope measures capital transfer velocity across enterprise units by mapping operational friction against marginal divisional yield.
Baseline
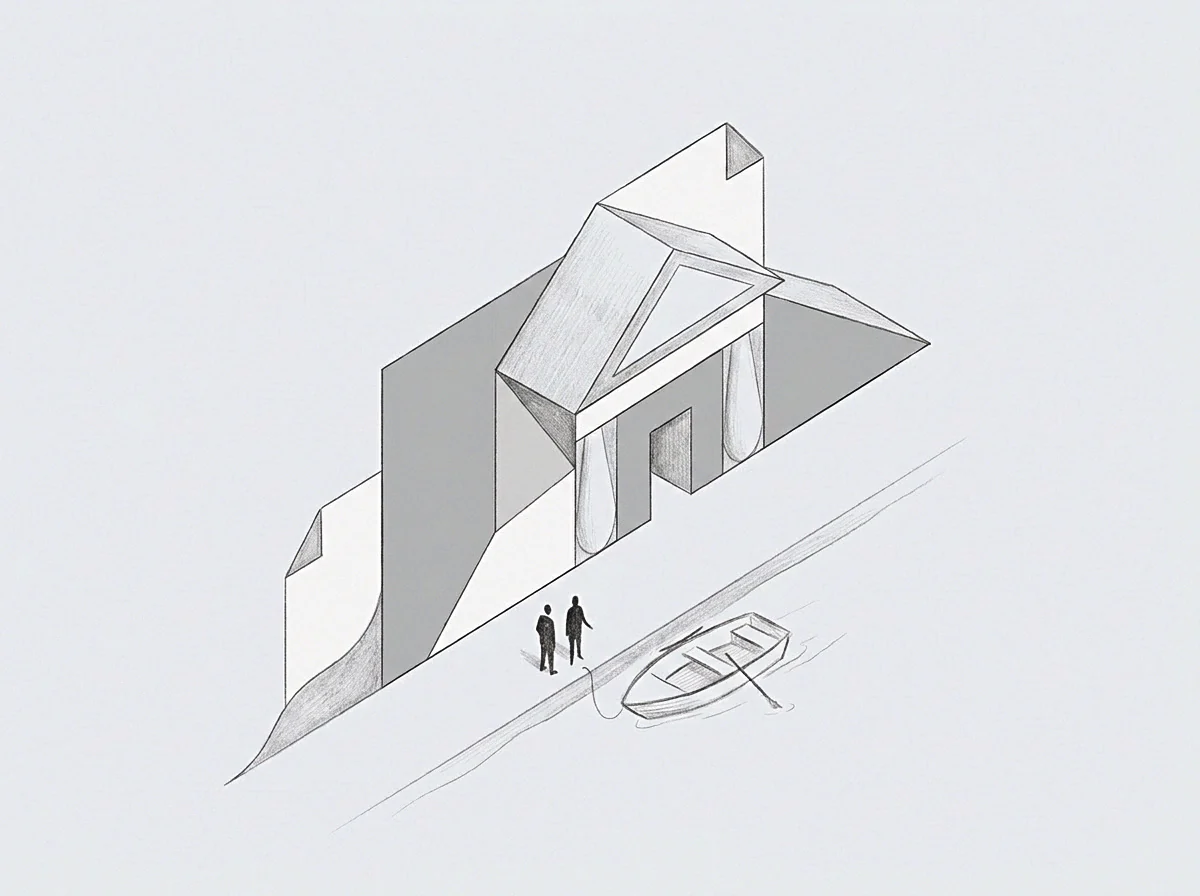
Enterprise annual planning cycles distribute capital according to historical expenditure patterns rather than expected marginal returns. When a division receives funding based on the previous year’s allocation, the operational structure locks capital into existing channels. The static budget becomes an organizational anchor.
Capital remains fixed. Division managers build defensive cases around headcount protection, treating every unspent dollar as a risk to future allocations. Static allocations decay.

Where does unspent capital accumulate during budget cycles?
Division leaders protect headcounts by inflating baseline operational requirements. Operating units generate internal demand calculations that absorb remaining budgets before fiscal year-end deadlines. Capital stays trapped within low-yield divisions because the friction of reallocating funds across divisional boundaries exceeds the immediate managerial benefit.
Yield drops silently. Enterprise leaders observe budget consumption and conclude that resource utilization is optimal, missing the operational drag created by stagnant allocations.
Operating units retain capital by demonstrating operational load rather than marginal return.
A hurdle rate adjustment clause that accounts for unit-level friction alters the reallocation rate within two planning quarters.

Descent
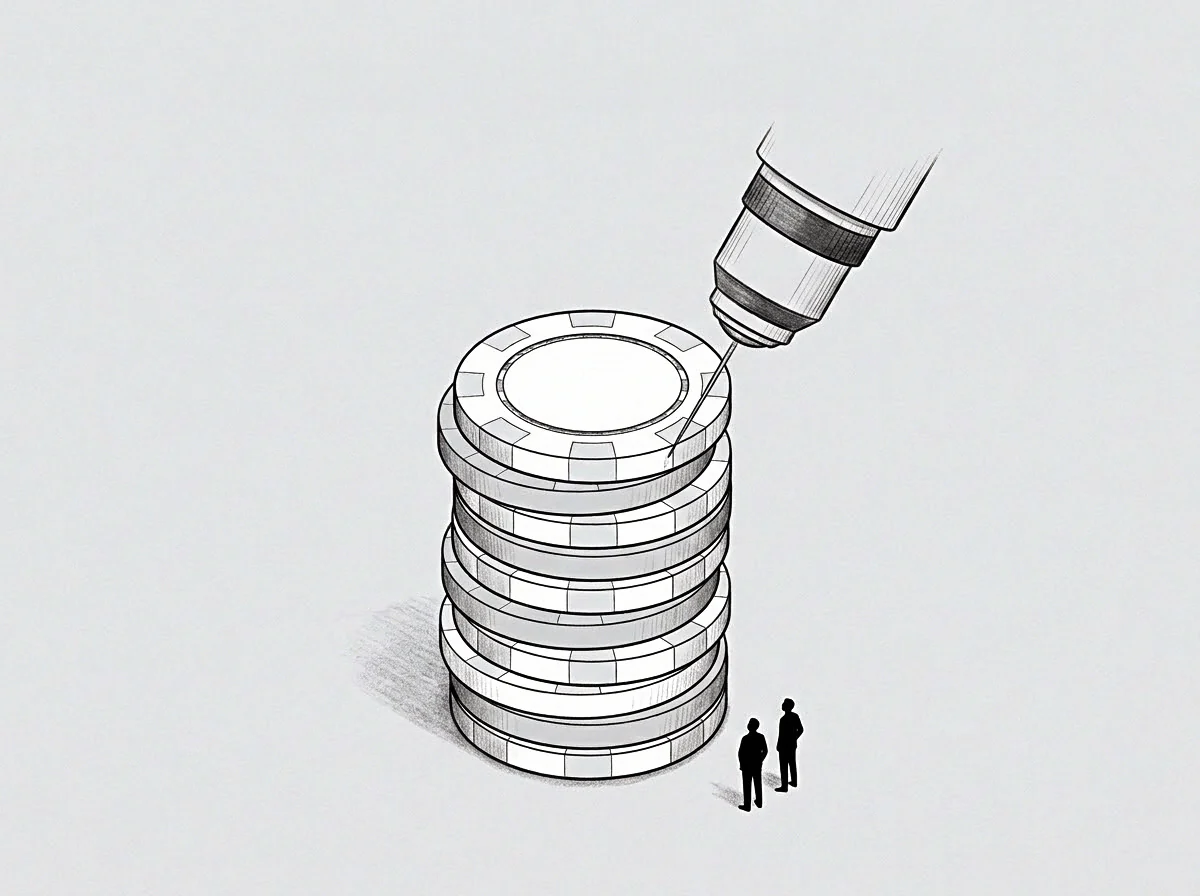
Capital and talent flow along vectors of minimum managerial confrontation. When corporate executives evaluate transfer options, funding shifts toward operating units that present the lowest organizational resistance. Lower resistance rarely correlates with higher strategic yield.
Transfer drag reduces velocity. Resources slide into maintenance divisions, administrative overhead, and mature product lines with predictable but stagnant returns.
The Path of Minimum Operational Friction
Internal transfer friction creates a directional bias in capital movement. High-yield growth divisions often present significant operational resistance, including unproven market dynamics, recruitment delays, and cross-functional dependencies. Capital follows low resistance.
Enterprise finance systems default to allocating incremental funds to divisions with established operational mechanics, avoiding the bandwidth cost required to build new capability vectors.
- Incremental Budget Retention Unit managers request slight percentage increases year over year to avoid structural justification reviews.
- Defensive Talent Hoarding High-performing divisions absorb engineering hours to maintain safety margins rather than releasing capacity to emerging initiatives.
- Asymmetric Hurdle Rates Legacy business lines receive funding under relaxed return expectations while new operating units face severe validation barriers.
When transfer friction exceeds marginal return, capital settles into legacy operational units regardless of strategic priority.
Failing to account for structural transfer drag results in permanent capacity stagnation across high-growth units.

Gauge
Evaluating resource movement velocity across divisions demands an explicit metric for directional drag. Quantitative enterprise modeling maps the slope between capital inputs and operational outputs across all business units. Friction determines rate.
Without explicit slope mapping, reallocations occur as arbitrary top-down mandates that trigger organizational resistance and hidden productivity losses.

Quantifying Transfer Drag Across Operating Units
Measuring the reallocation slope reveals structural bottlenecks within the enterprise architecture. Numbers reveal real resistance. Units with steep transfer slopes require excessive executive intervention to accept or release resources, while units with shallow slopes absorb capital seamlessly.
A structured comparison clarifies how different reallocation mechanisms perform under varying operational conditions.
| Reallocation Mechanism | Transfer Velocity | Friction Coefficient | Operating Unit Impact |
|---|---|---|---|
| Mandated Top-Down Sweep | High initial speed | High informal resistance | Disrupts unit operations and triggers talent exit |
| Hurdle-Adjusted Transfer | Moderate continuous velocity | Low structural drag | Aligns divisional incentives with enterprise yield |
| Market-Driven Internal Bidding | Variable rate | Moderate friction | Favors well-funded legacy units with established staff |
The internal transfer rate of operating talent reflects executive bandwidth constraints rather than strategic intent.
Capital moves toward units where executive sponsor intervention is absent.

Mirror
Inverting the map of operational resistance highlights areas where unallocated strategic potential sits idle. When a system routes around difficult organizational transfers, unprocessed operational material accumulates behind the structural wall. Capacity sits idle.
The size of the avoided reallocations corresponds directly to the volume of latent potential locked within stagnant divisions.

Latent Potential in Deferred Projects
Enterprise systems route around complex organizational shifts, creating dense pockets of unspent engineering, sales, and operational capacity. The transfer stalls. Operating units that successfully resist resource clawbacks build latent reserves that yield declining marginal value over time.
Unprocessed material accumulates. Exposing these avoidance coordinates allows leadership to mirror the resistance map and identify where capital capitalizes on underutilized operational talent.
A structural transfer penalty applied to stagnant divisions releases trapped engineering capacity into growth vectors.
Operating budgets were promised for three years to maintain team stability.
Ascent
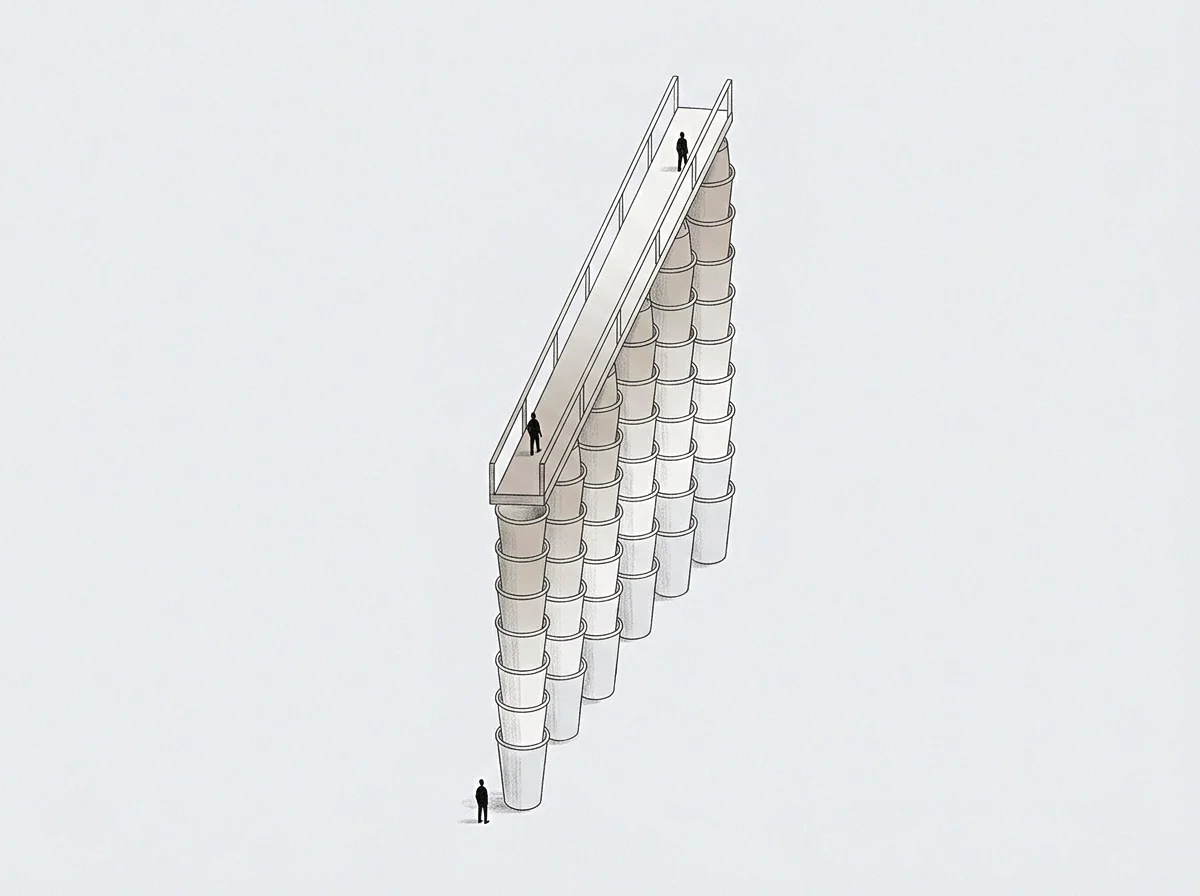
Directing resources toward high-friction, high-yield divisions demands continuous force against organizational inertia. Moving capital against the path of least resistance incurs real structural costs in bandwidth, executive attention, and temporary divisional friction. Direct force shifts resources.
Realignment demands discipline. Enterprise leaders who calculate the slope correctly offset these friction costs by capturing high-gradient growth opportunities before competitors adapt.
Executing Structural Vector Realignment
Reallocating resources effectively across enterprise boundaries follows a strict sequence of operational adjustments. Budgets freeze overnight. The enterprise operational model must adjust internal transfer pricing, realign divisional incentives, and enforce objective hurdle rates across every business unit.
- Establish an absolute baseline measurement of current operational resource allocations across all core business units.
- Compute the unit-level friction coefficient based on headcount transfer delays and budget reallocation lag times over four fiscal quarters.
- Apply a dynamic hurdle rate discount to divisions demonstrating zero resource mobility during the previous annual planning window.
- Reallocate ten percent of unspent capital pools directly into higher-gradient operational divisions before quarter-end reconciliation.
The enterprise operating model stabilizes once the capital transfer slope balances marginal operational yield across every unit.