
Measuring Latent Distortion Vectors Across Unsampled Intermediate Management Buffer Boundaries Under Structural Entropy
Unsampled intermediate management buffers absorb variance, masking structural entropy until latent distortion vectors breach operational limits.

Desk
A project runs for nine consecutive months where executive status reports record steady progress while true throughput declines by forty percent. The executive team reviews surface metrics every two weeks, observing clean milestone sign-offs, stable resource utilization figures, and green status indicators across all active workstreams. Below the executive layer, software engineers and team leads modify build architectures weekly to bypass broken internal dependencies, accumulating technical debt that never appears on any dashboard.
The intermediate management tier absorbs ground-level friction, translating daily delays into generalized progress statements to protect team capacity from external intervention. Variance accumulates silently.
This dynamic creates a growing divergence between reported progress and actual systemic health. When performance monitoring relies solely on boundary metrics captured at the top tier and the final output layer, the intermediate space remains unobserved. Structural decay operates within this unmonitored space, accumulating latent force without altering the external indicators until the system breaches a tipping threshold.

The Unsampled Operational Margin
Middle management layers frequently function as shock absorbers designed to reduce volatility before reports reach senior executive levels. In systems characterized by high complexity, these buffer tiers perform necessary filtering, preventing minor operational noise from triggering macro-level disruptions. The boundary between the intermediate buffer and executive observation becomes an information sieve.
Signal suppression occurs when lower-tier managers absorb operational friction rather than escalate failure signals upward.
Systemic stability reports routinely mask local operational degradation until capacity reserves deplete completely.
Operational drag remains hidden as long as intermediate buffers possess sufficient excess capacity to absorb local failures. When structural entropy rises across the broader organization, the capacity of these buffers to absorb friction diminishes. Ground-level teams spend increasing hours constructing workarounds rather than executing primary tasks.
The metric stays flat. The system routes around friction while the true cost of execution scales non-linearly across the unmeasured buffer boundary.

Attenuation
When structural information flows through multiple layers of delegation, localized noise is systematically filtered to project stability. This process changes raw signals into normalized summaries. Middle management buffers apply implicit filtering rules to protect operational bandwidth, stripping out high-frequency variances that signal emerging systemic bottlenecks.
The error signal disappears.

Structural Decay Across Unmonitored Layers
Internal management buffers modify raw performance data through selective aggregation. This continuous smoothing process creates a latent vector of distortion, defined as the vector difference between the actual state of ground operations and the synthesized state reported across the buffer boundary. As structural entropy expands within an organization, the magnitude of this distortion vector scales directly with the depth of unsampled management layers.
- Variance Suppression occurs when operational teams resolve system failures informally without recording the labor hours spent on the resolution, hiding capacity erosion from baseline tracking.
- Buffer Saturation marks the threshold where intermediate management layers exhaust their ability to absorb ground-level friction, causing sudden, unannounced delivery failures at the executive interface.
- Signal Homogenization describes the continuous conversion of complex qualitative risks into standardized, low-variance performance scores during executive reporting rollups.
- Latent Vector Accumulation defines the compound spatial divergence between the real path of execution and the planned trajectory maintained by top-level leaders.
Left unmonitored, intermediate management buffers convert acute operational problems into chronic structural drag. The organization operates under the illusion of efficiency until local workarounds fail under unexpected volume pressure.
Masking operational noise at intermediate boundaries accelerates the accumulation of structural entropy across the entire management system.
Failure to sample intermediate buffer boundaries guarantees that executive decisions rest on idealized representations of operational capacity. When leaders allocate capital based on smoothed variance data, they inadvertently fund invisible systemic friction, compounding structural entropy until total project remediation becomes mandatory.

Gradient
Calculating the deviation between expected operational efficiency and actual output demands a scalar measurement of unresolved systemic drag. The value axis represents the intended productive capacity of the enterprise. Along this axis, performance gradients reflect the true path of execution effort.
When management layers conceal operational resistance, the negative gradient steepens, signaling that workforce energy is consumed by systemic workaround mechanisms rather than core production goals.

Which Signal Properties Reveal Unsampled Distortion Vector Magnitude?
Discrepancies between direct resource allocation metrics and end-stage deliverables indicate hidden operational resistance. By projecting the negative gradient above the operational baseline, a surveyor maps the latent potential trapped inside unsampled buffers. This unspent volume represents the absolute quantitative difference between nominal capacity and realized throughput.
Consider an engineering division where forty full-time employees show ninety-five percent utilization on time tracking systems, yet feature release velocity drops by half over three financial quarters. The traditional management audit inspects completion rates at the team lead level and financial burn at the director level. Both parameters report within standard tolerances.
Measuring across the unsampled intermediate boundary reveals that thirty percent of total engineering effort goes toward manual database reconciliations required by an unrecorded architectural split between legacy and current systems.
Unsampled buffer space acts as a reservoir where systemic drag expands without triggering standard performance alarms.
The latent distortion vector is formally expressed as the spatial integral of operational variance calculated across all unsampled intermediate nodes. The magnitude of this vector indicates the precise energy lost to internal friction under structural entropy.
When an organization defines performance exclusively by boundary outputs, intermediate management buffers inevitably construct equilibrium states designed to minimize local accountability. The baseline contract between executive leadership and middle management changes from output maximization to variance containment.
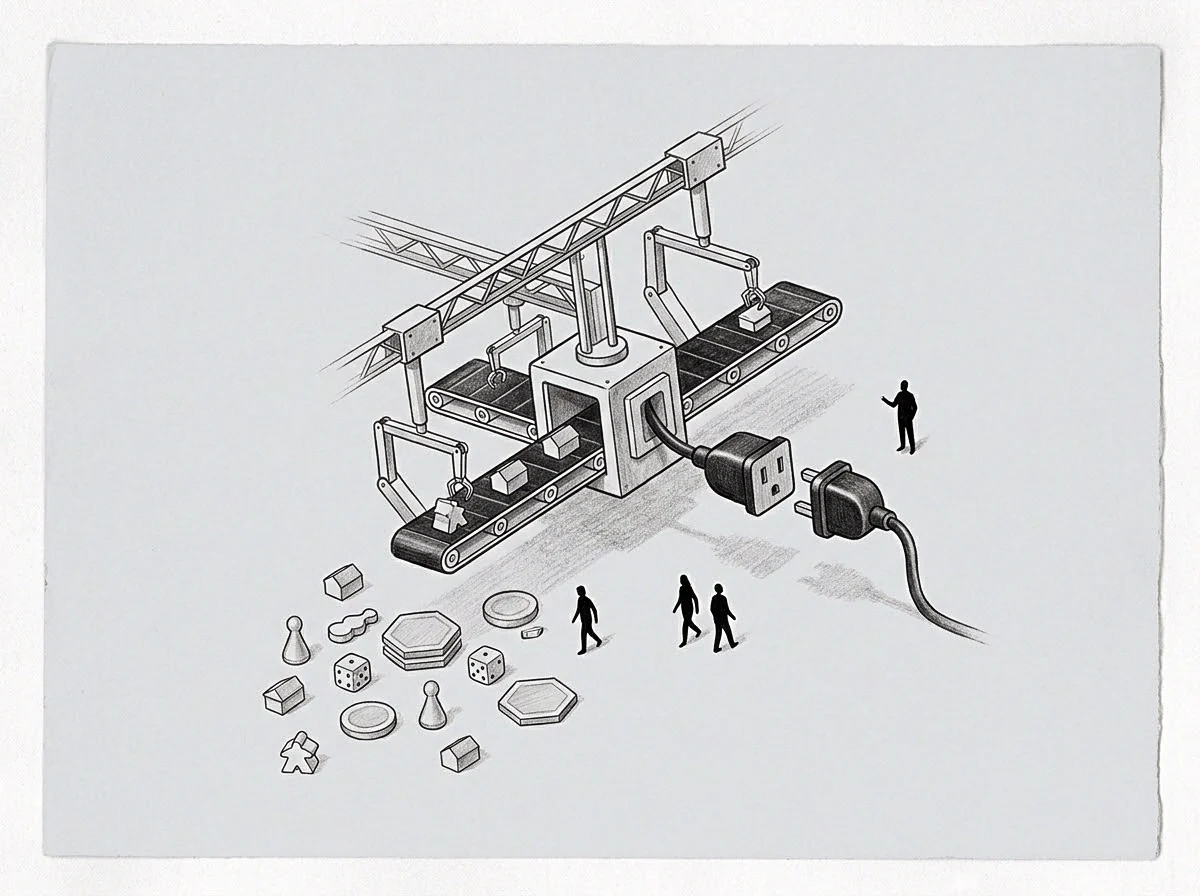
Seat
Consider an enterprise operating two distinct business units over a three-year observation period under identical funding allocations. Business Unit A employs traditional boundary monitoring, measuring inputs at the executive level and outputs at the customer delivery point. Business Unit B implements continuous sampling across intermediate management buffer boundaries, tracking raw friction metrics, cross-departmental handoffs, and localized workarounds.
| Sampling Regime | Error Latency | Vector Variance | Capacity Cost | Entropy Damping |
|---|---|---|---|---|
| Top-Only Boundary Sampling | 180 Days | High Latent Skew | 35% Operational Drag | Low Damping Capacity |
| Periodic Intermediate Sampling | 45 Days | Moderate Variance | 18% Operational Drag | Moderate Damping Capacity |
| Continuous Vector Measurement | 7 Days | Minimal Skew | 5% Operational Drag | High Damping Capacity |

Structural Architectures and Distortion Profiles
Comparing information routing methods demonstrates how direct sampling changes operational visibility. Business Unit A maintains clean executive dashboards for two years, followed by a severe delivery crisis when intermediate buffer capacity breaks under market expansion. Business Unit B surfaces small, continuous operational failures, allowing real-time structural adjustments that prevent macro-level failure.
Remediating structural entropy across unsampled management boundaries involves a systematic shift in how measurement instrumentation is deployed throughout organizational layers.
- Establish direct, automated sampling probes at intermediate departmental handoffs to measure true task latency without human intervention or summary editing.
- Calculate the variance vector between raw operational telemetry and middle management status reports on a monthly schedule.
- Map localized workaround patterns to quantify the volume of shadow labor dedicated to absorbing systemic defects.
- Realign executive performance incentives to reward early error signal detection rather than surface metric stability.
Direct measurement of intermediate buffer states converts hidden structural drag into actionable optimization vectors.
The operational reports presented to executive leadership reflect calculated risk mitigation strategies chosen by intermediate managers to protect their operational teams from external disruption.
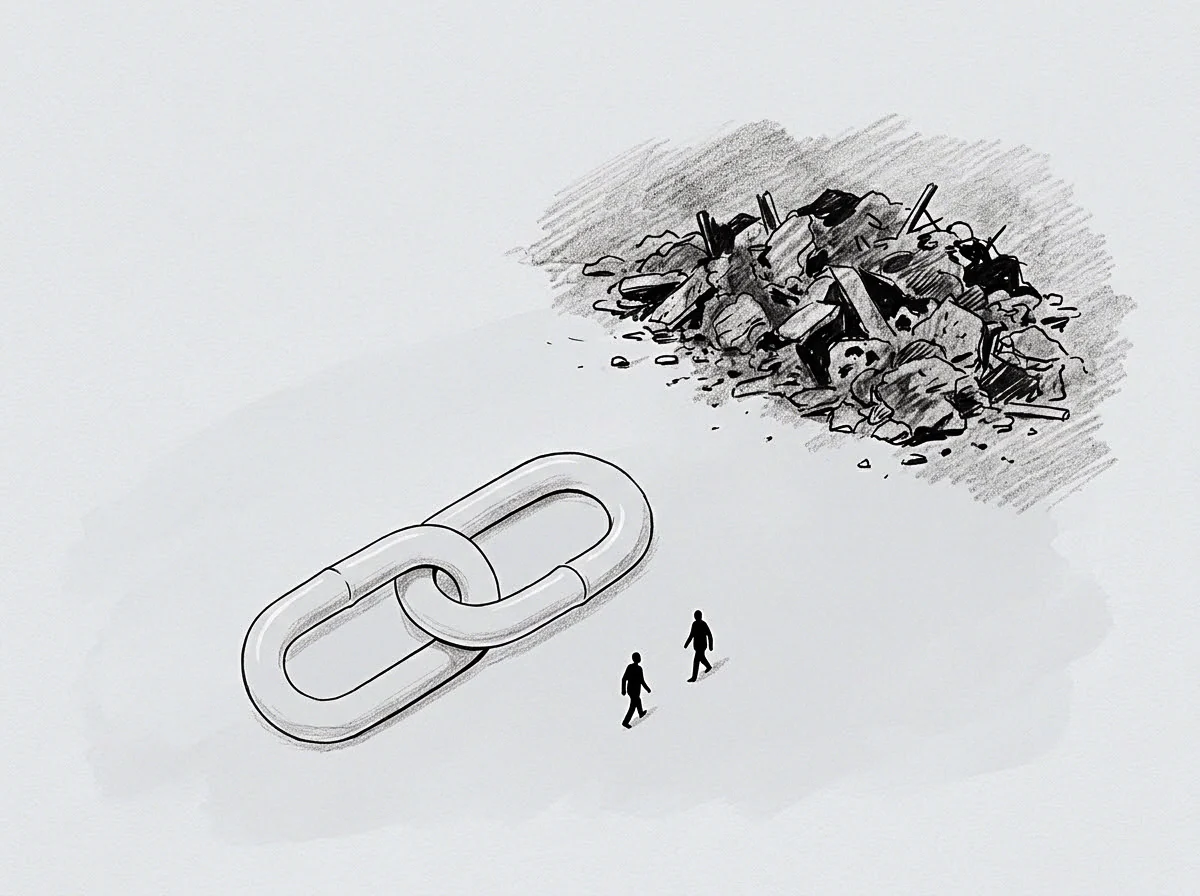
Decay
The wall of an operational model represents the outer limit where existing management assumptions fail to process reality. Discomfort along this boundary indicates that active computation is taking place, surfacing structural limits that were previously hidden by buffered reporting. When an organization reaches this boundary, traditional performance metrics cease to yield actionable information, and the system must either absorb the distortion or alter its internal measurement architecture.
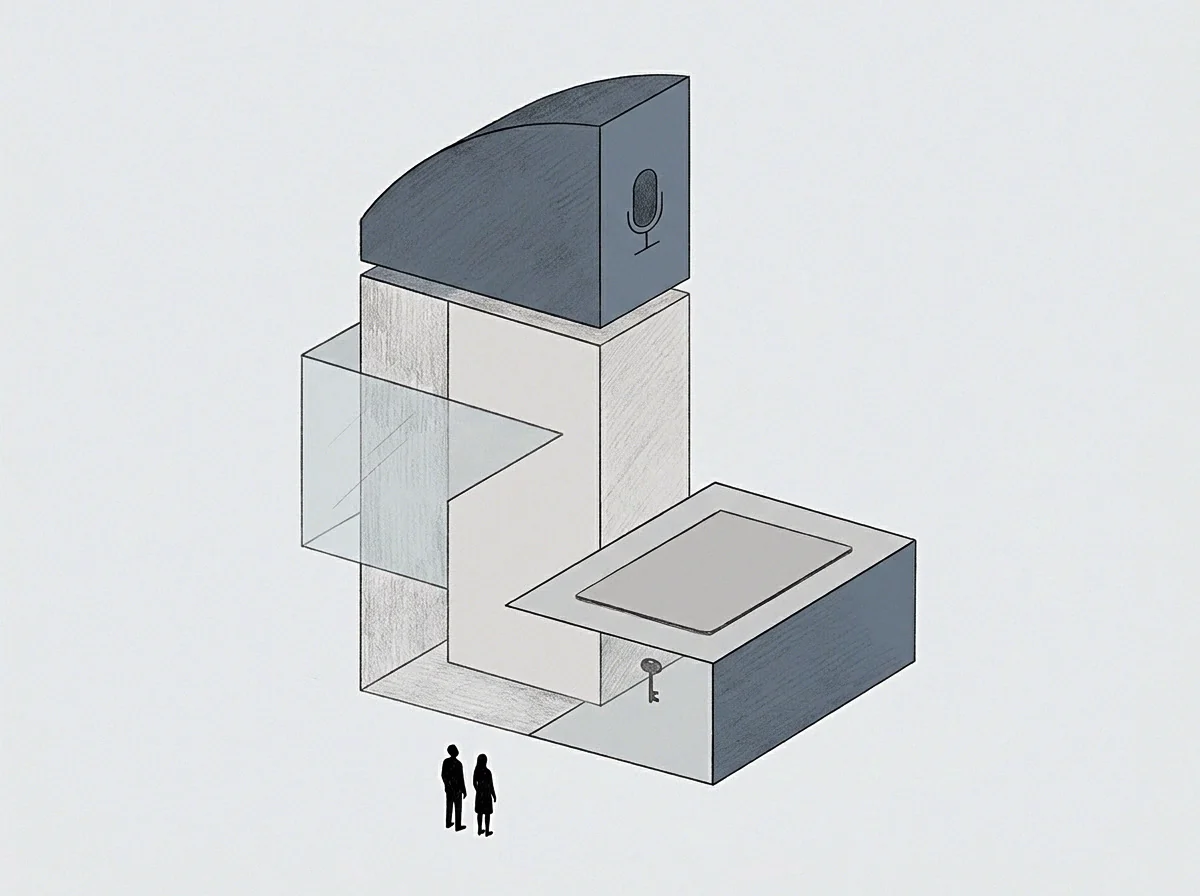
Bounding Entropy at the Model Boundary
Restoring operational integrity involves forcing raw data sampling across previously ignored intermediate management zones. The cost of this intervention is paid in temporary operational friction, as hidden inefficiencies are surfaced and processed publicly. Avoiding this computation merely shifts the cost into cumulative structural decay, guaranteeing a larger failure event when intermediate buffer capacity inevitably depletes.
Operational throughput stops when structural entropy overwhelms the system’s ability to execute basic tasks. The unspent volume trapped inside unsampled intermediate boundaries represents both the true cost of historical management neglect and the precise latent potential available for future systemic recovery. By systematically measuring latent distortion vectors across unmonitored management nodes, organizations regain the ability to map operational reality, bound structural decay, and align strategic intent with ground-level execution capacity.
How far can an organization extend direct intermediate sampling across human management structures before the administrative cost of measurement exceeds the value of the recovered operational volume?