
Measuring Value Gradients Across Decentralized Business Operations
Value gradients across decentralized operations express the slope between localized operational output and central resource deployment without imposing moral grading.

Vector
Separating accounting output from the slope of operational value shows how autonomous units actually create or consume capacity. Centralized ledgers log finished transactions without capturing the rate of operational drift. A branch within a decentralized network can easily show balanced books while quietly losing productive throughput.
Tracking value gradients requires monitoring the rate of change in returns across neighboring units rather than reviewing standalone quarterly summaries.
When an operating node takes the easiest route to complete work, local yield looks steady even as systemic capacity drops. The local gradient captures that divergence directly. Measuring the directional path of output across decentralized nodes exposes structural drag before it shows up on balance sheets.

Calculating the Slope of Localized Performance
Measuring an operational trajectory depends on establishing a stable value axis across independent units. When central leadership assesses decentralized branches solely on gross revenue, site managers often cut corners by running equipment down, deferring service calls, and passing difficult orders to nearby facilities. Ordinal tracking addresses this gap by comparing the directional efficiency of completed work against consumed resources.
The local gradient records operational direction long before central accounting registers structural decay.
Operational vectors reveal structural realities across distributed sites:
- Resource Misallocation occurs when high-performing regional nodes subsidize struggling peripheral outposts to maintain aggregate corporate projections.
- Capacity Bleed develops as distributed teams alter site-level protocols to avoid reporting localized processing bottlenecks to central monitoring teams.
- Metric Gaming emerges when local managers prioritize easily recorded quantitative tasks over essential structural upkeep.
Calculating the true operational gradient relies on comparing output rate against real unit expenditure over time. When local performance drops while resource use remains flat, the resulting negative slope points directly to systemic friction.

Floor
A baseline operational standard establishes the threshold below which performance indicators dissolve into background noise. Distributed operations need a defined baseline to separate normal operating variance from actual operational decay. Without a clear zero-point, headquarters misreads routine site-level fluctuations as structural breakdowns.
Tracking performance vectors below this threshold produces unreliable data. Once an outpost slips below its baseline yield, its metrics lose utility, making it difficult to tell whether the drop stems from broader market conditions or internal failure.

Establishing Noise Thresholds Across Regional Outposts
Field teams routinely conceal localized drag behind aggregate figures during peak demand cycles. Setting an accurate baseline requires separating core throughput from temporary market tailwinds. Regional managers frequently treat short-term revenue spikes as permanent improvements, obscuring fundamental execution problems.
Local measurement loses structural validity when site activity falls below baseline noise floors.
Distinguishing actual signal from regional noise requires continuous comparison against historical activity windows. Assessing performance against a fixed floor isolates local unit capacity from corporate-level swings.
A well-calibrated baseline serves as a neutral diagnostic tool. By removing subjective interpretation from performance reports, leadership spots faltering outposts well before capital reserves are exhausted.

Contour
Spatial and functional variance across autonomous units charts the real topography of operational efficiency. Decentralized organizations run as distributed networks where site conditions shift execution costs daily. Mapping these contours surfaces geographic and functional discrepancies across divisions, explaining why identical playbooks produce contrasting results in different environments.
Analyzing variance contours helps teams avoid rolling out rigid operational standards prematurely. Treating all facilities as uniform working environments simply pushes field personnel to work around formal directives to keep up with daily throughput targets.

How Do Autonomous Units Mask Local Divergence?
Regional operators regularly adjust reporting cadences to smooth visible capacity figures across quarters. Holding back maintenance logs or delaying inventory write-downs creates a temporary impression of stability. By rolling current costs into subsequent reporting cycles, local managers show strong efficiency on paper while quietly accumulating operational debt.
| Structure Variant | Primary Measurement Axis | Signal Distortion Mechanism | Capital Allocation Latency |
|---|---|---|---|
| Fully Autonomous Nodes | Local Transaction Margin | Deferred Administrative Expense | Extended Multi-Quarter Lag |
| Hierarchically Scripted Units | Directive Compliance Rate | Sub-Optimization of Unscripted Tasks | Immediate Operational Friction |
| Federated Operational Gradients | Relative Throughput Vector | Temporary Volume Concentration | Short Calibration Window |
Separating meaningful operational refinements from accounting distortions requires direct evaluation of cross-node variance vectors. When two identical outposts generate divergent yields under identical market conditions, structural drag accounts for the difference.

Translating Local Variance Into Systemic Capital Signals
When high-level aggregates obscure regional divergence, leadership misallocates capital toward struggling facilities. Tracking differences in performance slopes across nodes indicates which site-level modifications produce sustainable operational gains.
Regional variance signals highlight structural advantages before standardized metrics catch up.
Capital allocation sharpens as variance tracking improves. Mapping the functional contours of distributed units gives clear direction for targeted organizational investments.

Drift
Systemic resistance builds along the exact operational seams where administrative friction goes unmonitored. Operational drift is the widening gap between central strategy and actual execution on the ground. When left unmonitored, this divergence drains capital without delivering meaningful progress.
Avoidance serves as a direct indicator of hidden organizational overhead. When site teams regularly bypass official communications or compliance steps, that detour indicates substantial administrative drag.
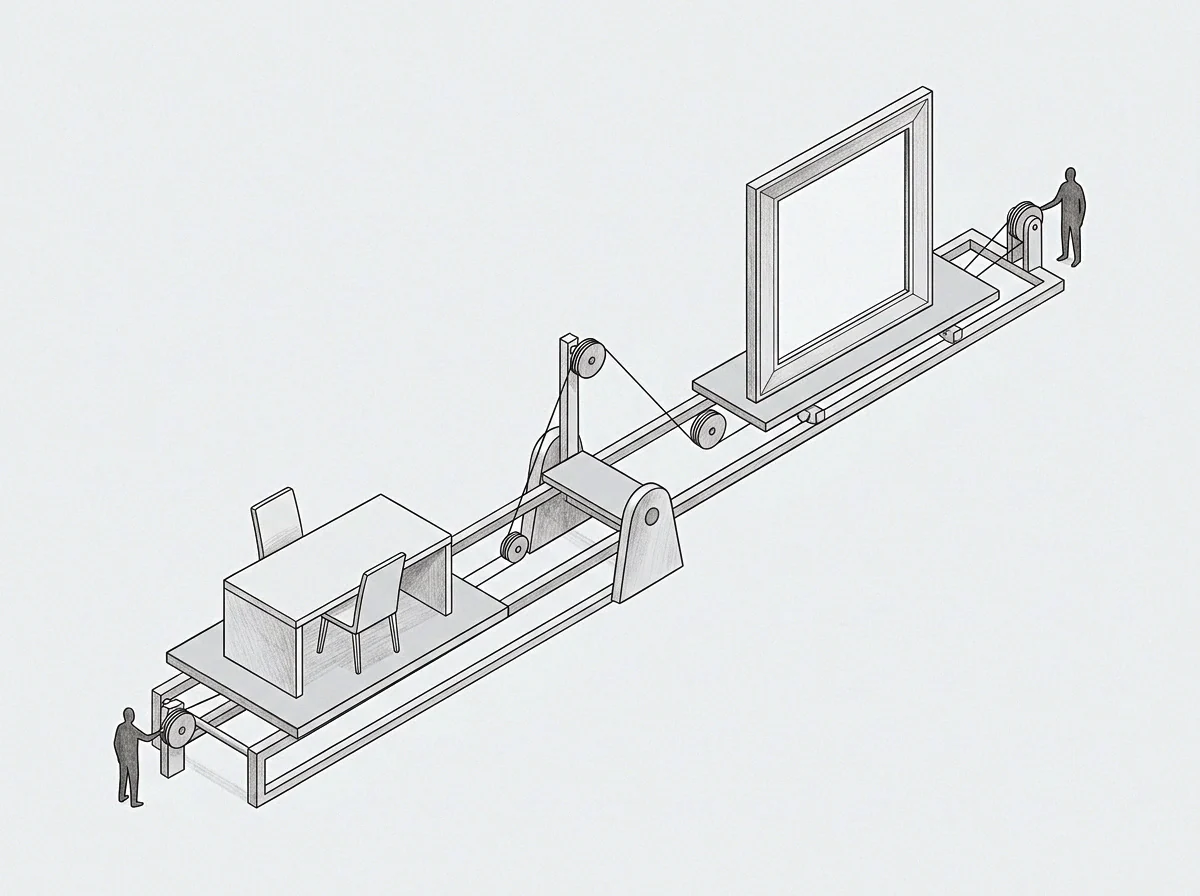
Mapping Latent Resistance Along Inter-Unit Boundaries
Informal workarounds emerge naturally whenever central sign-offs slow down decision-making in the field. Distributed teams build their own informal procedures to keep daily production moving when standard channels introduce heavy delays.
Systemic detours around central protocols signal unmeasured administrative friction.
Operational resistance accumulates through sequential organizational phases:
- Site teams identify administrative bottlenecks in central reporting workflows.
- Local managers establish unapproved informal workarounds to preserve processing speed.
- Central metrics register stabilized output while losing visibility into real site practices.
- Informal procedures harden into permanent operational habits across regional outposts.
- Systemic divergence renders central strategic planning ineffective.
Gauging operational drift involves measuring the gap between theoretical process paths and actual execution on the floor. Following these deviations pinpoints where administrative rules overwhelm unit capacity.

Ascent
Moving toward higher operational efficiency requires directing capital along documented value paths. Working along an operational gradient involves shifting resources to the distributed nodes that demonstrate superior relative throughput efficiency, updating local operating parameters based on real performance vectors.
Rather than enforcing uniform mandates from the top down, a gradient approach lets high-performing nodes establish operational parameters for the wider organization.
Testing Boundaries at Local Model Frontiers
Unit leaders reach hard operational boundaries when volume growth overwhelms established delegation channels. Encountering these thresholds forces local teams to adjust their operating routines or risk failure. Identifying those limits highlights where existing management structures require redesign.
Consider a distributed logistics organization operating thirty regional fulfillment hubs. Under standard central management, all hubs enforce identical inventory sorting protocols. Measuring local value gradients reveals that high-volume urban hubs experience severe throughput drops due to protocol latency, while low-volume rural hubs operate smoothly under identical guidelines.
By permitting urban hub operators to modify local sorting sequences, the enterprise resolves the local operational bottleneck, establishing a higher performance baseline across the entire fulfillment network.
Whether decentralized units can accurately report local structural strain before capacity collapses remains dependent on the independence of site-level monitoring tools.