
Quantifying Internal Interface Drag To Restore Projected Delivery Trajectories
Internal interface drag accumulates when handoffs across team boundaries generate hidden rework and queue latency that degrade projected delivery schedules.
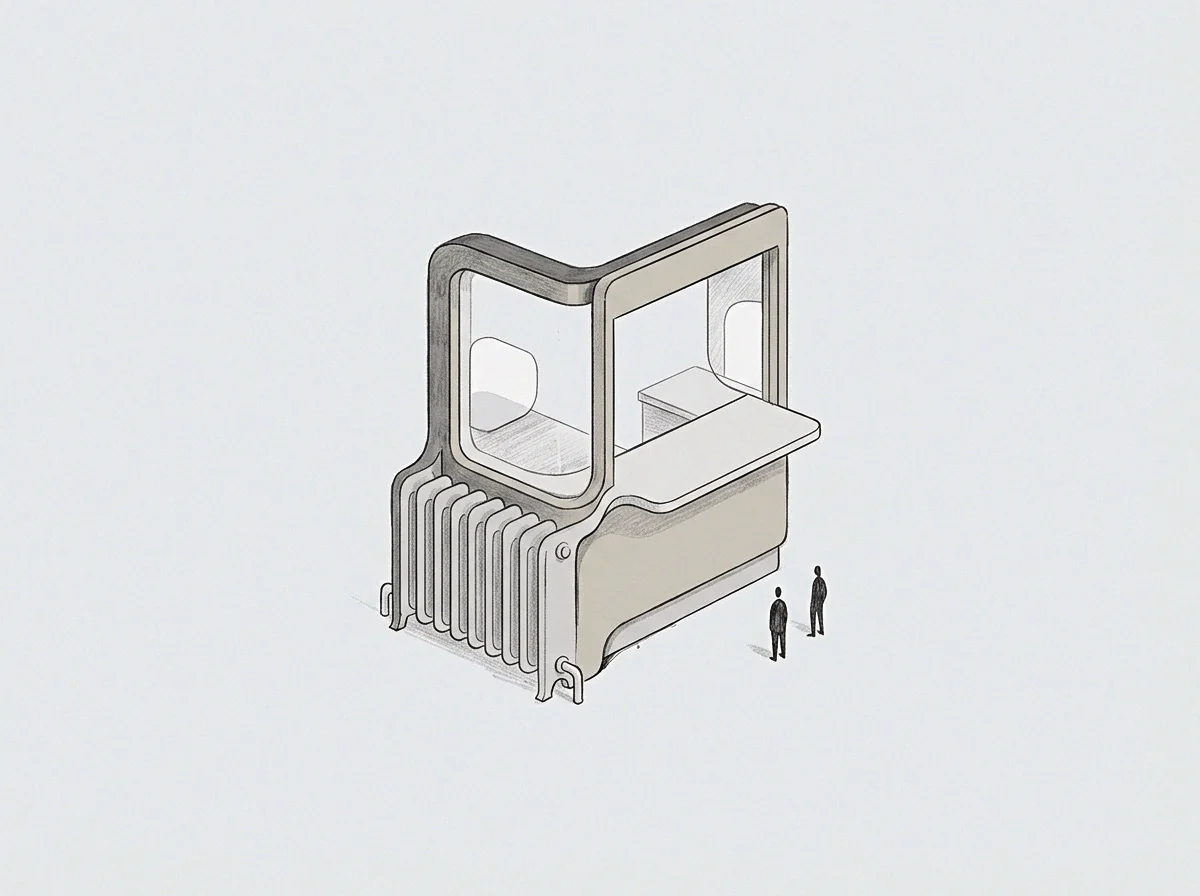
Joint
Engineering organizations frequently observe delivery timelines slipping even when individual teams report completion of assigned tasks. Individual velocity meters indicate active development, yet release dates move steadily into the future. The disconnect stems from unmeasured friction at the intersection points between teams, software services, and operational departments.
When work leaves one domain and enters another, invisible operational drag accumulates in the transfer space.

Structural Latency at Team Handshake Boundaries
When software deliverables pass between separate engineering groups, silent operational friction occurs. The handover of an API specification, a data pipeline schema, or a platform integration module requires mutual context transfer. If the recipient group operates under different priorities or architectural assumptions, the deliverable sits in an unacknowledged queue.
The schedule reflects the accumulation. The delay does not show up as failed code or broken builds; it manifests as static waiting time where output ceases entirely while teams align on requirements.
Interface drag arises from structural mismatches across team boundaries. Latency compounds across structural lines. A software team building a user-facing feature depends on a data team to expose a new database index.
The feature team marks their task ready for integration, but the data team holds the ticket in a sprint backlog scheduled two weeks out. The feature sits dormant, accumulating context decay. By the time the data team completes the index, the feature team has shifted focus to a separate initiative, requiring substantial context recovery before integration can resume.
Interface drag accelerates whenever code handoffs between software teams lack automated contract validation.

The Operational Math of Hidden Handoff Friction
Every transfer of project context introduces dynamic delays that compound across sequential phases. The total latency of a multi-team delivery pipeline equals the sum of individual processing times plus the accumulation of inter-team waiting states. When interface drag is high, the idle time between operational handoffs dwarfs the active engineering effort required to complete the underlying work.
Organizational drag manifests through recurring operational patterns across team seams:
- Specification Asymmetry occurs when the delivering team and recipient team hold conflicting interpretations of functional requirements, forcing mid-flight code revisions.
- Context Switching Decay develops when engineers pause active tasks while waiting for cross-team clarification, burning cognitive capacity to resume development.
- Schema Drift Latency emerges when downstream services break due to unannounced updates in upstream interfaces, triggering emergency debugging sessions.
- Approval Loop Stagnation arises when technical handoffs require multi-layered managerial sign-offs, creating extended queue delays between technical execution phases.
Neglecting interface drag distorts delivery estimates and degrades operational throughput across the entire enterprise. As friction at internal boundaries compounds, engineering teams increase local buffer times, extending project estimates to absorb predictable delays. The resulting delivery baseline settles at a fraction of theoretical capacity, locking the enterprise into sluggish release cycles that erode market responsiveness.

Vector
Measuring internal drag demands treating friction as a directional magnitude rather than a vague organizational complaint. Drag acts as a negative vector aligned against output velocity. When measured across interface points, this vector reveals the specific operational seams absorbing engineering energy.
By calculating drag as a quantitative gradient, technical leaders locate structural bottlenecks without relying on subjective surveys or retrospective opinions.

Quantifying Friction Gradients Across Technical Seams
Engineering velocity decreases along precise operational lines where dependencies intersect. Computing the drag vector requires tracking three distinct values at every internal boundary: handoff waiting time, rework frequency resulting from ambiguous contracts, and coordination overhead measured in non-coding communication hours. The system routes around friction.
Combining these factors yields a quantified interface drag index that isolates problematic team seams.
Empirical studies on software team dynamics indicate that queue delays between task handoffs exhibit non-linear scaling. Task recovery studies demonstrate that context switching introduces an average cognitive penalty of twenty minutes per interruption, a finding derived from structured focus-tracking experiments across enterprise software environments. Should task complexity or team interdependency vary significantly beyond standard software development parameters, this recovery metric shifts upward, requiring calibrated measurement adjustments for highly specialized engineering domains.
| Interface Architecture | Primary Drag Channel | Average Handoff Latency | System Impact |
|---|---|---|---|
| Synchronous Direct Handover | Context Switching Decay | High (24-72 hours) | Blocks active engineering sprints directly |
| Asynchronous Buffer Seam | Schema Drift Latency | Moderate (8-24 hours) | Triggers periodic integration rework cycles |
| Gated Milestone Boundary | Approval Loop Stagnation | Severe (72-168 hours) | Freezes cross-departmental delivery streams |

Separating Execution Capacity From Communication Drag
Individual output metrics often mask systemic delays caused by constant alignment meetings. When two engineering groups spend ten hours per week resolving interface ambiguities, that time represents pure structural drag subtracted directly from development capacity. Coordination overhead eats engineering hours.
Measuring this loss separately from core coding velocity stops management from misattributing project delays to developer performance.
A high review queue latency forces engineering teams into shadow integration paths that corrupt long-term system stability.
The interface drag coefficient remains valid only when measured while team headcount and core architectural dependencies remain constant across consecutive sprint windows.

Queue
Work in progress sitting idle at inter-team inspection gates creates the largest share of schedule variance. When code pull requests, API contracts, or deployment pipelines enter cross-team review queues, visibility drops. Rework consumes the sprint margin.
Code waiting for review degrades in value as the underlying repository moves forward, generating merge conflicts that demand additional engineering work to resolve.
Worked Situation Comparing Two Team Delivery Structures
Assume an engineering enterprise operating four core technical services with forty software developers. The enterprise maintains two distinct cross-team delivery pipelines. Pipeline A uses direct developer handoffs with synchronous review requirements.
Pipeline B routes deliverables through an asynchronous buffer interface governed by explicit open-source style pull request templates and automated contract tests.
In Pipeline A, a pull request crossing team boundaries waits an average of forty-eight hours before receiving an initial review. Changes requested during review take another twenty-four hours to address, followed by a second thirty-six-hour review queue window. Total handoff latency equals one hundred and eight hours.
The actual coding effort spent on the feature is six hours. The interface drag ratio reaches eighteen to one, meaning idle queue time exceeds active labor by an order of magnitude.
In Pipeline B, automated contract testing validates interface compliance within ten minutes of submission. The receiving team reviews the pull request within a guaranteed four-hour window because the automated suite eliminates manual validation work. Total handoff latency drops to five hours, yielding an interface drag ratio of under one to one.
Pipeline B delivers features to production eight days faster than Pipeline A, despite utilizing identical engineering headcount and functional specifications.

How Do Interface Latencies Accumulate Across Handoffs?
Delay occurs in distinct stages as work passes through cross-departmental reviews. The queue grows in silence. Tracking the progression of a deliverable reveals the compound effect of structural friction:
- Work completes locally and enters the cross-team submission queue.
- Context decay begins as the authoring engineer shifts attention to unrelated tasks.
- Reviewers delay inspection due to competing local sprint priorities.
- Review feedback triggers context restoration for the authoring engineer.
- Merge conflicts accumulate as main line branches diverge during idle periods.
The structural friction across team boundaries dictates project completion timing far more than individual engineering speed.
Receiving teams report that incoming deliverables consistently lack the necessary testing documentation to approve changes without extensive manual verification.

Seam
Organizational workarounds highlight exact coordinates where interface friction reaches unacceptable thresholds. When formal handoff channels impose excessive latency, engineering teams build unofficial workarounds to bypass slow boundary reviews. Avoidance acts as a coordinate marker.
The magnitude of the workaround mirrors the exact volume of unprocessed interface drag within the formal structure.

Latent Potential Mirrored Above the Delivery Baseline
Subtracted operational capacity reveals the output volume a software organization generates once structural drag drops. Un spent potential sits directly above the negative drag vector as a mirror image of lost velocity. When a team spends thirty percent of its sprint capacity navigating interface friction, removing that drag releases an equivalent volume of productive throughput without requiring additional engineering hires.
Consider physical freight transport across international borders, where trains pause for hours at gauge changes to manually swap wheel assemblies before continuing down destination tracks. Software organizations replicate this physical bottleneck when transferring data schemas between incompatible team frameworks, spending engineering hours manually translating data structures rather than automating the interface contract. The project slips without warning.
Mapping System Avoidance at Model Boundaries
Engineers alter architectural choices to evade slow review processes between organizational units. If adding a parameter to a core platform service requires a three-week cross-team security review, feature teams implement local database hacks to store data outside the governed platform. The wall of the current organizational model is defined by what the system refuses to compute due to high friction costs.
Mapping these architectural bypasses locates structural interface faults with mathematical precision.
Engineers build internal tooling workarounds long before leadership identifies operational throughput degradation.
Interface drag reaches zero only when inter-team operational boundaries are completely eliminated through micro-organization restructuring or automated contract enforcement.

Trajectory
Restoring planned release dates succeeds when organizations systematically subtract friction points identified along operational boundaries. Interface friction dictates output velocity. Simply pushing engineers to work faster or adding headcount fails to correct delivery schedules, as additional personnel increase the number of internal interfaces and expand overall coordination overhead.
Trajectory recovery requires reducing interface drag before adjusting resource allocations.
Recalibrating Projected Milestones Through Drag Subtraction
Completion dates align with actual throughput once historical queue metrics replace optimistic assumptions. Software delivery trajectories return to predictable paths when platform leaders shorten review loops, automate schema validation, and convert synchronous dependencies into decoupled asynchronous interfaces. Baseline capacity updates automatically as interface drag decreases.
The calculation of projected delivery timelines shifts from speculative estimates to empirical vector subtraction. By taking theoretical team capacity and subtracting measured handoff latency, review queue delay, and context-switching overhead, project planners produce release schedules that survive operational reality. Hidden rework destroys estimated deadlines.
Eliminating ten hours of weekly interface drag restores delivery trajectories faster than adding new development resources.

Establishing Baseline Velocity Window Controls
Monitoring team throughput over trailing four-week intervals exposes sudden operational degradation before release dates fail. The baseline moves downward continuously whenever unmanaged interface drag enters new team dependencies. Every handoff adds latency cycles.
Maintaining steady delivery schedules demands continuous measurement of queue wait times and contract failure rates across every technical seam.
The interface bound sets capacity. Long-term trajectory stability depends on establishing explicit service level agreements for cross-team reviews, automated contract testing suites, and standardized API integration templates. When interface drag is quantified and managed as a core engineering metric, delivery trajectories become predictable, resilient operational vectors.