Meaning
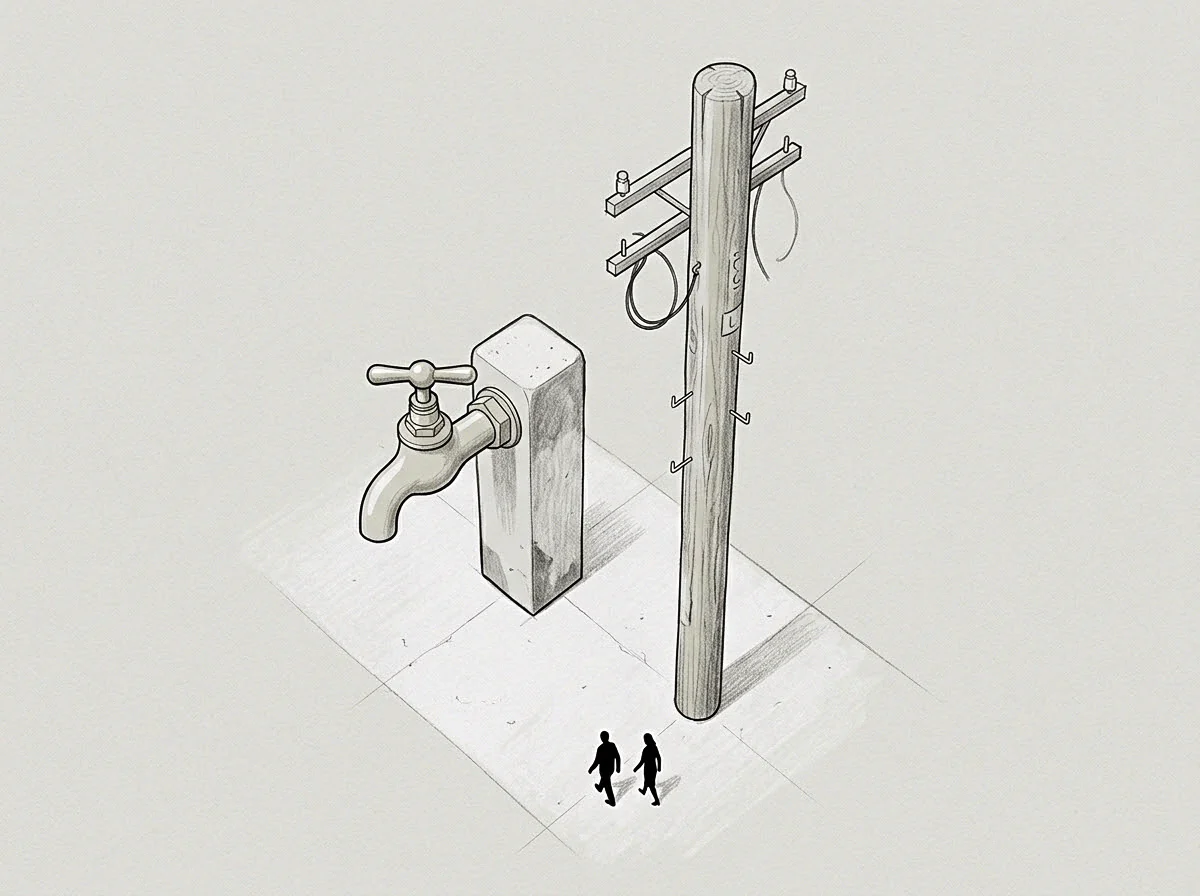
Statistical thresholds identify the response time below which ninety-nine percent of all system requests fall. Monitoring p99 latency reveals the experience of the users who encounter the slowest performance. The measurement excludes the most extreme outliers but captures the tail of the distribution where system bottlenecks become visible.
Tail Performance
Statistical models often focus on the central tendency, yet the extremes provide the most information about system failure. High p99 latency indicates that a small fraction of users experiences substantial delays that the average value hides. These outliers often result from resource contention or garbage collection cycles.
Addressing the tail involves optimizing rare code paths.
Variance Pressure
Irregular workloads create spikes that force a system to its limits for brief periods. Monitoring p99 latency reveals the impact of these spikes on the most sensitive parts of an application. While a median response time might look healthy (an average of fifty milliseconds), the extreme measurement could show delays of several seconds.
This gap forces engineers to choose between expensive over-provisioning and accepting occasional slowness. Success in high-scale environments depends on shrinking this delta until the experience is uniform for all users.
Quality Threshold
Service level agreements typically specify a maximum delay for nearly all requests. The p99 latency acts as the main metric for these contracts. Failure to meet this standard results in a poor reputation for reliability.
Consistency remains the goal for every mature platform.