
Measuring Attention Distribution Across Modern Engineering Teams
Engineering attention distribution measures ordinal cognitive effort across projects through passive telemetry to reveal hidden context switching overhead.

Capacity
Performance evaluations in engineering often treat logged ticket hours as an equivalent for cognitive focus. Time tracking software records duration but ignores the mental effort required across different tasks. Four hours spent resolving a complex algorithmic bug demands far more cognitive capacity than four hours spent clearing routine tickets, making raw hour counts an inaccurate measure of engineering output.
Attention distributes unevenly across different responsibilities. An engineer splits focus between system design, code reviews, incident response, and administrative updates, each drawing on mental capacity at a different rate. Frequent context switching fragments that capacity and leaves less continuous focus for architectural work.
- Task Switching Penalty: Moving between disparate technical codebases forces an engineer to rebuild mental models, consuming energy before productive work begins.
- Reactive Queue Overhead: Monitoring incoming incident tickets and chat notifications creates continuous shallow focus, preventing deep continuous problem-solving.
- Context Reconstruction Latency: Returning to complex algorithmic work after an unscheduled meeting takes up to twenty minutes of re-orientation.
- Unplanned Mentorship Burden: Assisting peer engineers through unstructured queries drains high-value cognitive capacity without leaving a digital trace in project management software.
Relying strictly on time logs hides the true cost of reactive interruptions. The impact of fragmented attention shows up instead in lost context and delayed deliverables. Evaluating capacity requires looking at how engineering focus is structured rather than tallying hours.
Engineering teams shift focus toward reactive channels whenever response latency becomes an explicit performance metric.

Cognitive Allocation Against Logged Hours
Time tracking tools capture surface activity rather than depth of focus. An hour spent diagnosing a broken deployment pipeline extracts a different toll than an hour writing API documentation. Because engineering output is bounded by cognitive energy rather than available hours in a week, pushing beyond those mental limits causes defect rates to rise.
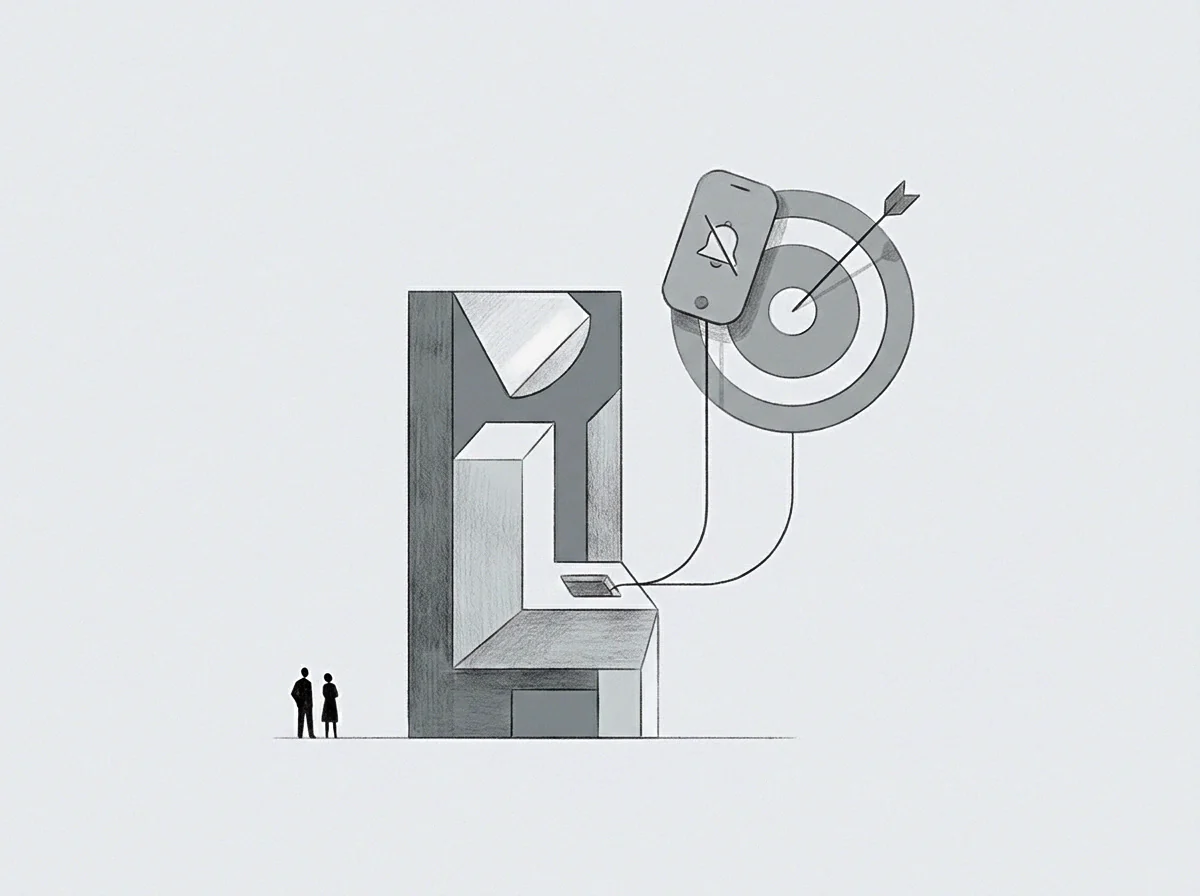
Task Switching Vectors
Working across several projects in a single day multiplies context switching overhead. Shifting between codebases forces an engineer to discard one mental model and load another into working memory. This overhead compounds over the day, draining energy needed for core implementation and lowering overall capacity regardless of total hours logged.
Focus applied to complex architecture breaks down quickly when interrupted by active messaging queues.

Clock
Raw duration does not reflect the focus required to work on complex systems. An uninterrupted three-hour block produces far more substantial engineering progress than six fragmented half-hour segments, which tend to confine work to superficial adjustments and routine maintenance.
Interrupt frequency largely determines the structure of an engineering workday. Unscheduled notifications, chat messages, and ad-hoc status checks break up continuous focus blocks, showing whether a team is operating reactively or proactively.
- Interruptions arrive via automated monitoring alerts or direct messaging during deep analytical work cycles.
- Mental context collapses as the engineer switches focus to assess the incoming issue.
- Resolution of the secondary task consumes immediate operational memory and immediate working hours.
- Reconstruction of the primary codebase architecture occurs slowly after the secondary issue resolves.
- Overall engineering capacity declines across the remaining working window.
Unscheduled calls and small incoming requests steadily break up long focus blocks. These interruptions compound across the week, leaving engineers mentally depleted even when completed ticket counts remain low. Tracking when interruptions occur explains why project delivery dates slip.
Unscheduled interruptions produce context recovery delays that scale with task complexity.
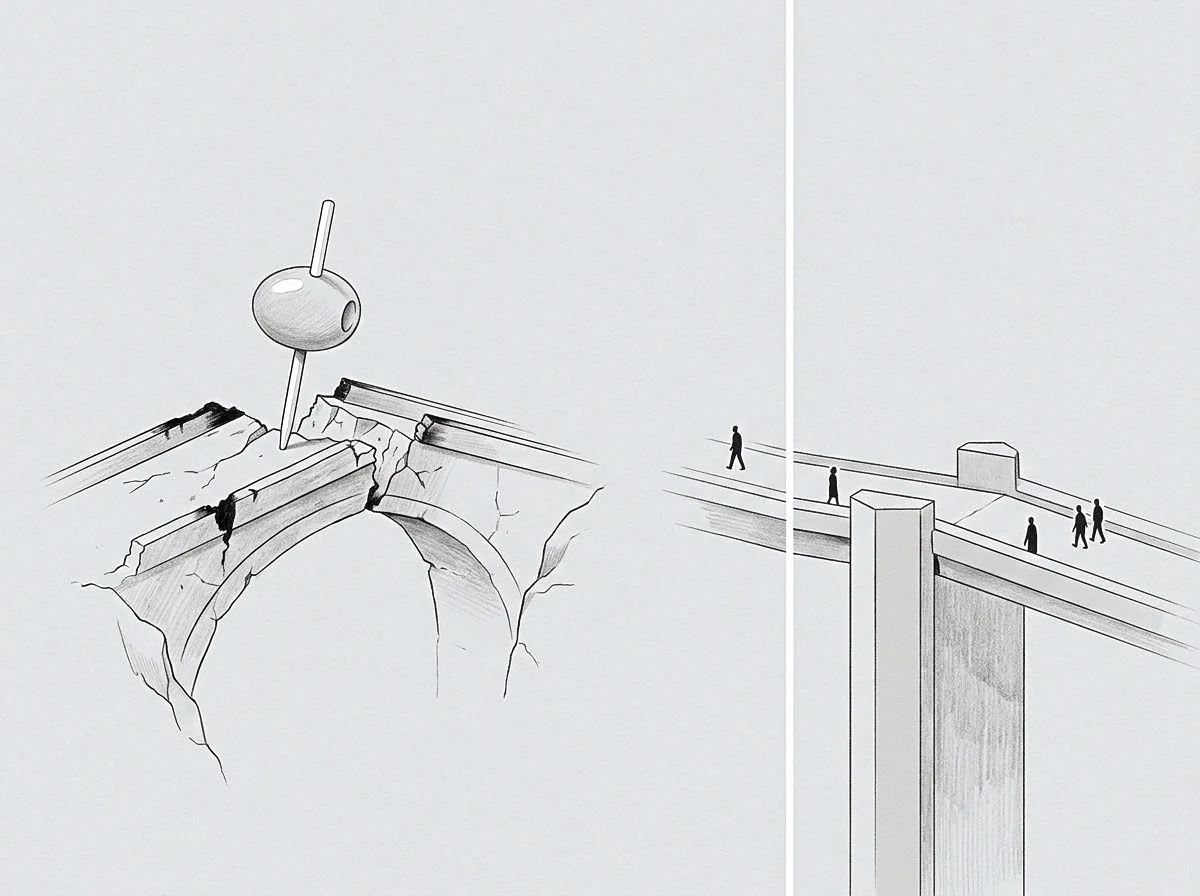
Temporal Fragmentation and Interrupt Frequency
Unscheduled notifications break long blocks of time into short, unusable segments. When focus breaks, reconstructing state inside working memory takes significant effort. Teams dealing with high fragmentation experience lower code quality and accumulate technical debt, making interrupt frequency a reliable early indicator of missed milestones.

Unscheduled Context Shift Magnitudes
Shifting abruptly from complex algorithmic design to incident triage carries heavy cognitive overhead. The cost of a context shift corresponds to the distance between the two mental models; moving from database schema optimization to customer support messaging requires completely resetting working context, accelerating mental fatigue across the team.
Untracked context shifts drain engineering capacity and create chronic delays across deployment milestones.
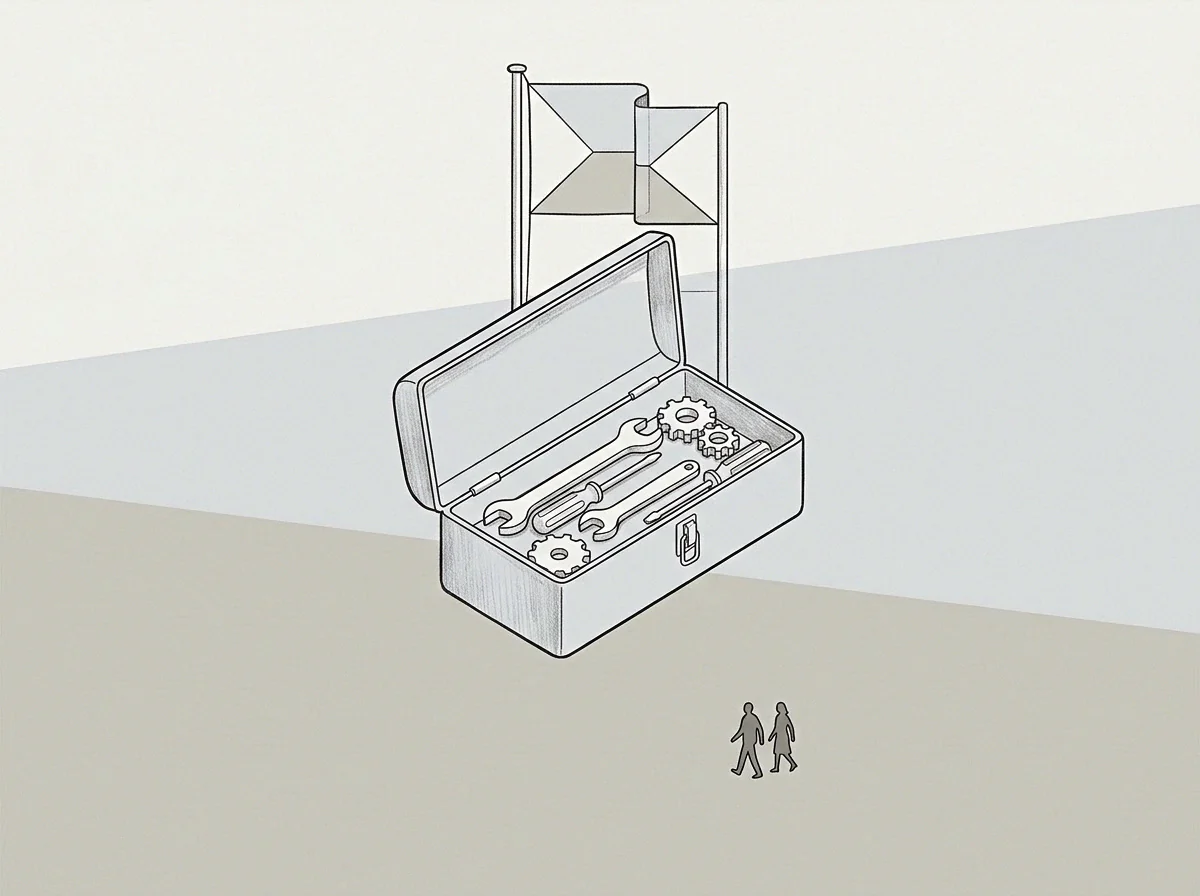
Telemetry
Passive data collection shows how engineering teams actually spend their attention. Software development generates operational records across repository commits, pull request discussions, and issue tracker activity. Analyzing these artifacts provides a clear signal of where focus goes without the recall bias of manual time tracking.
Development artifacts show that code reviews frequently consume more attention than anticipated. Combining repository activity with communication channels gives a clearer picture of how team focus is distributed while eliminating the friction of manual time recording.
Pull request discussions consume more focus than writing the underlying code.

Passive Signals From Development Artifacts
Version control activity reveals how engineering effort shifts across different projects. Metrics like commit frequency, branch lifetime, and diff size reflect daily work patterns. A high concentration of commits on peripheral repositories indicates that focus has drifted from core goals.
Examining this metadata exposes operational bottlenecks without disrupting engineers at work.
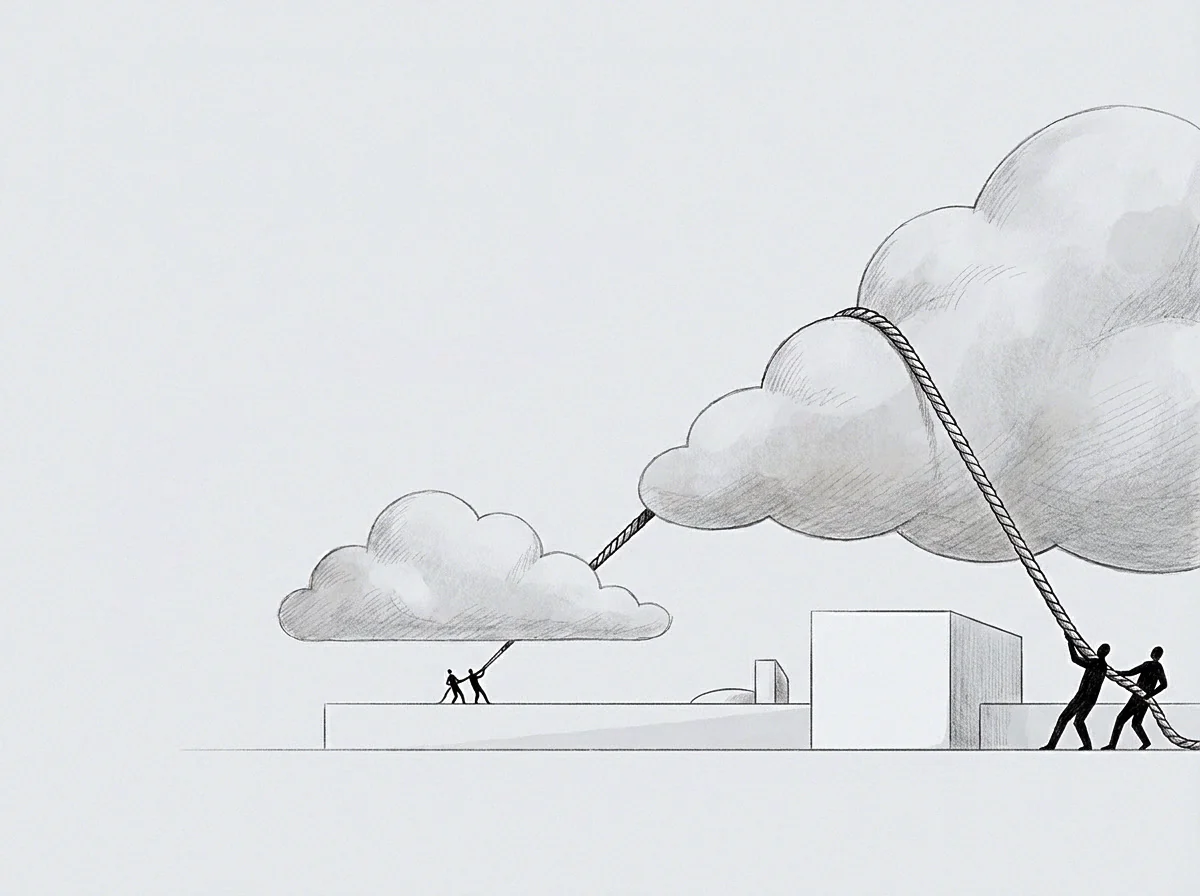
Repository Activity as Ordinal Proxy
Commit timestamps and pull request discussions show where engineering effort concentrates. Tracking the sequence and volume of code updates maps focus across active codebases, highlighting projects that consume disproportionate maintenance effort relative to their strategic value.
The platform team spends half their day answering questions in chat channels that standard documentation was written to resolve.
Margin
Uncertainty in measuring attention comes from the gap between reported hours and actual focus. Differences in developer experience, system complexity, and task clarity introduce noise into telemetry data. Setting error bounds around these metrics prevents leadership from misinterpreting short-term spikes, helping separate ordinary operational variance from structural shifts in focus.
| Telemetry Method | Sampling Friction | Observation Latency | Cognitive Burden | Ordinal Scale Accuracy |
|---|---|---|---|---|
| Direct Observational Sampling | High ongoing disruption | Immediate real-time capture | Imposes high cognitive overhead on participants | High accuracy for immediate task sequences |
| Passive Development Artifact Tracing | Zero ongoing disruption | Asynchronous batch processing | Zero burden on active engineering focus | Moderate fidelity derived from proxy event counts |
| Self-Reported Time Allocation | Moderate manual entry overhead | End-of-day retrospective recording | Creates recall distortion during logging | Low fidelity due to cardinal conversion bias |
High noise in telemetry data reduces its reliability. Without accounting for measurement variance, temporary incident responses can be mistaken for permanent workload changes. Defining margin bounds ensures that staffing and scheduling adjustments respond only to sustained trends in team focus.

Attribute Comparison across Telemetry Modes
Comparing telemetry methods requires weighing data fidelity against disruption. Direct observation captures immediate detail accurately but interrupts daily work. Passive artifact tracing adds no workflow friction but introduces proxy noise, while self-reported logs create administrative overhead and suffer from recall bias.
Choosing an approach requires balancing these operational trade-offs.

Attention Variance and Error Bounds
Activity logs show elevated noise during incident response cycles, where emergency patches create telemetry spikes that do not reflect baseline focus. Filtering out this short-term variance exposes how engineering resources are actually allocated across strategic priorities.
Maintaining a floor of three uninterrupted hours per day protects technical delivery from constant fragmentation.
Ledger
Using focus metrics to guide operational decisions protects engineering capacity from being spread too thin. When project commitments exceed total cognitive capacity, managers must scale back scope or reassign personnel. Designated quiet periods help reserve capacity for complex technical work.
Setting explicit limits on commitments protects engineering throughput and prevents organizational overload. Leaders who track team capacity accurately protect engineers from mental fatigue while sustaining steady deployment velocity.
Explicit focus bounds stated during operational handovers prevent covert attention drift across projects.
Converting Attention Signals into Operational Decisions
Workload mappings help rebalance responsibilities before severe fatigue sets in. If passive telemetry shows senior engineers spending more than forty percent of their time on reactive support, allocations need adjustment to clear those interruptions and restore uninterrupted blocks for core development.
Capacity Allocation Stated at Handover
Explicit agreements around availability prevent unplanned capacity drain. Setting clear boundaries during project handovers defines expectations for ongoing maintenance, and limiting informal cross-project requests keeps attention focused on primary deliverables.
Tracking relative focus across weekly sprint cycles reveals systemic drift before delivery commitments fall behind.