
Designing Variable Observation Windows To Counter Marketing Channel Signal Lag
Variable observation windows match attribution lookback durations to empirical time-to-conversion distributions, preventing premature budget cuts on long-lag marketing channels.
Gauge
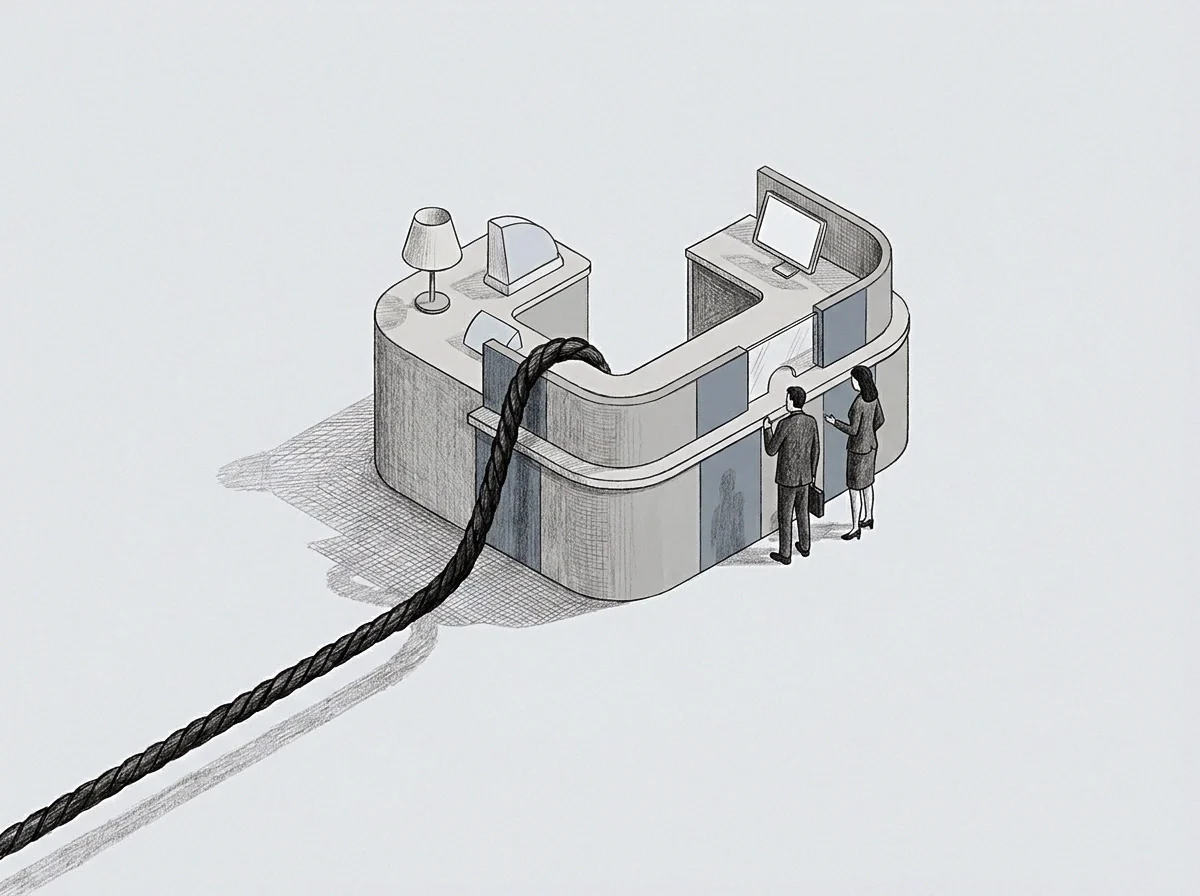
A quarterly performance report logged a seventy-percent drop in return on ad spend for an enterprise acquisition channel evaluated on a standardized seven-day lookback window. Operating on that figure, the financial controller cut channel allocation by half at day thirty. By day ninety, customer cohorts acquired during that low-scoring period completed multi-step sales calls, yielding a three-to-one capital return that the static dashboard failed to record.
The signal arrives late. The baseline shifts.
Signal lag occurs when the duration between advertising exposure and final conversion action exceeds the chosen reporting cadence. Evaluated across uniform lookback windows, channels with extended decision cycles look inefficient compared to direct-response channels with immediate conversion loops. Early metrics truncate tails.
The initial measurement setup determines whether capital reaches effective long-tail acquisition channels or concentrates in immediate, lower-margin customer touchpoints.
Fixed lookback schedules evaluate every acquisition channel under identical time boundaries. A seven-day window records immediate direct clicks while dropping downstream conversions initiated by display impressions, broad search, or content sponsorship. The window closes prematurely.
When attribution routines terminate before customer journeys resolve, the analytical dashboard generates systematic false negatives for long-horizon marketing efforts.
Capital flees early. The misattribution forces operators into a self-reinforcing cycle where funding concentrates exclusively in short-cycle media. The cutoff destroys context.
Designing variable observation windows aligns analytical reporting schedules with empirical conversion timelines, ensuring every channel is measured over its full operational half-life.
Premature capital reallocation to short-lag channels starves high-value acquisition pipelines before their returns register on the ledger.

Latency
Attribution signals decay at different rates across different media formats. A consumer clicking a search ad for a standardized commodity product converts within minutes, creating a sharp, low-variance latency distribution. A business software buyer reading an industry report takes ninety days to clear procurement, producing a long-tailed, high-variance signal distribution.
Conversions accumulate slowly.
Channel Signal Delay Distributions
Every acquisition channel exhibits a distinct time-to-conversion profile determined by purchase friction, price point, and buyer decision velocity. The delay distorts spend allocation.
- Log-Normal Conversion Lag characterizes high-consideration acquisition paths where touchpoints create intent signals that convert over several weeks or months.
- Impulse Attenuation Pattern marks direct-response channels where conversion density peaks within forty-eight hours of exposure and drops near zero thereafter.
- Multi-Touch Decoupling occurs when top-of-funnel interactions spark intent that ultimately registers as brand search or direct traffic ninety days later.

Observation Truncation Hazards
Evaluating long-lag media under short-horizon windows introduces truncation bias. The static ledger lies. When an operator measures an enterprise channel using a seven-day window, eighty percent of generated revenue is assigned to organic direct traffic or later re-targeting touches.
The feedback loop breaks. The channel appears dead.
The channel generates zero revenue because the dashboard recorded no attributed sales inside the default weekly reporting window.
Span
Variable observation windows replace arbitrary reporting cutoffs with dynamic lookback durations scaled to channel-specific conversion velocity. Rather than forcing all marketing metrics into an identical seven-day or thirty-day ledger, variable windows remain open until a defined percentage of cohort conversions resolves.
Scaling an observation period to the ninetieth percentile of empirical time-to-conversion eliminates attribution truncation across high-consideration channels.
Calculating the correct span requires analyzing historical transaction logs to extract the empirical cumulative distribution function of time-to-conversion per channel. The metric truncates tail events. If ninety percent of enterprise software conversions take sixty-five days from initial ad interaction, the designated observation window for that channel is sixty-five days.
Observation requires patience.
Matching the observation duration to channel latency prevents rapid-converting channels from cannibalizing long-cycle acquisition budgets.
Establishing variable windows follows an empirical calibration routine based on historical cohort maturity.
- Record baseline conversion timestamps across all acquisition sources for one hundred eighty consecutive days.
- Calculate the empirical cumulative distribution function of conversion elapsed times per individual channel.
- Assign lookback window parameters at the ninety-percent conversion completion threshold for each acquisition source.
- Schedule spend adjustments and performance reviews only after the variable window for a given cohort fully matures.
Testing static windows against live dynamic windows reveals that fixed windows introduce invariant low performance scores to channels that actually drive top-line revenue over multi-month horizons. Real returns demand time. Signal lag masks efficiency.
An observation window designed around channel speed reveals true capital efficiency where static reporting shows empty ledgers.

Board
Comparing fixed seven-day observation schedules against variable percentile-matched windows across distinct marketing channels demonstrates the mathematical distortion caused by rigid lookback intervals. Evaluating channels side by side highlights how short lookback horizons systematically penalize long-cycle acquisition vectors.
| Acquisition Channel | Mean Conversion Latency | Fixed 7-Day Window Attributed ROAS | Variable 90th Percentile Window Attributed ROAS | Capital Allocation Shift |
|---|---|---|---|---|
| Paid Direct Search | 1.2 days | 3.4x | 3.5x | Negligible change in capital deployment |
| Paid Social Retargeting | 4.8 days | 2.8x | 3.1x | Minor capital increase (+10%) |
| Organic Content Sponsorship | 34.5 days | 0.6x | 2.9x | Major capital increase (+180%) |
| Enterprise Outbound Vector | 68.2 days | 0.2x | 4.1x | Substantial capital reallocation (+350%) |
When an enterprise applies a uniform seven-day board reporting window, out-of-pocket spending on content sponsorships and outbound B2B efforts appears deeply unprofitable. The finance seat views those channels as cash drains. Once the observation window opens to thirty-five days for content and seventy days for outbound enterprise programs, the recorded return on ad spend shifts dramatically upward as delayed cohort conversions enter the ledger.
Enforcing static lookback windows on asymmetric conversion channels causes systematically biased capital allocation toward lower-margin transactions.
Managing capital allocation across mixed-lag acquisition portfolios demands distinct governance rules. Operators running variable observation windows defer channel budget cuts until the channel-specific lookback span has elapsed. Early mid-cycle metric checks serve as liquidity tracking markers rather than budget termination triggers.
A contractually locked fourteen-day attribution clause forces spend evaluation into early signal noise, masking downstream pipeline value.

Margin
Dynamic observation windows shift financial governance from short-term transaction counting to complete cohort return accounting. Operating with dynamic lookback spans prevents premature optimization decisions that eliminate slow-building, high-margin revenue channels.
Capital follows the visible signal rather than the complete transaction vector when reporting schedules precede conversion maturity.
Designing variable windows involves balancing attribution precision against reporting delay. A ninety-day window captures complete conversion tails but slows operational feedback loops, delaying budget adjustments to underperforming campaigns. A seven-day window delivers fast feedback but discards true cohort value.
Operators navigate this tradeoff by combining short-horizon proxy indicators with long-horizon conversion windows.
Financial risk increases when budget allocations shift based on incomplete observation data. When marketing teams optimize exclusively to fast-converting direct touchpoints, acquisition volume shifts toward low-margin, price-sensitive consumers. Long-lag enterprise buyers are ignored because their observation windows never close before campaign budgets reset.
Whether dynamic observation windows can maintain executive confidence while delaying performance accounting across multi-quarter B2B conversion lags remains untested under tight liquidity constraints.