
Separating Measurement Noise From True Operational Progress
Operational progress registers only when an observed performance delta exceeds the historical variance envelope of an undisturbed system over multiple cycles.

Window
A billing dashboard shows eleven conversions on Monday, four on Tuesday, and twenty-two on Wednesday. The team spends Thursday morning running a postmortem on email subject lines to explain the mid-week surge. By Friday evening, the rolling seven-day total rests within four units of the previous six-week median.
The operational baseline never shifted. The team consumed thirty collective hours assigning structural explanations to sampling noise across too short an observation window.
Watching metrics at high frequency creates phantom causation. When an observation window shrinks relative to the underlying task’s cycle time, random noise expands over genuine movement. Every blip invites a story.
Someone tracking daily figures ends up reacting to gauge volatility rather than actual momentum. Discerning true operational shifts requires tracking at least three full transaction cycles before taking any change seriously.
A reading taken before three full operating cycles elapse reflects the calendar rather than systemic capacity.
Short evaluation spans compress random arrivals into fake clusters. A customer renewal delayed by seventy-two hours looks like an operational crisis inside a five-day window, but registers as routine timing jitter across a ninety-day interval. Lengthening the evaluation window smooths out transient spikes.
Checking output once a month reveals the real trajectory of production; checking it hourly tracks thermal noise in the wiring.

Aperture Width and Signal Integrity
The chosen observation window defines what the measurement system can catch. When the timeframe matches the natural tempo of the workflow, systemic changes stand out against ambient noise. Setting the window too tight forces teams into reactive tweaks, adjusting controls in response to brief turbulence rather than persistent trends.
Lengthening the observation span dampens artificial urgency while preserving the shape of persistent drift.
Baseline
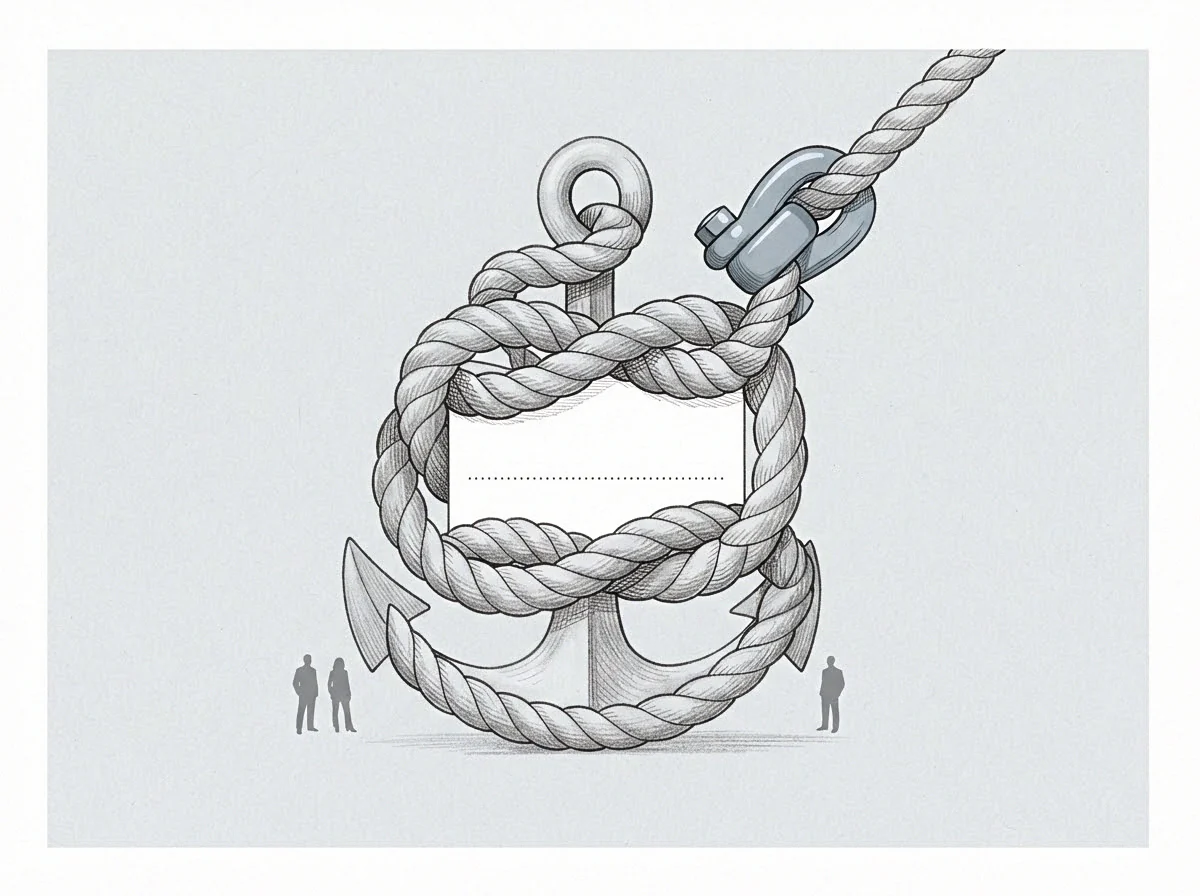
Evaluating an operational change requires establishing how the system behaved before anyone intervened. Without a clear record of ambient drift, seasonal swings, and historical variance, any subsequent lift gets claimed by whoever launched the latest initiative. The unrecorded background quietly swallows credit or blame.
Consider an enterprise team introducing an automated ticket routing interface across fifty support desks. The team records an initial ticket resolution tempo of forty-two minutes per inquiry over twelve weeks, with a weekly standard deviation of seven minutes driven by shifting customer volume. Following the release of the automated system, the average resolution tempo drops to thirty-six minutes across the first post-deployment week.
The initiative lead claims a six-minute acceleration.
Historical baseline data shows that a seven-minute swing occurs naturally once every six weeks without software changes. Because the observed drop sits inside normal variance, no real operational shift has been proven. The difference reflects ambient noise rather than engineered efficiency.
Only when the post-intervention mean stays below thirty-five minutes across four consecutive settlement periods does performance demonstrate genuine structural gain.
An operational shift establishes authenticity only when its magnitude exceeds the established variance envelope of the undisturbed record.
The table below details how performance claims separate along methodological thresholds when evaluated against historical reference data.
| Measurement Vector | Observed Delta | Historical Baseline Band | Classification Status |
|---|---|---|---|
| Weekly Support Ticket Throughput | Plus eight percent over seven days | Plus or minus twelve percent over rolling quarter | Unfiltered ambient noise |
| Customer Inbound Lead Qualification | Plus fourteen percent over sixty days | Plus or minus four percent across rolling half | Confirmed structural shift |
| Engineering Deployment Frequency | Plus twenty-two percent across one sprint | Plus or minus twenty-five percent over six sprints | Transient process spike |
| Server Fleet Resource Utilization | Minus nine percent across three billing cycles | Plus or minus two percent across calendar year | Verified operational gain |
Reference Class Discipline
Operational claims frequently falter because observers lack an external reference class. An isolated team treats internal movements as unique achievements, ignoring how identical systems behave in adjacent domains. If comparable units routinely experience twenty percent fluctuations due to supplier calendar variations, an internal gain of fifteen percent is standard background noise.
Research on forecast calibration demonstrates that people consistently assign too much weight to recent internal efforts while discounting background statistical distributions. When teams establish reference classes across dozens of historical initiatives, the threshold for declaring real progress rises. Failing to pin down this baseline leads to funding initiatives that simply ride the crest of ambient statistical waves.
Room
Physical environments ground operational claims when abstract scorecards fail. In a distribution warehouse, paper printouts pile up on steel benches, pallets sit on taped concrete markers, and workers log departures on clipboards. Operational reality lives in the physical constraints of machinery, worker fatigue, and floor space.

Where Does Real Output Separate From Fluctuation?
Software dashboards often show smooth velocity lines while the floor sits gridlocked with backlogged crates. When digital metrics suggest a twenty percent increase in sorting efficiency, looking at the shipping dock reveals the actual bottleneck. If loading doors remain blocked by staging pallets, transit capacity has not expanded.
The digital gauge logged a local speedup, while facility output stayed capped by transport schedules.
Paper records reveal operational friction directly. Smudge marks, crossed-out figures, and delayed entries on tracking sheets expose systemic friction that automated reporting layers smooth over. Digital dashboards hide local strain by averaging metrics across shifts, whereas the physical staging area shows the pileups directly.
The software logs the shift as completed early, yet three trucks still wait outside the gates.
Screen
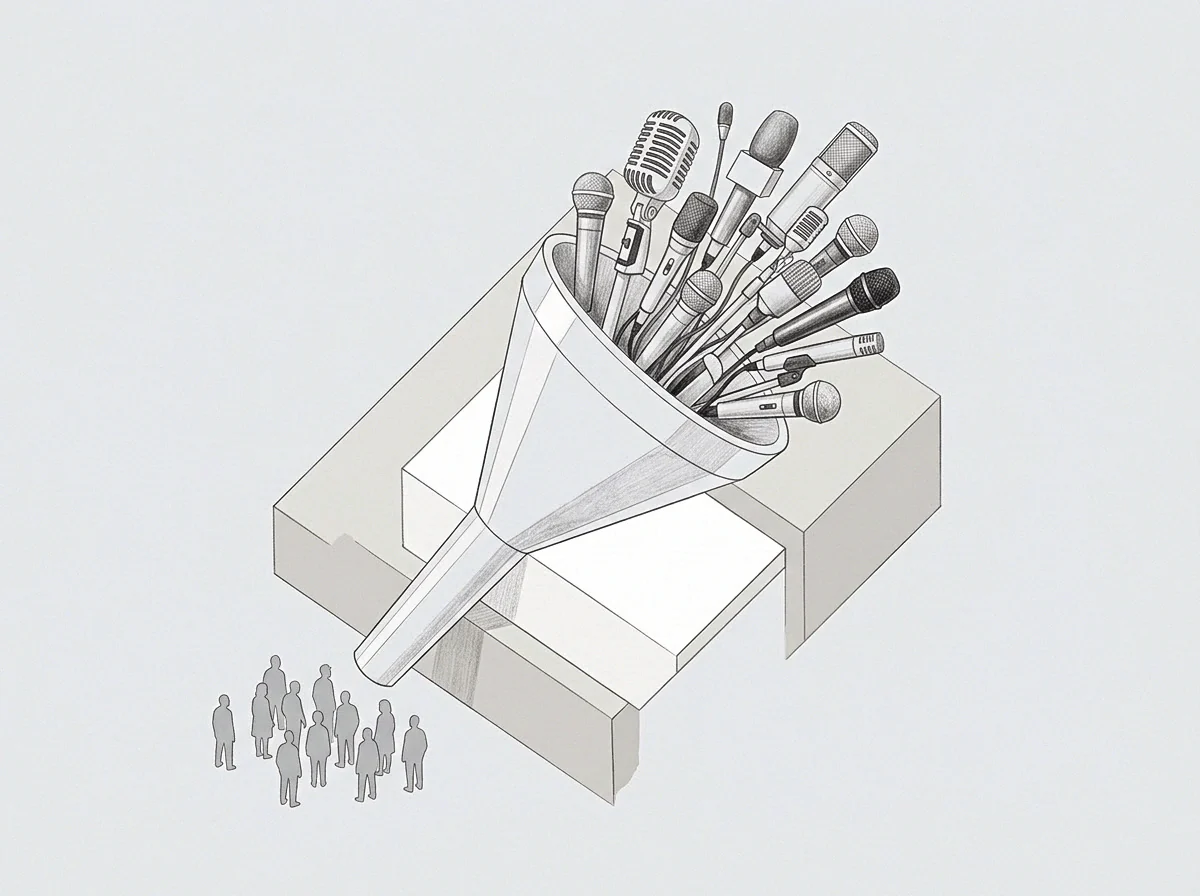
Separating real operational gains from statistical noise requires systematic screening protocols. When a performance boost surfaces, applying strict operational filters strips away false correlations before capital follows bad signals.
The evaluation sequence below separates true process changes from transient statistical noise:
- Invariance verification ensures observed gains persist when market factors, seasonal peaks, and promotional tailwinds return to baseline levels.
- Counter-metric auditing identifies hidden friction in adjacent workflows, confirming that local speedups did not merely push delays downstream.
- Intervention removal testing tracks whether output falls back to the old baseline once executive attention and temporary monitoring resources are withdrawn.
- Input variance probing exposes the operation to varied demand loads to confirm the throughput curve holds under stress.
A declared gain that relies on continuous executive oversight represents temporary behavioral compliance rather than durable system capacity.
Testing for invariance isolates the true causal driver. In many environments, output spikes when leadership pays close attention. Workers adjust their output while being watched, creating an artificial cluster of high performance.
As soon as attention shifts elsewhere, output returns to its historical baseline. The intervention produced short-term compliance rather than genuine system capacity.
Live computation differs from cached performance. A sound system adapts to varying inputs by reallocating capacity on its own. A brittle system simply runs a fixed routine, offering the illusion of smooth performance only while conditions stay within narrow, expected limits.
A persistent verification clause mandates that an operational improvement retain at least eighty percent of its initial margin six months following the complete withdrawal of specialized implementation personnel.
Weight
Tracking noise burns real resources. Every false signal analyzed demands investigative hours, executive deliberation, and strategic recalculation. When an organization treats random variance as meaningful feedback, operational capacity drains into administrative overhead.
Chasing minor statistical ripples creates organizational friction. Teams tweak parameters, reassign staff, and rewrite procedural manuals to fix anomalies that would have disappeared on their own in the next cycle. Constant intervention introduces synthetic instability into balanced systems.
True operational progress is resilient. It survives market shifts, staffing changes, and the withdrawal of specialized tooling, showing up as a structural reduction in the effort required per unit of output. False progress requires constant narrative maintenance just to stay visible on internal reports.
The boundary between structural capability and measurement noise remains blurred whenever ongoing human intervention masks the natural decay rate of an unmonitored system.