
Grounding Value Measurement inside Autonomous Operating Units
Value measurement inside autonomous operating units requires tracking ordinal operational trajectories and system friction rather than relying solely on cardinal financial accounting.

Scale
An autonomous operating unit produces work within a defined perimeter, but its actual contribution rarely shows up in standard cardinal accounting. Conventional corporate reports capture transactional price, logging completed exchanges in fixed currency units. Measurement inside semi-decoupled groups instead follows an ordinal vector, tracing relative trajectory, capacity utilization, and system response speed over time.
Transactional price records past settlement, while ordinal value follows the capacity for future state transitions.
When leadership judges an internal unit purely by localized margin, the team optimizes for immediate profit and sheds operational resilience. Ledger entries summarize completed choices after the fact. Ordinal ranking arrays operational outcomes by practical efficiency, favoring low-friction throughput over high-overhead volume.
The practical distinction lies between logging an account balance and tracking the slope of working capacity.
Cardinal price records completed exchange, whereas ordinal value tracks the capacity of a system to perform future work.
Autonomous teams need baselines tied to internal velocity instead of allocated corporate overhead. Corporate cost apportionments inject accounting noise, masking whether an engineering group sped up its core delivery cycle or simply took on enterprise software seats. Stripping those indirect allocations reveals the direct operational vector.
A team that holds unit expenses steady while cutting throughput latency increases its operational value, regardless of how headquarters adjusts internal billing.
The operating agreement setting up an autonomous unit dictates how its output is read. Tying unit targets to cardinal accounting encourages offloading friction onto neighboring groups, showing paper margin gains that degrade enterprise delivery overall. Grounding the baseline in direct consumption and completion rates yields a cleaner signal.
Evaluating teams by their operational trajectory shifts capital distribution away from retrospective earnings and toward verified processing capacity.

Vector
Baseline metrics establish the ground level, against which operational drift forms a measurable gradient. A value axis plots consumed resources against delivered output across set operational cycles. Left without coordination, an autonomous unit follows a path of least resistance toward local performance plateaus.
Calculating the slope along this operational plane shows whether the unit is taking on structural technical debt or expanding capability.
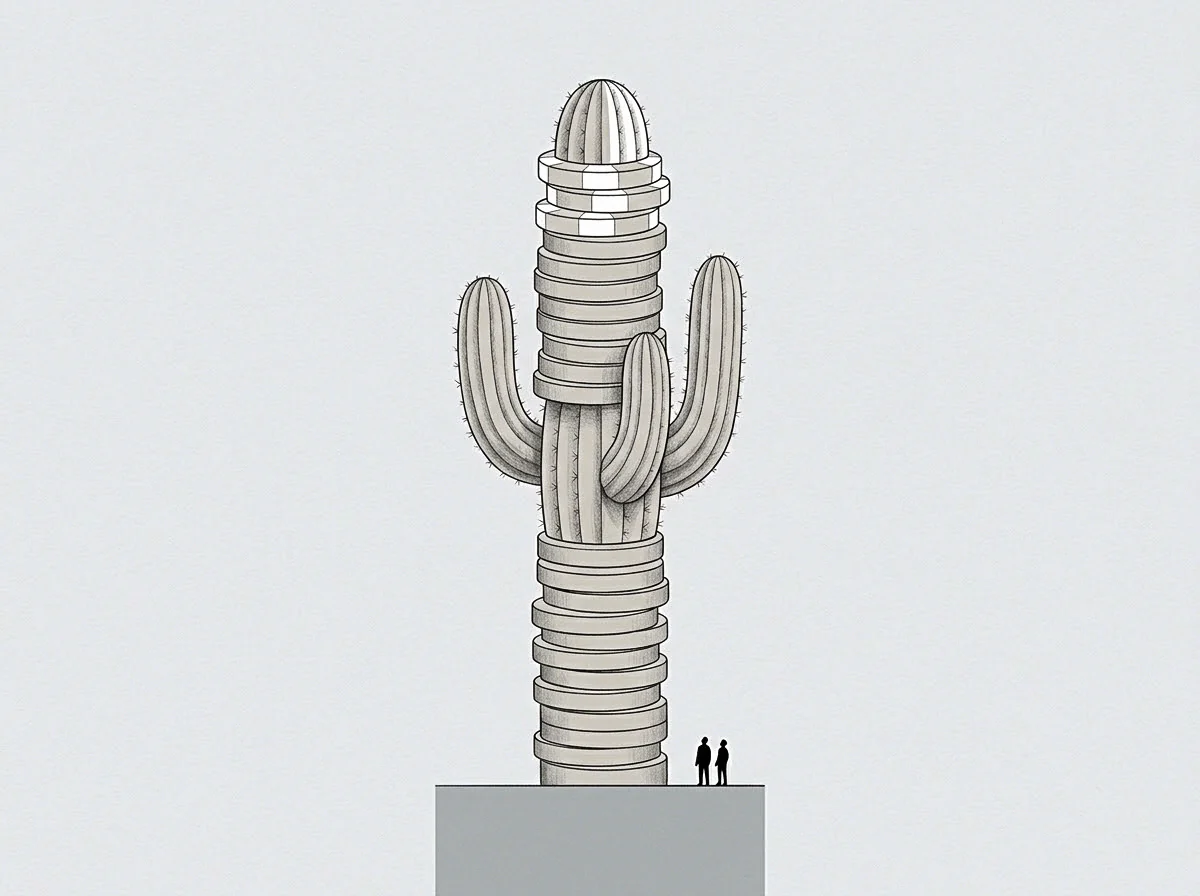
Where Does Unit Value Diverge From Direct Revenue?
Revenue logs commercial extraction at an external transaction point. Operational capability determines how many requests a unit can absorb before service degrades. The calculated ascent gradient tracks the operational energy required to increase output volume under fixed resource limits.
When an autonomous unit clears handoff friction across internal interfaces, its functional value climbs even if top-line revenue stays flat across the measurement window.
Unresolved operational defects create a backlog of deferred maintenance across internal workflows. Inverting that downward slope yields the latent potential, which represents the output volume available once bottlenecks clear. Circumvention patterns highlight structural drag: wherever an operational team repeatedly routes work around a specific task, friction concentrates at that exact coordinate.
- Ordinal Latency Metric ranks execution delays across internal dependencies to identify structural bottlenecks without relying on subjective time tracking.
- Capacity Drift Coefficient calculates the rate at which unit output drops during peak load conditions across sequential operational cycles.
- Resource Absorption Rate measures the exact volume of capital spent to maintain current throughput baseline versus expanding functional capability.
Judging an autonomous unit strictly on raw completion velocity encourages teams to cut corners. Engineers drop test coverage or skip operational runbooks to keep throughput metrics high. Short-term speed rises while system resilience under sustained load falls apart.
A continuous decrease in internal task handoff friction signals expanding unit capability prior to any change in external financial margins.
Ignoring where operational drag sits across a workflow often leads to confusing systemic fatigue with high efficiency. Teams burn down buffer capacity while keeping visible delivery numbers steady, setting up sudden breakdowns when volume climbs past normal levels.

Bench
Consider a structured comparison between two autonomous operating units operating inside an enterprise technology provider. Assume both units maintain ten engineers, operate under identical capital allocations of two million dollars annually, and receive complete autonomy over architectural implementation. Unit A focuses on direct external feature delivery measured by immediate revenue attribution.
Unit B focuses on automated internal platform capabilities measured by deployment velocity, interface stability, and component reuse across adjacent divisions.
Over a twenty-four-month period, Unit A generates immediate commercial sales but accumulates significant technical friction, requiring increasing maintenance expenditure to retain existing software behavior. Unit B shows zero direct external billings in early cycles, yet reduces platform deployment friction across four enterprise divisions. Evaluating both structures strictly through cardinal financial reporting obscures the systemic capacity created by Unit B.
| Evaluation Dimension | Unit A: Cardinal Revenue Model | Unit B: Ordinal Capacity Model |
|---|---|---|
| Primary Measurement Axis | Direct quarterly billings and immediate client bookings | Interface latency, component reuse rate, build stability |
| Resource Allocation Pattern | Directed toward immediate customized feature requests | Invested in platform automation and architectural decoupling |
| Local Optima Trajectory | High initial margin followed by escalating maintenance overhead | Low initial billings followed by systemic processing velocity |
| Operational Drift Marker | Rising support ticket volume and delayed deployment cycles | Stable build times under expanding inter-team requests |
| Calculated Latent Potential | Constrained by manual interventions and brittle code paths | High unspent capacity available for rapid enterprise expansion |
The comparison illustrates how local profit metrics distort structural investment. Unit A appears highly profitable under short-term accounting, yet its internal slope turns negative as maintenance consumes software capacity. Unit B shows zero direct margin on financial ledgers, yet generates an exponential expansion in system throughput across the enterprise platform layer.
System capacity expands when local autonomous units reduce interface friction for surrounding operational groups.
Executive leaders evaluating autonomous units must separate immediate capital extraction from systemic platform enablement. Long-term organizational velocity depends on platform capability rather than isolated quarterly spikes. Measuring the directional vector of platform health provides an accurate forecast of future organizational reach.
Autonomous units operating without shared operational standards inevitably build redundant interfaces that consume capital without expanding capacity.

Boundary
Every autonomous unit operates within a defined model boundary, bounded by the tasks it refuses to process. The physical wall represents the precise point where operational cost exceeds available local capability, causing the system to route tasks back into central administrative channels. Systemic discomfort serves as an instrument, marking active computation and structural friction rather than operational failure.
When an operating unit encounters a complex integration demand, its internal routines either absorb the complexity or generate an error signal. Mapping these error coordinates builds an accurate layout of organizational limits. Business development compiled from operational errors converts recurring failures into explicit coordinates, defining where system capabilities require intentional expansion.
- Identify recurring task handoff failures across unit boundaries during peak operational windows.
- Log the specific resource constraints that forced the autonomous unit to reject the incoming task payload.
- Measure the exact time delay introduced when work re-enters centralized administrative clearinghouses.
- Adjust the unit baseline model to explicitly include or exclude the contested task coordinates.
The administrative center frequently interprets unit task rejection as a failure of local leadership execution. The local team views central task routing as proof that corporate leadership misunderstands floor realities.

Descent
Feedback loops inside autonomous structures fail when teams substitute validation narrative for objective measurement. Validation seeks confirmation of past decisions, obscuring operational friction under polished status summaries. Objective feedback measures the residual error between predicted throughput and actual system performance, driving continuous structural alignment.
Constructing an effective control system requires tracking error coordinates rather than team consensus. When an autonomous unit encounters unexpected system friction, the resulting operational variance provides exact mathematical direction for the next engineering iteration, showing where the operational model reaches capacity limits and isolating the variables that need tuning.
An organization that grounds measurement inside autonomous units accepts short-term variance to preserve precise operational visibility. Tracking ordinal trajectories across real-time execution bounds system risk, protecting core operational capacity from invisible decay.