
Tracking Scalar Operational Noise Against Vector Baseline Movement
Scalar operational noise represents transient localized metric variance, whereas vector baseline movement defines sustained multi-dimensional directional drift across extended observation windows.

Room
A software engineering group spends six weeks resolving ninety-two operational tickets, elevating weekly sprint completion rates by twenty-four percent while customer churn over the corresponding two-quarter window remains static at four point two percent. The daily activity record reflects heavy operational output, yet the fundamental trajectory of product value retention shows no measurable change. Operational environments routinely generate localized metrics that simulate momentum while structural parameters remain immobile.
Distinguishing high-frequency variance from true baseline movement determines whether operational energy alters systemic trajectory or merely burns resources in place.
Scalar operational noise consists of single-dimensional figures measured over narrow timeframes: daily call volume, localized conversion surges, sprint velocity measures, and transient revenue ticks. These metrics capture immediate energy expenditure within isolated components. Vector baseline movement tracks multi-dimensional directional change across extended temporal windows: true unit retention, margin structural shifts under scale, capital efficiency gradients, and organizational throughput capacity.
An operational team tracking scalar spikes often mistakes internal friction for outward progress.
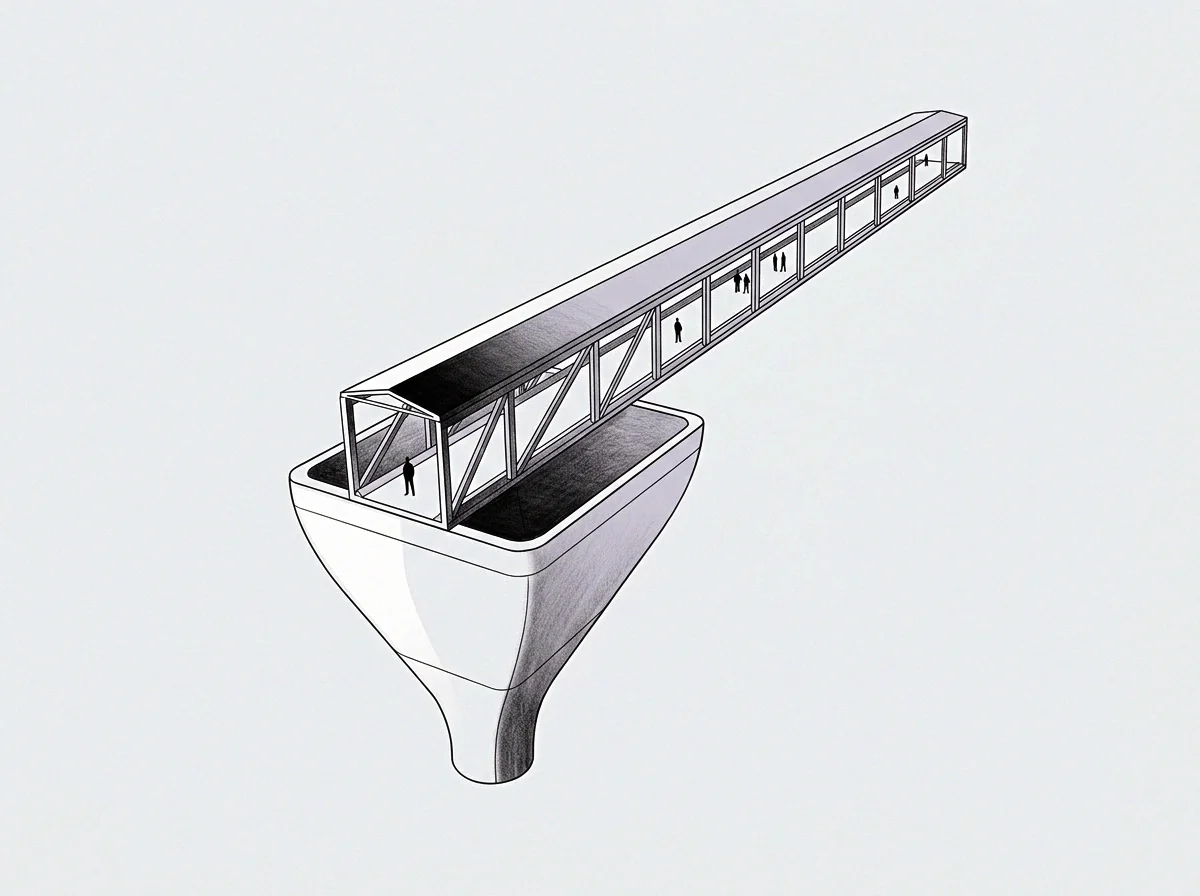
Scalar Fluctuation in Daily Output
Isolating local metrics distorts the view of organizational health. When an operator records daily customer acquisition figures without mapping customer acquisition cost against three-hundred-sixty-day retention curves, single-day sales records mask underlying unit decay. High activity volumes generate immediate metric feedback that relieves cognitive tension regarding organizational viability.
Short-term performance measurement suffers from signal contamination produced by standard operational turbulence. A promotional campaign generates a localized spike in sign-ups, registering on daily dashboards as positive operational movement. If those acquired accounts churn within ninety days, the vector baseline remains flat while operational complexity increases.
Scalar measurement isolates temporary volume; vector measurement evaluates net directional velocity across time.

Directional Trajectory Over Stated Windows
Constructing a vector baseline requires defining structural dimensions alongside temporal measurement windows. A single scalar metric lacks orientation; a directional vector pairs magnitude with systematic trajectory. Evaluating organizational progress demands measuring deltas against fixed baseline coordinates established at a defined starting point.
Tracking vector baseline movement relies on multi-axis monitoring where operational variables are evaluated concurrently. An increase in service delivery speed represents baseline improvement only when customer support costs and delivery defect rates remain stable across a twelve-month observation window. Misinterpreting temporary operational noise as baseline evolution leads directly to capital misallocation and premature expansion into unvalidated markets.

Spike
High-frequency operational metrics oscillate continuously around a mean. Localized spikes in performance figures frequently tempt operators to implement structural adjustments in response to temporary environmental variation. Measuring operational noise requires filtering short-term statistical variance out of longitudinal baseline calculations.
A customer support organization records a thirty percent drop in average ticket resolution time across a seven-day period following a software release. Leadership attributes this shift to improved team efficiency, declaring an operational success. Subsequent analysis reveals that ticket complexity dropped temporarily because critical systems failed entirely, preventing users from submitting detailed technical complaints.
The scalar metric recorded an isolated optimization while the baseline vector of product stability experienced severe negative drift.

Decomposing High Frequency Variance
Decomposing scalar variance involves isolating transient environmental factors from systemic performance improvements. Operational systems experience routine environmental perturbations, including seasonal buying behavior, temporary platform disruptions, and localized marketing campaigns. These events create temporary metric oscillations that return to the structural mean once the stimulus dissipates.
Separating statistical noise from a true baseline shift requires evaluating variance amplitude against historical window boundaries. When an operational metric remains within two standard deviations of its historic baseline over a thirty-day period, the movement constitutes routine operational noise. True vector baseline movement demonstrates sustained directional displacement beyond historical variance boundaries over multiple evaluation periods.
| Measurement Axis | Scalar Operational Metric | Vector Baseline Variable | Noise Threshold Boundary |
|---|---|---|---|
| Resource Allocation | Weekly engineering sprint points completed | Systemic feature deployment latency over 180 days | Variations under fifteen percent per sprint cycle |
| Commercial Efficiency | Daily prospective lead conversion count | Net unit gross margin contribution across 12 months | Short-term marketing campaign conversion spikes |
| Systemic Reliability | Hourly server latency measurements | Unplanned service downtime per quarterly window | Transient regional network routing delays |
| Organizational Capacity | Monthly candidate interview output | Retention rate of technical staff past year one | Fluctuations in quarterly resume intake volume |
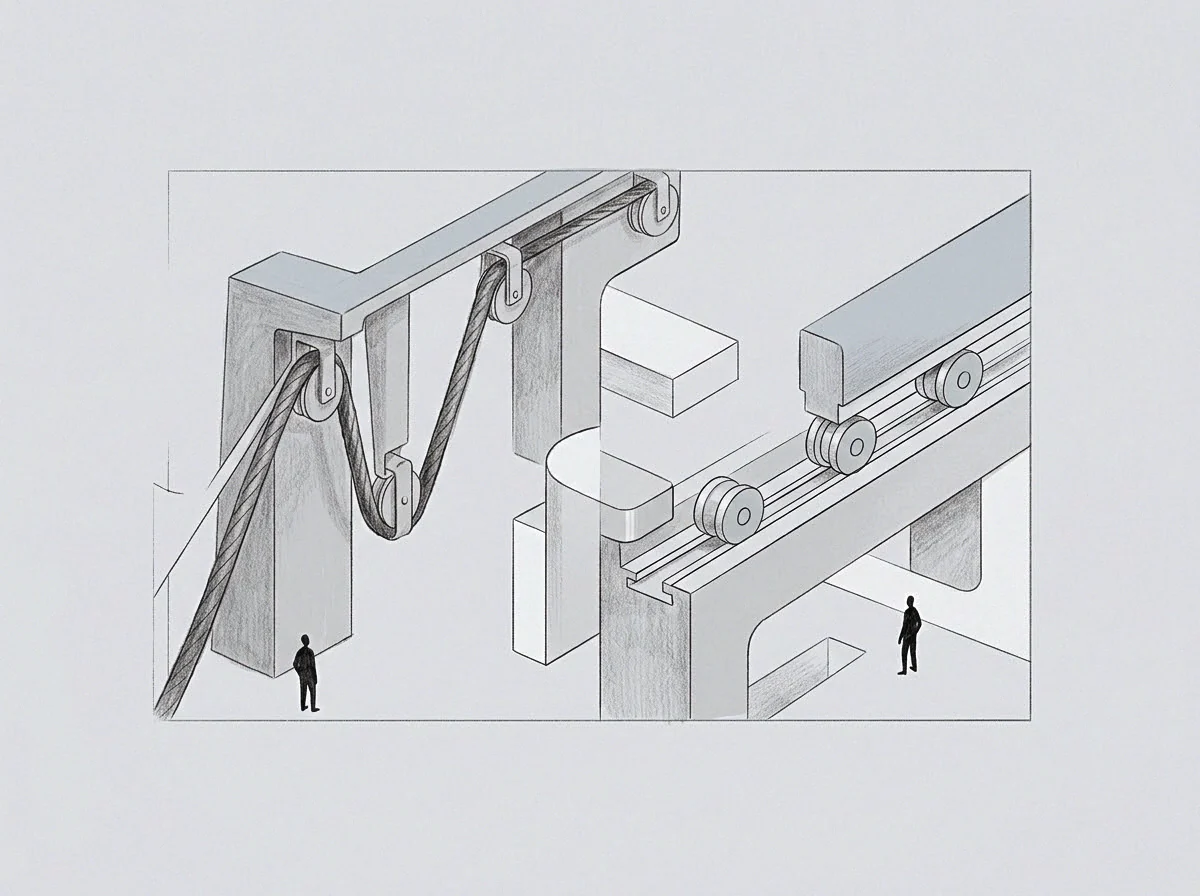
What Separates Local Spikes From Structural Shifts?
Evaluating whether a performance increase represents genuine operational evolution requires testing for temporal invariance and collateral stability. A genuine baseline change displays persistence across multiple environmental conditions and maintains its trajectory after external incentives are removed. Localized spikes collapse immediately once initial operational pressure subsides.
Testing for vector movement involves auditing collateral variables for compensatory deterioration. When a sales team increases monthly revenue by twenty percent while customer onboarding cancellation rates rise by twenty-five percent, systemic baseline movement remains non-existent. True baseline improvement advances primary metrics without inducing destructive degradation in dependent operational dimensions.
A metric reading recorded over a narrow temporal window reflects local operational conditions rather than systemic baseline capacity.
Operators who modify core strategy in response to high-frequency scalar shifts introduce systemic instability into business operations. Repeatedly reallocating capital based on short-term metric noise prevents underlying vectors from stabilizing, creating perpetual organizational churn that masks structural weaknesses.
Baseline vector shifts reflect alterations in system infrastructure, workflow design, or market alignment. These modifications unfold slowly across months rather than days. Operational monitoring systems designed to highlight daily fluctuations obscure these underlying trends by overwhelming analysts with superficial data points.
Operational stability improves when leadership enforces reaction delays for high-frequency variances. Setting structural evaluation intervals prevents impulsive adjustments triggered by transient operational noise, preserving organizational focus on long-term directional movement.

Compass
Navigating structural progress demands precise tracking instruments capable of isolating directional velocity from systemic turbulence. Establishing a multi-dimensional reference class enables an operational team to evaluate baseline delta movements against relevant comparative models rather than subjective expectations.
Constructing a functional measurement apparatus requires logging initial baseline parameters across core performance vectors prior to implementing strategic changes. Without an accurately documented baseline reference point, subsequent performance evaluations devolve into arbitrary interpretations of operational noise. A documented baseline establishes the origin point for every calculated vector delta.
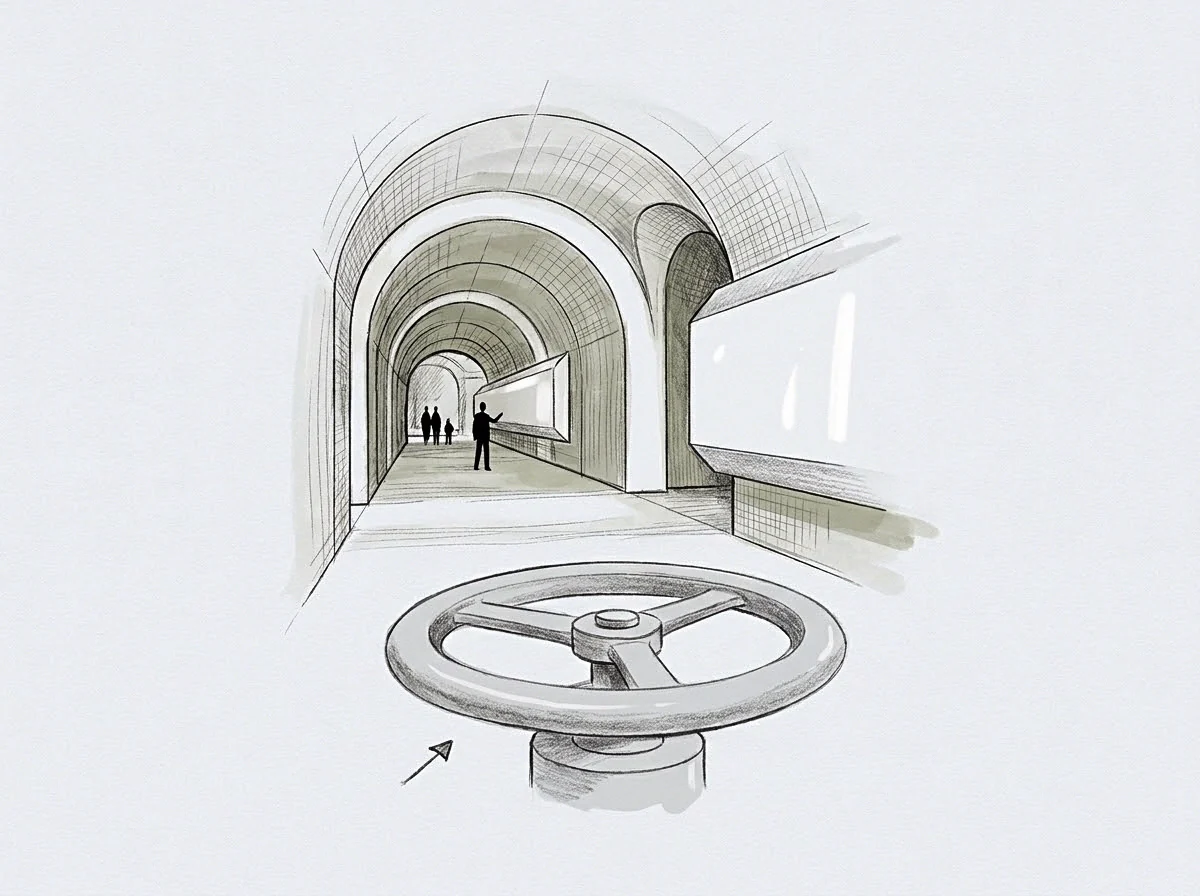
Establishing the Multi-Dimensional Reference Class
A reference class provides the historical context necessary to interpret baseline vector movement accurately. When an enterprise transitions its sales model, evaluating the resulting revenue velocity against isolated past internal performance leads to flawed calibration. Comparing performance against a broad reference class of similar transitions reveals standardized baseline adaptation curves.
Proper calibration prevents operators from panicking during initial transition troughs. Complex operational modifications routinely induce a temporary reduction in performance metrics before long-term vector gains materialize. Understanding reference class trajectories allows teams to distinguish expected transition costs from underlying systemic failure.
- Initial Baseline Coordinate Recording documents core systemic metrics across a minimum ninety-day pre-intervention window to establish historical mean performance levels.
- Dimensional Vector Mapping pairs primary key performance targets with dependent operational stability metrics to detect collateral system degradation.
- Temporal Window Standardisation enforces consistent measurement timeframes across multiple quarters to suppress high-frequency metric noise.
- Cross-Sectional Reference Class Calibration benchmarks observed vector deltas against standardized organizational adaptation curves in comparable environments.

Windowed Deltas Against Epochal Noise
Calculating operational deltas requires pairing exact time windows with specified baseline boundaries. Measuring customer retention over a two-week window yields localized operational noise influenced by temporary support capacity or seasonal factors. Expanding the observation window to a trailing twelve-month view exposes the genuine vector baseline shift.
Window length selection directly influences measurement precision. Excessively short windows amplify high-frequency noise, creating false signals of structural progress or collapse. Conversely, excessively broad windows blur critical operational transition points, delaying necessary interventions.
Matching window scale to underlying process cycle time optimizes directional signal sensitivity.
Systemic baseline displacement demonstrates persistence across varying operational conditions long after initial intervention energy dissipates.
Longitudinal baseline tracking reveals the true capital efficiency of strategic adjustments. When an enterprise spends two million dollars to achieve a three percent permanent vector baseline improvement in operating margin, the operational shift is quantifiable. Comparing this delta against alternative resource deployments validates whether the strategic intervention delivered proportional returns.
Vector calibration requires periodic re-benchmarking of baseline coordinates as organizational scale changes. A baseline established when an enterprise operated at ten million dollars in annual revenue becomes invalid when processing one hundred million dollars in transaction volume. Operational baseline metrics must reflect current systemic scale to maintain diagnostic accuracy.
When an operational team establishes fixed evaluation windows and clear reference classes, strategic decisions rely on empirical baseline movement rather than immediate scalar noise. This structural clarity shields organizational strategy from short-term market turbulence and internal metric manipulation.

Screen
Determining whether management operates on live systemic computation or retrieved cached responses requires structured invariance testing. A cached response uses historical operational models to answer current environmental challenges, producing identical decisions regardless of altered input parameters. Live computation dynamically analyzes real-time baseline vectors to generate adaptive operational moves.
Invariance manifests when executive teams implement standardized strategic playbooks despite significant changes in underlying operational variables. When a team applies the same sales expansion sequence regardless of whether customer retention vectors are rising or decaying, decision-making relies on static cached assumptions rather than dynamic environmental feedback.

The Invariance Diagnostic for Cached Performance
Testing for decision invariance involves introducing controlled variations into operational inputs and measuring response elasticity. If strategic resource allocations remain unchanged when baseline customer acquisition costs double, the organizational governing mechanism operates on cached directives. Live operational systems continuously adjust resource distribution based on incoming vector deltas.
Cached operational answers persist because they conserve executive cognitive energy and provide temporary psychological certainty. Relying on established operational routines eliminates the immediate friction of analyzing complex, dynamic data streams. This shortcut exposes the organization to severe operational risk when environmental conditions diverge from the historical conditions that formed the cached baseline model.
- Examine current strategic resource allocation patterns across departments.
- Identify core operational assumptions underlying present budget distributions.
- Inject altered baseline vector parameters into executive scenario planning models.
- Measure whether decision outputs adapt dynamically or replicate cached historical choices.
- Eliminate invariant operational playbooks that fail to respond to altered input conditions.
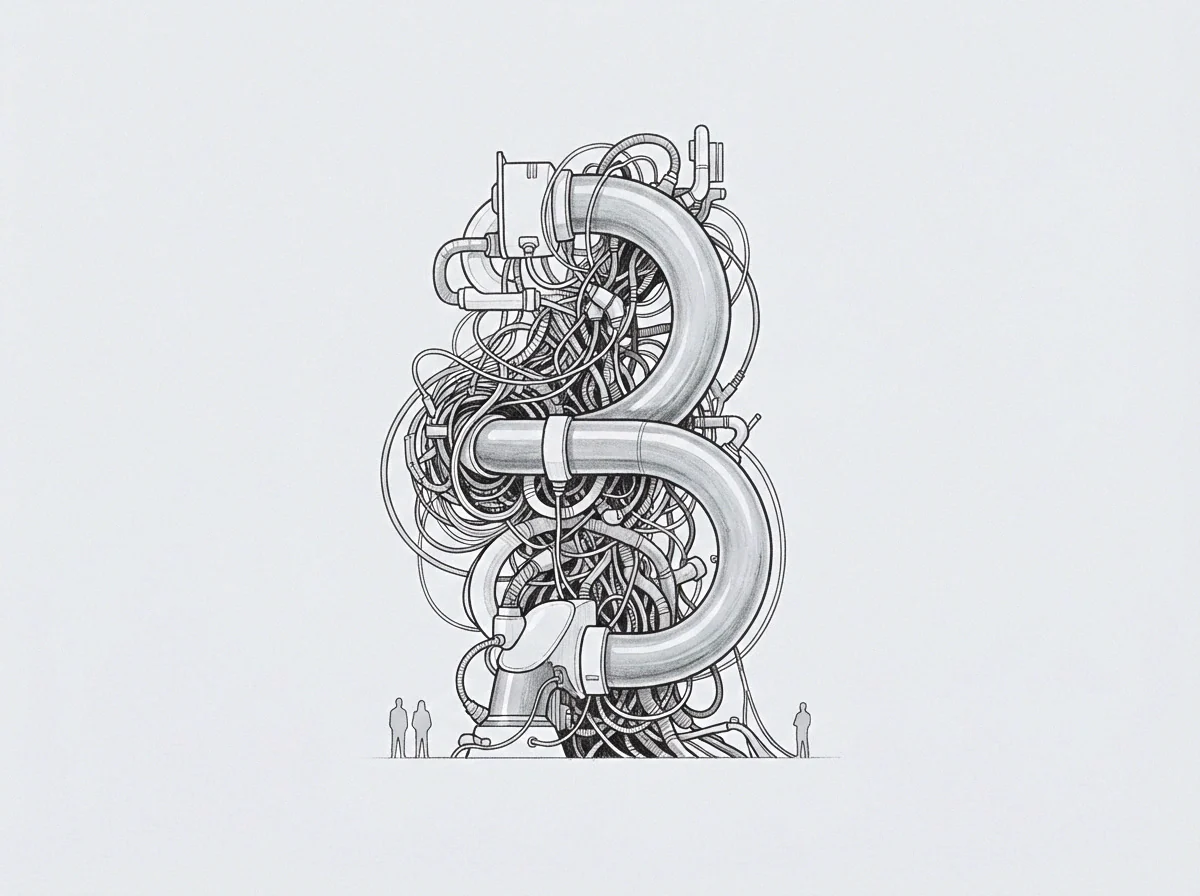
Live Computation Under Dynamic Market Signals
Transitioning from cached operational routines to live systemic computation demands building direct feedback mechanisms between measurement screens and decision execution hubs. Live computation processes current vector baseline movement, evaluating the operational delta continuously to inform resource deployment.
Live computation requires significant organizational energy and demands elevated analytical discipline. Teams must continuously process multi-dimensional data, recalibrate baseline assumptions, and adjust operational velocity based on empirical evidence. This rigorous computation prevents the operational drift that occurs when static playbooks govern dynamic market engagements.
Speed and absolute certainty in operational decision-making frequently signal reliance on cached historical responses rather than live dynamic computation.
Operational diagnostic routines should deliberately test executive consensus for invariant assumptions. When leadership agrees instantly on a complex expansion move without requesting updated vector baseline analysis, the team relies on shared cached preferences. Introducing rigorous invariance testing forces the organization to ground its choices in empirical baseline realities.
A mature operational screen filters out short-term scalar noise while forcing live calculation of long-term vector movement. This balanced processing posture ensures that minor daily fluctuations are ignored while genuine structural shifts trigger immediate, adaptive resource reallocations.
Previous campaign playbooks are often redeployed unchanged because team familiarity guarantees rapid execution regardless of current conversion vector decay.
Cost
Confusing scalar operational noise with vector baseline movement generates substantial operational overhead. Reallocating engineering teams, adjusting commercial pricing, or restructuring client support based on high-frequency metric spikes consumes organizational capacity while yielding zero structural progress. Energy spent responding to metric noise is permanently diverted from structural baseline development.
Frequent operational pivots driven by short-term metric noise induce systemic organizational fatigue. Staff members subjected to continuously shifting priorities cease optimizing for long-term vector improvements, shifting their focus toward gaming short-term scalar metrics to demonstrate immediate activity. This behavioral adaptation degrades overall operational capacity and corrupts metric reliability.

Resource Exhaustion From High Frequency Corrections
Every operational intervention incurs direct financial expenditure, administrative overhead, and opportunity costs. When an executive team alters marketing strategies bi-weekly in response to daily lead fluctuations, the continuous onboarding, campaign redesign, and vendor adjustments consume capital without establishing a stable customer acquisition baseline.
Quantifying the cost of high-frequency corrections requires tracking total capacity expenditure against net baseline movement over annual horizons. When an enterprise spends thirty percent of its operating budget on strategic interventions that yield a net zero vector delta across key performance indicators, the friction cost of metric noise response equals the wasted expenditure.

Structural Drift in Unmonitored Baseline Vectors
Focusing operational attention exclusively on scalar metrics leaves core baseline vectors unmonitored, allowing invisible structural drift to occur. While management celebrates a temporary spike in daily user sign-ups, underlying system reliability, unit gross margins, or key employee retention vectors may experience continuous deterioration.
Detecting structural drift requires maintaining baseline monitoring systems independent of operational optimization initiatives. Uncoupling diagnostic measurement from immediate operational execution ensures that core vectors are evaluated objectively, exposing hidden decay before structural failure occurs.
Does the organization possess the analytical discipline required to leave high-frequency operational noise unaddressed while waiting for long-term vector baselines to reveal their true directional delta?