
Building Unified Trace Pipelines Across Disparate Enterprise Divisional Boundaries
Distributed trace pipelines preserve trace correlation across enterprise divisions by standardizing context propagation and filtering spans at perimeter gateways.

Seam
An engineering unit deploys microservices inside an isolated cloud enclave, routing egress traffic through an HTTP proxy that strips custom metadata. While execution flows cleanly within the division, the trace terminates the moment a request crosses into an adjacent business unit. Upstream services report successful runs while downstream systems log orphaned database calls, leaving telemetry backends unable to stitch the operations together across architectural boundaries.

Egress Gateway Context Truncation
Perimeter proxies serve as security boundaries between divisions, often configured to strip non-standard HTTP headers before packets enter shared transit networks. Distributed tracing depends on headers such as W3C traceparent and tracestate to propagate trace identifiers, parent span IDs, and flags across process boundaries. When an egress gateway drops these headers, the downstream service treats the incoming call as a new trace root, breaking the correlation graph.
Reconnecting cross-divisional execution graphs requires explicit context injection protocols at each network perimeter. The sending service attaches standardized metadata identifiers to egress payloads or headers before network proxies process the traffic, allowing perimeter gateways to parse and forward these carrier fields intact.
Orphaned trace segments occur when boundary gateways strip trace headers without generating replacement carrier context.

Trace Continuity Across Perimeter Walls
Divisions frequently adopt different telemetry platforms. Division A might emit OpenTelemetry spans over gRPC, while Division B runs legacy Zipkin instrumentation that sends JSON over HTTP, introducing protocol translation overhead at the interface between them.
Placing collector nodes at divisional boundaries bridges these protocol differences. The perimeter collector receives spans in local formats, normalizes them into an enterprise intermediate representation, and re-emits standard trace contexts across the network. Dropping execution identifiers at these edges degrades distributed telemetry into disconnected log streams, tripling incident triage duration during multi-region outages.

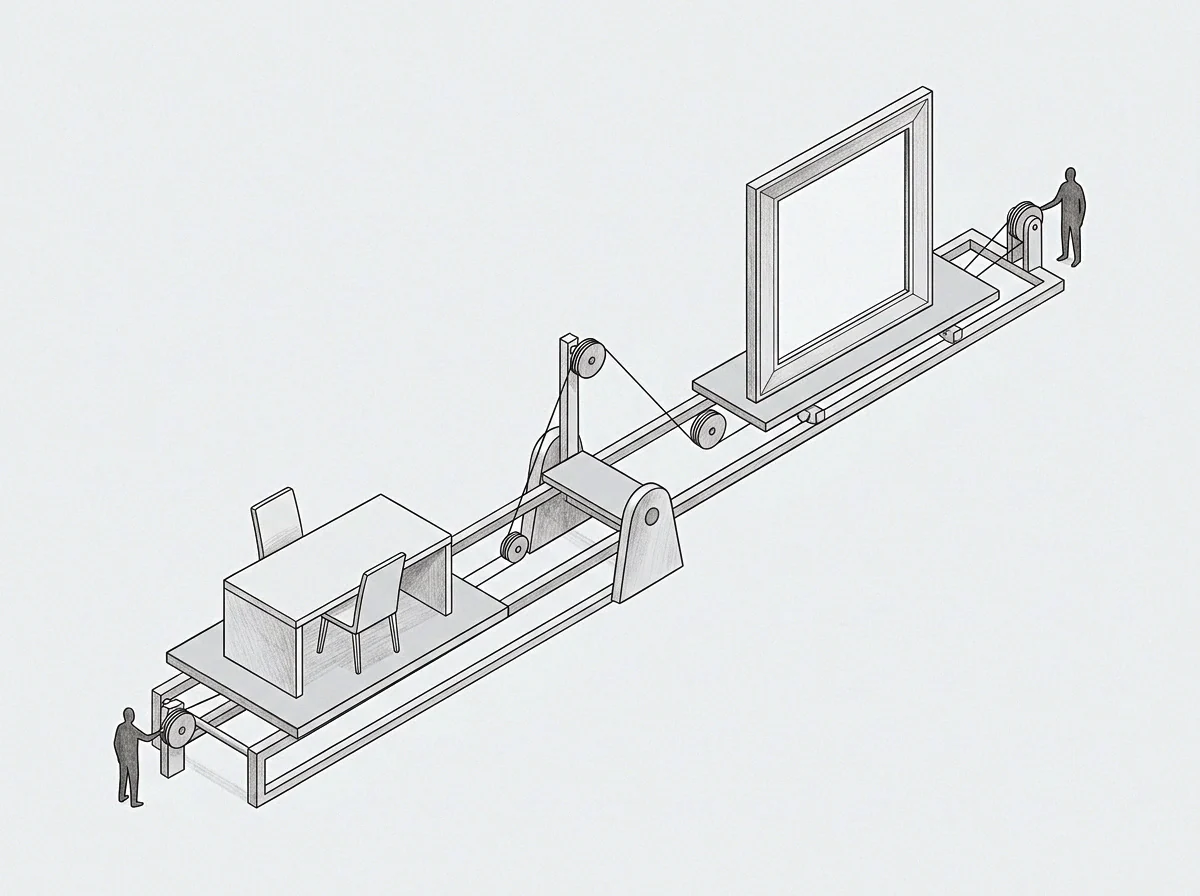
Joint
Connecting autonomous software groups requires normalizing incoming HTTP headers before telemetry processors ingest span records. Inconsistent proxy configurations and security filtering routinely disrupt context propagation across internal network boundaries.
Egress Context Translation Mechanisms
Perimeter translation relies on dedicated context propagation gateways. When a request exits Division A, an egress interceptor reads the active span context from local thread storage, formats it into standard W3C header strings, and injects those headers into the outbound HTTP request. The ingress gateway in Division B then extracts the context, initializes a child span, and binds it to the propagated parent identifier.
Mismatched header key names cause immediate context drops. If Division A emits Zipkin X-B3-TraceId headers while Division B expects OpenTelemetry traceparent, context extraction returns null. Downstream trace initializers then spin up isolated trace trees, preventing end-to-end latency measurement.
A strict trace parent header translation rule prevents upstream baggage overflow from crashing downstream gateway parsers.

Boundary Propagation Failure Modes
Uncoordinated infrastructure configurations introduce systematic failure modes across enterprise network perimeters.
- Header Dropping occurs when perimeter firewalls sanitize non-standard HTTP headers before request routing completes.
- Baggage Saturation occurs when upstream teams append unrestricted key-value pairs that exceed boundary proxy header size limits.
- Format Mismatch arises when legacy divisions emit Zipkin B3 identifiers while target platforms expect OpenTelemetry standard traceparent strings.
- Clock Skew corrupts span alignment across autonomous data centers when network time protocol synchronization deviates by fifty milliseconds.
Mitigating these failures requires explicit header preservation rules at all internal transit firewalls. Applying the W3C tracecontext specification at boundary ingress proxies converts proprietary headers into standard carrier fields.

Siphon
Telemetry setups that rely on direct daemon transmission stall when divisions restrict cross-network traffic. Dedicated collector topologies buffer and process telemetry streams locally before sending aggregated trace data across network perimeters.

Collector Topologies for Distributed Enclaves
Direct span transmission across divisional borders saturates cross-region links and triggers firewall policy violations. Deploying collector daemons inside local enclaves creates an intermediate layer that buffers, filters, and batches trace records before egress.
Local collectors evaluate span metadata before routing data to central enterprise storage. Routine health check spans are filtered immediately, while error spans and high-latency execution paths receive priority queuing for cross-divisional transit.

What Causes Span Disconnection at Boundary Routing Engines?
Inconsistent sampling decisions between upstream callers and downstream ingestion gates degrade trace completeness. Head-based sampling evaluated at the root service drops ninety-nine percent of trace contexts before microservices execute complex cross-divisional database queries.
| Topology Strategy | Boundary Security Model | Transformation Capability | Egress Cost Impact |
|---|---|---|---|
| Dual Gateway Peer | Strict VPC Peering with mTLS | Local span filtering and schema mapping | Moderate cross-region bandwidth charges |
| Central Egress Proxy | Single Ingress Tenant Enclave | Global rate limiting and PII redaction | High telemetry transit cost at primary hub |
| Edge Aggregator Pipeline | Zero Trust Mutual Authentication | Local tail sampling and span aggregation | Low network overhead across divisional boundaries |
Tail-based sampling engines buffer complete traces in memory until all participating microservices finish their execution segments. The collector evaluates the full trace graph to identify errors or latency anomalies across divisional boundaries, retaining diagnostic data while dropping redundant runs.
Tail sampling decisions executed at divisional boundary collectors preserve error traces while dropping routine health checks.
Positioning telemetry sampling collectors ahead of cross-divisional network links prevents bandwidth allocation from being consumed by routine heartbeats.

Schema
Autonomous engineering teams frequently select different naming patterns for database operations, service identifiers, and error classifications. Without unified semantic conventions, querying traces across divisional boundaries produces inconsistent results.

Resolving Attribute Drift Across Autonomous Divisions
When Division A logs database calls using the attribute key db.statement while Division B records the same operations under sql.query, visualization tools fail to aggregate them into coherent execution metrics. Standardizing span attribute definitions resolves this metric fragmentation.
Adopting OpenTelemetry semantic conventions establishes a shared vocabulary across microservices, covering service names, HTTP status codes, RPC method names, and cloud resource identifiers. Automated transformation processors enforce these conventions at divisional pipeline boundaries.
- The egress collector captures raw telemetry spans emitted by divisional microservices.
- Translation rules rewrite non-standard span attributes into OpenTelemetry semantic convention fields.
- Structural validators verify that high-cardinality metadata keys meet enterprise governance policies.
- Processed trace records flow across perimeter proxies into unified storage backends.
Span attributes mapped to standard semantic definitions enable unified distributed querying across independently managed microservices.
Transforming custom divisional keys into standard enterprise fields ensures uniform searchability across disparate telemetry repositories. Enforcing global attribute schemas can, however, introduce friction to local development cycles.

Mask
Regulated business units handling financial or medical workloads cannot export unencrypted payload attributes across cloud tenancy boundaries. Data protection compliance requires strict sanitization before telemetry leaves divisional networks.

Payload Sanitization at Division Boundaries
Trace attributes frequently capture dynamic payload values such as query parameters, email addresses, and authorization tokens. Egress collectors scrub these values using regex pattern matching and field blocklists before data reaches boundary transit proxies.
Redaction pipelines process span attributes without discarding structural context. Replacing credit card numbers with SHA-256 digests preserves cardinality for diagnostic grouping while protecting customer data.

Cryptographic Identifier Mapping
Obfuscating customer identifiers without breaking trace correlation requires deterministic hashing at egress collector pipelines. A shared salt applied at divisional boundaries allows trace query engines to join user sessions across distinct business units without exposing plain-text values.
Stripping high-volume, non-essential attributes reduces span byte weight and lowers transit overhead across inter-region connections. Diagnosing cross-divisional failures without access to raw customer identifiers remains a persistent operational trade-off for downstream teams.

Levy
Centralized observability budgets create misaligned incentives when individual software groups stream unthrottled spans without bearing infrastructure costs. Allocating telemetry expenses directly to originating divisions encourages disciplined sampling and payload hygiene.

Financial Allocation of Ingestion Expenses
Uncontrolled span volume drives up database indexing costs and network egress fees. Central observability teams calculate divisional rates based on total span volume, byte weight, and storage retention windows, converting telemetry consumption into direct operational charges.
Divisions subject to direct chargebacks typically implement tighter local sampling rules and cut redundant attribute logging. Direct visibility into pipeline expenditures aligns telemetry volume with application criticality.

Managing Cardinality Explosion Across Boundaries
High-cardinality tags attached to trace spans inflate backend indexing costs across observability deployments. Unchecked user GUIDs, dynamic timestamp keys, and unique request URLs quickly saturate index memory in storage clusters.
Perimeter collectors enforce tag cardinality limits, automatically truncating or aggregating attributes that exceed unique-value thresholds before cross-divisional egress. Monitoring span metrics at egress proxies keeps infrastructure costs predictable without sacrificing diagnostic fidelity.