
Calculating Unspent Potential Behind Systematic Edge Avoidance of Central Directives
Systematic avoidance of central directives identifies high-friction operational gradients, revealing latent potential when peripheral routing is mirrored above the baseline.

Axis
An operational directive runs unexecuted while teams route daily tasks through alternative channels. Central mandates routinely set high computational friction for the personnel tasked with direct execution. When top-down commands demand energy expenditure above the system’s current capacity, work flows around the impediment along the gradient of least resistance.
Avoidance marks slope. This movement away from central authority is not rebellion or operational failure. It functions as gradient descent across an institutional energy landscape.

Central Directives as High Energy Gradient Slopes
Top-down policies establish structural setpoints for performance, compliance, and reporting. When a setpoint sits too far above operational realities, the energy cost of direct ascent becomes restrictive. Personnel calculate the immediate expenditure of compliance against the lower expenditure of local workarounds.
Work flows downward. The resulting lateral movement shifts execution to informal networks, personal spreadsheets, and local scripts. The central command retains nominal authority while operational velocity transfers entirely to the edge.
When operational mandates exceed the energy threshold of direct execution, systems convert policy friction into perimeter routing.

Coordinate Markers Along the Perimeter
The system edge records every instance of central avoidance. By mapping where directives fail to produce direct action, leadership identifies the precise geographic and structural locations of operational friction. Avoidance acts as a coordinate marker.
The distance between central intention and peripheral execution forms a vector. Measuring this vector reveals the precise cost disparity between what the organization commands and what the system can produce.
Treating peripheral routing as pure insubordination guarantees that institutional energy drains into unreported workaround channels without altering the underlying directive.
Volume
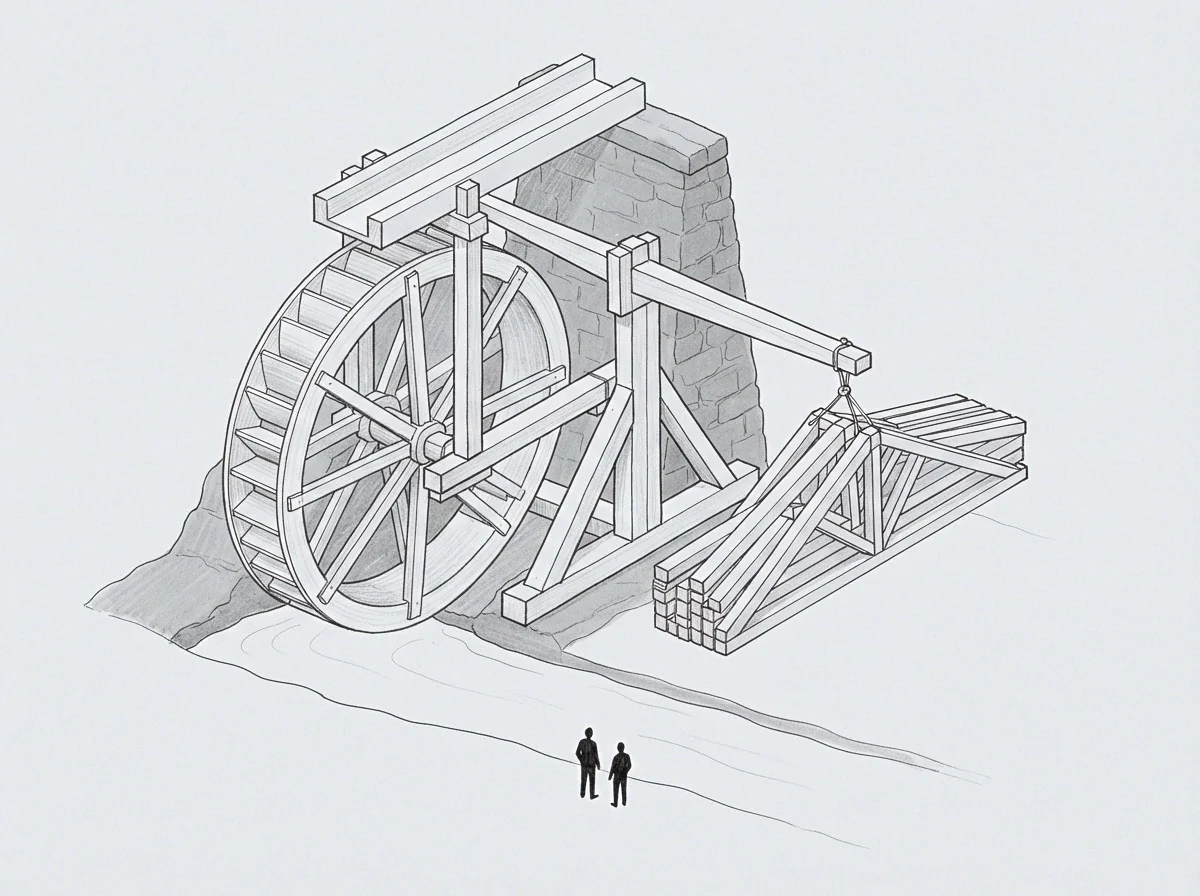
Quantifying unspent structural capacity requires measuring the distance between intended directives and actual execution paths. Central mandates attempt to force operational energy up a steep slope. When personnel route around that slope, the avoided energy does not disappear.
Energy remains conserved. It accumulates behind the wall of the central directive as unspent operational volume. Mirroring this negative gradient above the baseline reveals the latent capacity of the organization.

What Quantifies Latent Energy in Peripheral Routing?
Empirical tracking measures the divergence between central policy demands and informal operational habits over standard reporting cycles. Take an engineering organization with fifty builders where a central directive mandates a strict thirty-step compliance deployment process. Over six months, deployment velocity through the official pipeline drops to zero.
Local scripts rule. During that same window, the team launches eighteen feature variants through unmonitored local channels. The central pipeline recorded complete failure while the system produced high actual output.
The thirty-step directive created an artificial wall, but the energy bypassed the obstacle and gathered along the perimeter.
Calculating this unspent potential requires three distinct analytical steps:
- Vector Magnitude Identification measures the exact scalar distance between the formal compliance path and the informal workaround path chosen by operators.
- Baseline Deficit Calculation establishes the operational baseline by subtracting central administrative friction from raw peripheral production throughput.
- Latent Volume Derivation mirrors the avoidance gradient above the baseline to reveal the total work output achievable if friction were reduced to zero.
- Structural Threshold Adjustment shifts central directives down the slope until the cost of formal compliance matches the path of least resistance.
Spatial Derivation of the Latent Baseline
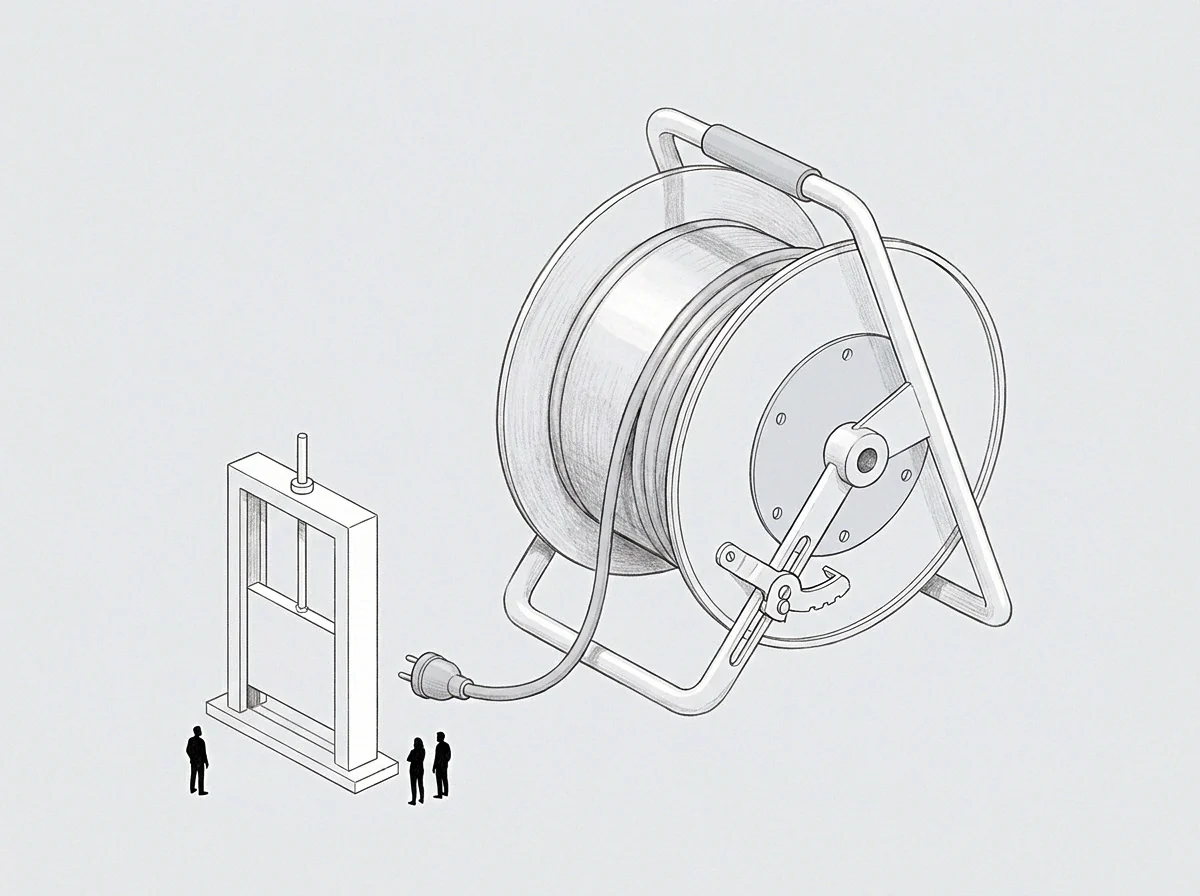
Measurement demands baseline calibration. The unspent volume represents potential work held in reserve due to administrative overhead. When an organisation treats avoidance as a diagnostic signal rather than a breach of discipline, the magnitude of the avoidance vector directly informs future capacity planning.
The area between the central directive’s intended path and the actual perimeter route defines the latent potential available for extraction.
A system that spends forty percent of its operational capacity bypassing central directives creates a latent production vector of equal scalar magnitude.
Capacity sits unspent. An organisation that forces personnel to spend energy dodging central oversight loses the productive potential of that energy. Once the avoidance vector is mapped, shifting the directive toward the observed path of least resistance converts perimeter work into baseline output.
A formal release of central compliance protocols at thirty percent friction reduction converts accumulated edge work into baseline output within two reporting cycles.

Room
Physical operational spaces reflect the structural drift between formal leadership commands and daily execution realities. Desk layout, informal communication lines, and shadow file systems map the real workflows of an organisation. Policy sets targets.
Execution defines limits. The distance between the boardroom table and the desk where execution happens measures the true friction of central commands.

Structural Friction and Peripheral Adaptation
Friction drives drift. When central directives fail to account for operational constraints, the system creates parallel structures to survive. The formal organization exists on organizational charts, while the informal organization handles execution inside informal channels.
Evaluating the divergence between central directives and peripheral adaptations yields critical structural data.
| Evaluation Dimension | Central Directive Path | Peripheral Adaptation Path |
|---|---|---|
| Energy Expenditure | High energy expenditure due to compliance protocols | Low energy expenditure along path of least resistance |
| Execution Velocity | Low velocity restricted by administrative setpoints | High velocity optimized for local completion |
| Information Yield | Distorted compliance metrics sent up leadership chain | Accurate operational data held at system edge |
| Latent Potential | Trapped energy spent overcoming system friction | Accumulated capacity stored behind structural wall |
Systems seek equilibrium. The comparison demonstrates that peripheral adaptations preserve operational velocity at the expense of central visibility. Shadow routines persist.
When leadership attempts to enforce central directives through increased auditing, peripheral pathways simply move further outside formal tracking systems.
Formal policy sets the static target while informal practice defines the true operational capacity.
The central mandate remains visible on paper, but actual operations run entirely through local channels that leadership chooses to ignore.
Boundary
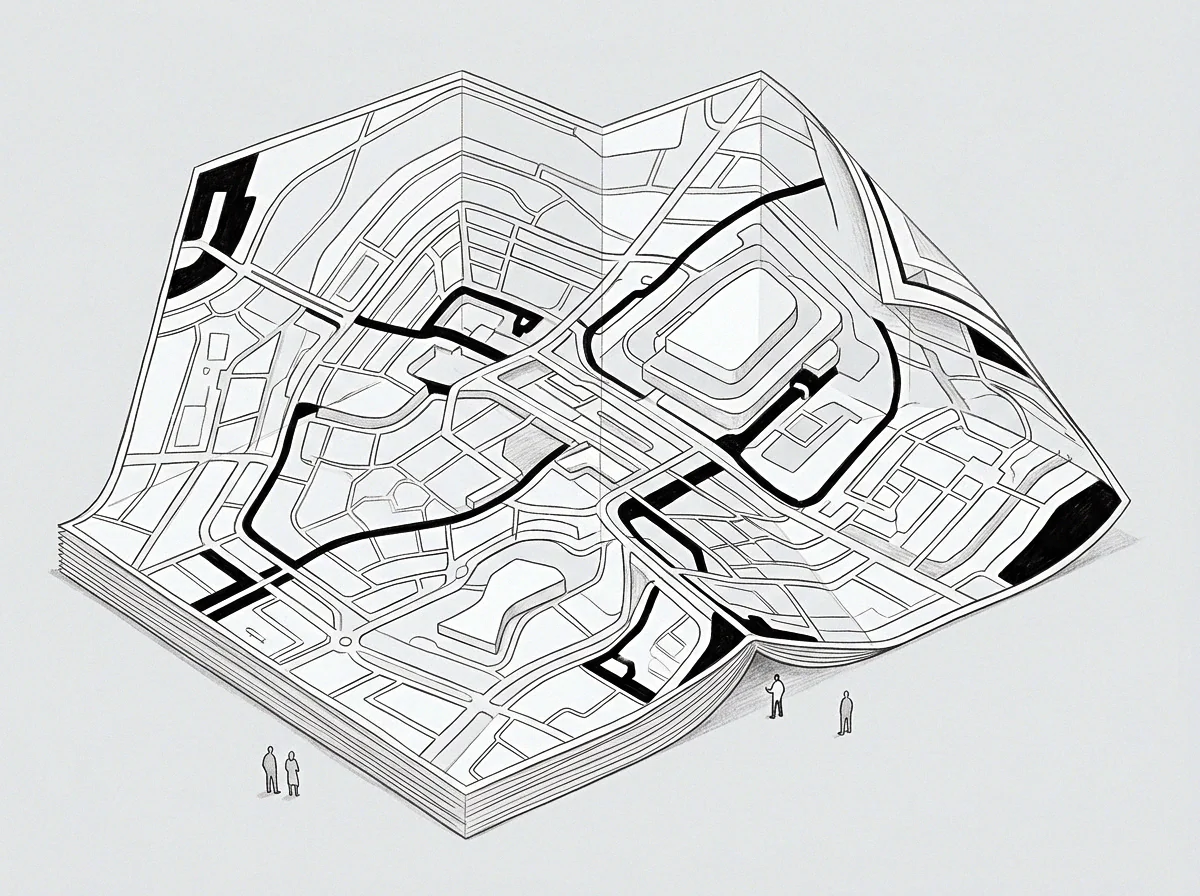
Operational limits reveal the exact wall where current organisational models stop functioning. The wall consists of actions the organisation refuses to take because the energy cost is excessive. Discomfort yields data.
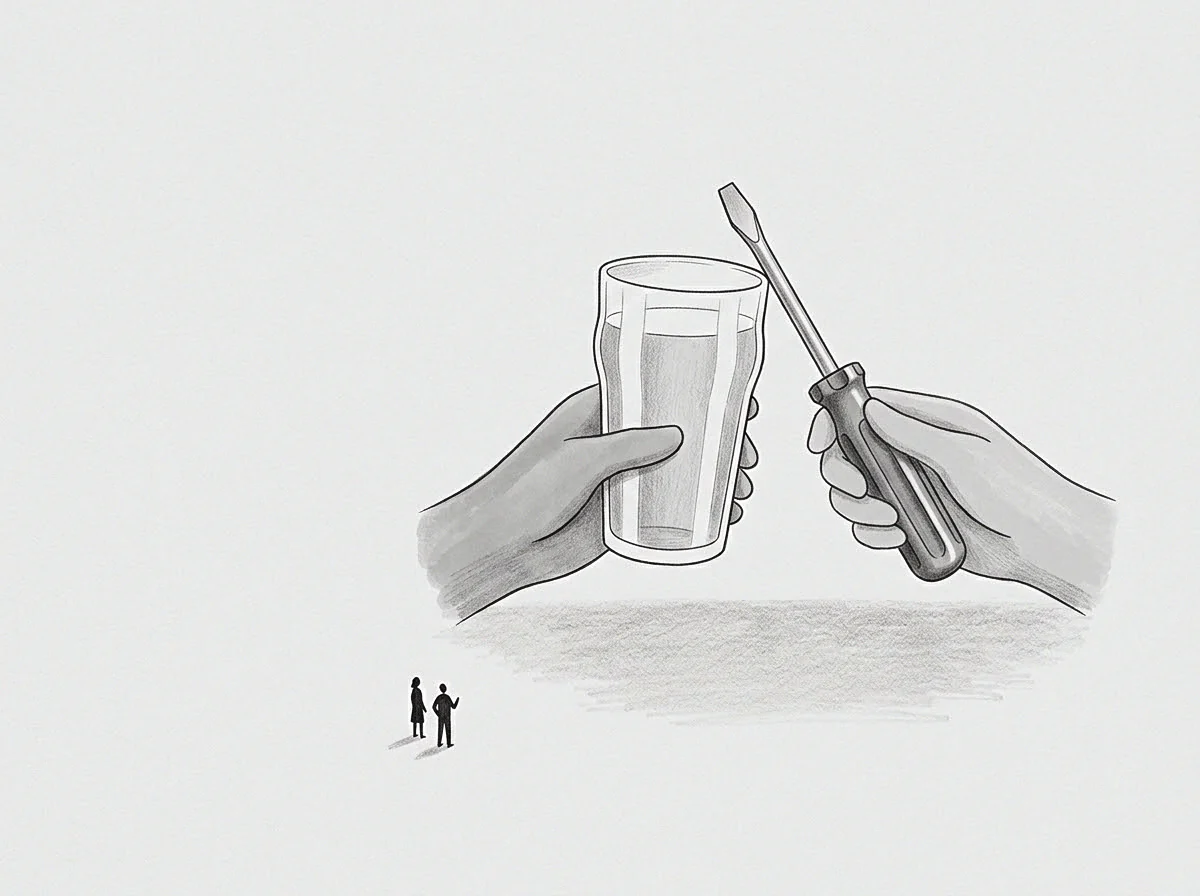
When operators hit an administrative boundary, the resulting friction signals high active computation rather than operational defect. Directives build walls. The perimeter of avoidance marks the outer frontier of the system’s current capacity.
Discomfort as Computational Signal
System failures provide exact coordinates for model expansion. Avoidance is the coordinate marker that shows where central planning lost contact with baseline physics. When an organisation maps its perimeter avoidance, it maps the boundary of its current operating model.
Pushing past this boundary requires lowering the energy barrier of central directives to match the observed mechanics of the edge.
Whether leadership can reduce directive friction before peripheral routines harden into permanent shadow infrastructure remains unresolved.