
Deriving Operational Baselines Under System Strain
Operational baselines derived under system strain separate load-distorted surge throughput from structural capacity by measuring internal deflection and recovery decay.

Gauge
A continuous deployment monitor flickered amber for nine consecutive hours while aggregate completion tallies climbed twelve percent above forecast. The dashboard showed the volume metric everyone had agreed to track. The engineering room remained quiet because the figures matched the commercial commitment.
In the back row of desks, three senior staff spent their afternoon manually resetting dropped database connections between customer transactions. The system maintained outward velocity by burning human intervention. Deriving an operational baseline under acute load begins by separating reported throughput from structural capacity.
When active strain distorts everyday observation, recorded production numbers reflect emergency adaptation rather than durable performance.
The sensor reads backpressure. Every operating architecture, whether mechanical or administrative, responds to incoming pressure by changing its internal posture. In nominal conditions, energy flows directly into visible product.
As incoming volume approaches the design ceiling, the ratio between energy input and recorded outcome shifts. Teams confuse this distorted ratio with a newly unlocked tier of capability. The founder watches a surge event, observes fifty client tickets cleared in an afternoon, and marks fifty tickets as the new baseline expectation.
That derivation treats an elastic elongation as a permanent structural expansion.
When request concurrency doubles without scaling memory, processing duration rises along an exponential curve while thread allocation plateaus.
Strain strips away decorative motions. In a software deployment or an industrial plant, early friction forces the elimination of non-urgent tasks. People drop documentation, skip exploratory testing, postpone maintenance, and truncate handoffs.
The resulting production rate appears exceptionally efficient because the balance sheet excludes deferred obligations. The true baseline represents the volume an operation sustains when all maintenance cycles run concurrently with primary production. Calculating that number requires stripping out the artificial speed gained by abandoning secondary functions.
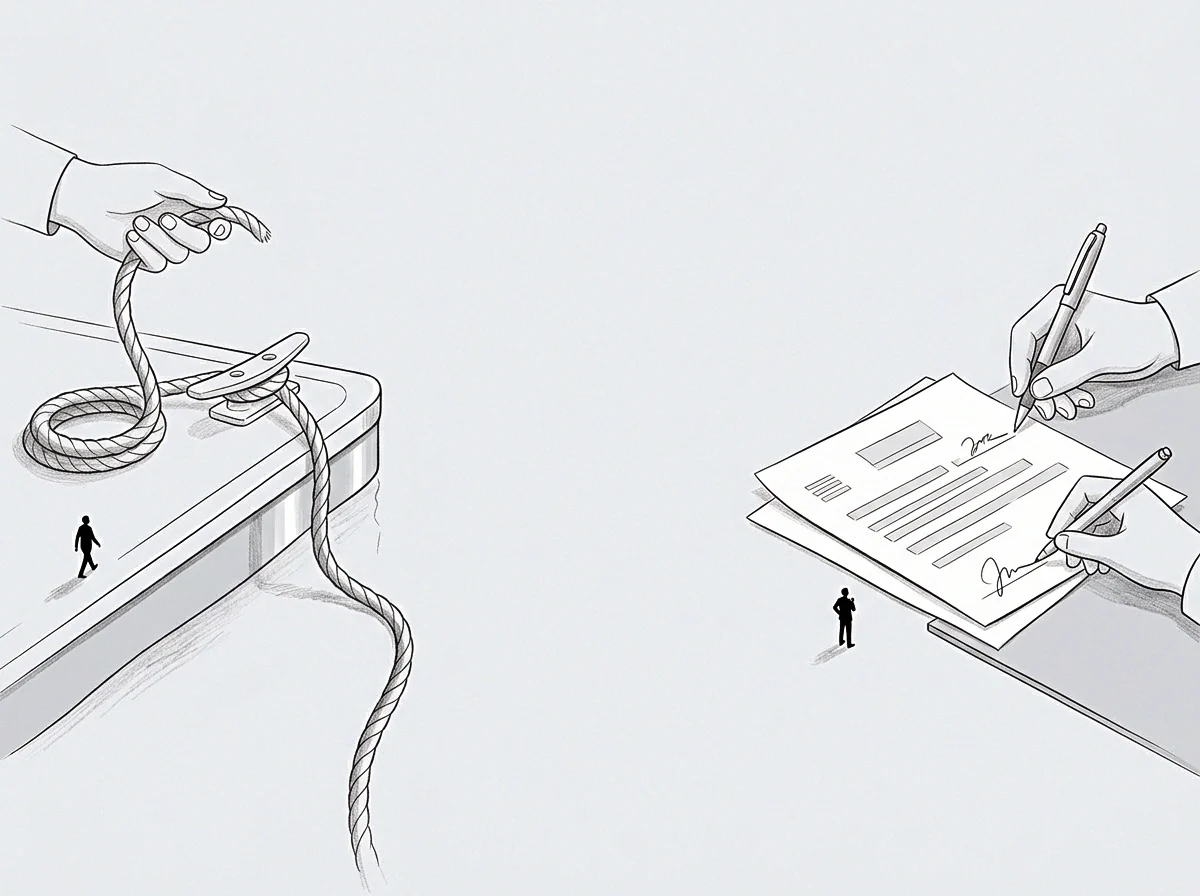
Transient Output Distortion
Incoming customer demand frequently forces operations into transient yield states where throughput figures become deceptive. Output numbers mask internal fatigue. When transaction volumes spike, workers switch into crisis triage, resolving issues through ad hoc workarounds that bypass formal recording channels.
The visible stream flows briskly, yet every transaction leaves an unrecorded debit in data integrity or documentation. Observers who take measurements during this window record an operational speed that cannot survive the restoration of standard compliance protocols.
Mathematical extraction of the baseline under active strain demands isolation of the work performed through standard mechanisms from the work produced via raw human intervention. If an organization clears one hundred units during normal operations and jumps to one hundred and forty during a crisis, analysts inspect where the forty units originated. If the extra volume came from unpaid overtime, deferred ticket logging, or temporary bypasses of quality controls, the true baseline remained one hundred.
Mistaking the surge figure for repeatable capacity causes systemic failure when standard operating conditions return, leaving teams depleted while chasing artificial quotas.

Separating Load Deflection From Structural Yield
Engineers assess material strain by measuring deflection under load versus permanent plastic deformation. Operational architectures exhibit identical physics. Deflection appears as temporary delay, elongated queues, and minor schedule slips that correct themselves once the volume pulse subsides.
Plastic yield occurs when internal processes fracture: operators resign, databases corrupt, vendor relationships fray, or core documentation ceases. A baseline derived from a system already undergoing plastic yield captures a dying process rather than a working foundation.
Tracking the return cycle provides the necessary correction. When the volume pulse recedes, the time taken for queues to clear and workers to resume normal operational cadence indicates the true health of the foundation. A system with a solid baseline absorbs the wave and returns to steady-state rhythm within hours.
A system operating beyond its baseline accumulates residue that delays recovery for weeks. Deriving numbers without auditing this recovery window produces operational targets that bankrupt organizational stamina.
Setting production standards from unadjusted peak output figures blinds management to structural fractures, ensuring that subsequent normal cycles trigger operational collapse under entirely ordinary commercial friction.
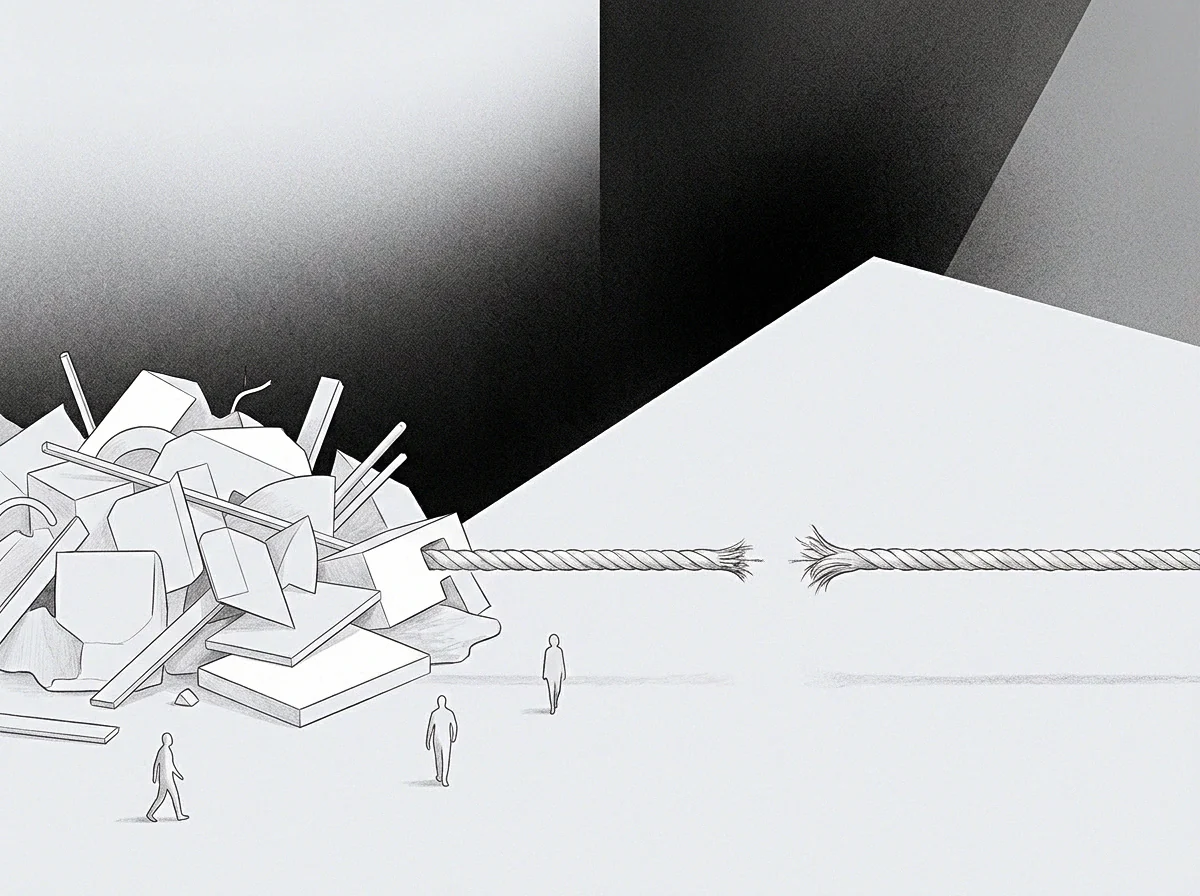
Drift
Internal degradation rarely announces itself through sudden catastrophic stoppages. Latent decay works through subtle adaptations that operators make to keep fragile workflows intact. The founder observes stable delivery deadlines and assumes the apparatus functions as intended.
Beneath that calm surface, staff build elaborate manual scaffolding to bridge widening gaps between technical capability and customer expectations. The true baseline drifts downward while recorded output metrics maintain an optical plateau.
Speed drops while intake doubles. To measure the true baseline during prolonged stress, observers identify what the system routes around. Avoidance serves as a coordinate marker for structural damage.
When customer support stops routing enterprise queries through the standard tracking portal, that avoidance identifies a broken intake mechanism. The work does not stop; it shifts into private direct messages, spreadsheets kept on personal hard drives, and verbal agreements made over desk partitions. The formal baseline measures an empty shell while actual operations proceed through invisible channels.

Latent Elasticity Consumption
Every operational process contains a buffer of latent elasticity designed to absorb routine operational variance. Under sustained system strain, this elasticity burns away silently. Workers use their discretionary attention to cover for sluggish software, missing documentation, or poorly configured automation tools.
Stored fatigue compounds silently. Because output remains steady, leadership remains ignorant of the fact that the entire enterprise operates with zero safety margin remaining.
The operator absorbs the deficit. The following indicators mark the invisible consumption of operational elasticity during high-load periods:
- Shadow Coordination Rhythms appear when teams institute informal morning check-ins to manually untangle workflow conflicts generated by malfunctioning management tools.
- Secondary Queue Sprawl develops when staff store unresolved customer requests in offline scratchpads to prevent ticketing platforms from breaching official response thresholds.
- Localized Protocol Pruning occurs when senior specialists unilaterally abandon mandatory compliance checks to keep daily delivery velocity aligned with management expectations.

What Separates True Setpoints From Transient Yield?
Distinguishing authentic setpoints from transient survival maneuvers demands rigorous analysis of energy input relative to functional return. A genuine operational setpoint remains self-sustaining across rolling monthly cycles without requiring exponential increases in managerial oversight. In contrast, transient yield relies entirely on acute panic, adrenaline, and executive micromanagement to prevent operational collapse.
Measuring velocity during a crisis without factoring in the accompanying surge in management energy yields an inflated, non-repeatable capacity metric.
A metric derived during crisis registers desperation rather than repeatable baseline throughput.
The baseline calculation must account for the rate of return to nominal performance once external pressure drops. If an operational unit requires three weeks of collective recovery, backlog clearing, and emotional decompression after a four-day crunch, the crunch output cannot enter baseline calculations without heavy discounting. The energy borrowed during the event represents operational debt that must be serviced with interest during the subsequent period.
True baselines measure only the output sustainable while servicing all ongoing maintenance obligations in real time.
A baseline derived from an exhausted apparatus measures nothing more than the speed at which that apparatus consumes its own structural reserves.

Shelf
Physical inspection of primary working surfaces reveals structural reality faster than any synthetic reporting pipeline. On a factory bench or a software engineer’s workstation, the accumulation of unprocessed raw materials signals the true location of the operational bottleneck. Consider an operational unit of six engineers handling twelve concurrent client migrations under heavy contract pressure.
Management tracking software indicates all twelve migrations proceed on schedule. Inspection of the internal repository shelves reveals that five migrations contain zero integration tests, four utilize hardcoded authentication keys, and three rely on manual database dumps executed at midnight.
Friction accumulates along the seams. The apparent velocity exists entirely because the team deposited systemic risk onto the technical shelf. When deriving a realistic baseline under such strain, the observer measures the volume of work sitting on that shelf waiting for remediation.
Every deferred task represents negative output that offsets reported gains. Subtracting the remediation cost from the gross production tally yields the true baseline of the operational machine.
Setting performance targets against peak emergency velocity guarantees systemic depletion during the subsequent working quarter.

The Physical Surface of Friction
Mechanical stress reveals itself at connection points where disparate components interface. In administrative workflows, friction materializes at departmental boundaries: the handoff between sales and implementation, the bridge between design and engineering, or the transfer from development to quality assurance. Under normal load, these handoffs proceed with orderly documentation and verified handshakes.
Under system strain, handoffs become rushed exchanges where critical specifications vanish. The baseline calculation must focus specifically on these boundary surfaces.
Measuring the time work spends idling at interface boundaries provides an unvarnished reading of system health. If an order takes three hours to produce but sits on a staging shelf for three days waiting for shipping clearance, the operational baseline remains tethered to the three-day shelf delay, not the three-hour production speed. Optimizing the production station while ignoring the holding shelf yields mathematical fiction that distorts executive capacity planning.

Comparative Response Profiles Across Operating Regimes
The table clarifies the divergence. To extract durable baselines during high-stress conditions, operational states must be classified by their structural sustainability rather than superficial output tallies.
| Operating State | Observed Cycle Velocity | Internal Deficit Accumulation | True Baseline Capacity |
|---|---|---|---|
| Nominal Steady State | Predictable forty-hour sprint turnaround | Zero unhedged backlog carried forward | Full structural throughput preserved |
| Active Surge State | Superficially elevated commit frequency | Undocumented architectural debt accumulation | Seventy percent of reported output velocity |
| Compensated Strain State | Volatile turnaround with frequent halts | Compounded operator sleep deficit | Forty percent structural capacity remaining |
The comparative data illustrates why derivation methodologies must discount raw sprint metrics during active surges. When operations drift into the compensated strain state, reported cycle times fluctuate wildly because unexpected micro-failures constantly interrupt primary production. The true baseline represents what the organization completes when all defensive, compliance, and recuperative routines operate alongside primary delivery lines.
A contract clause that pegs recurring delivery quotas to performance recorded during active surge periods triggers mandatory financial penalties as soon as operational fatigue forces throughput back down to physical reality.

Gradient
Mathematical derivation of an operational baseline requires plotting performance against a rigorous input axis. When system strain alters operational conditions, tracking performance along simple cardinal numbers such as units shipped or hours billed obscures structural realities. The analyst plots an ordinal scale of input difficulty against the rate of output decay.
The slope of this decay curve reveals the true operational baseline of the underlying architecture.
The vector points downward. Consider naval hull inspections during wartime operations, where structural engineers analyze strain gauges mounted along steel bulkheads under heavy wave action. The engineers do not calculate hull strength by measuring the ship’s forward knot speed through a storm.
They measure the micro-deflection of the steel plates relative to water pressure, deriving the vessel’s hull integrity from the slope of elastic deformation. Operational baseline derivation under organizational strain operates on identical principles. Forward speed indicates current propulsion energy; the gradient of internal deflection reveals structural reality.
The operator kept the deployment pipeline green while three senior engineers spent the week answering incident tickets.
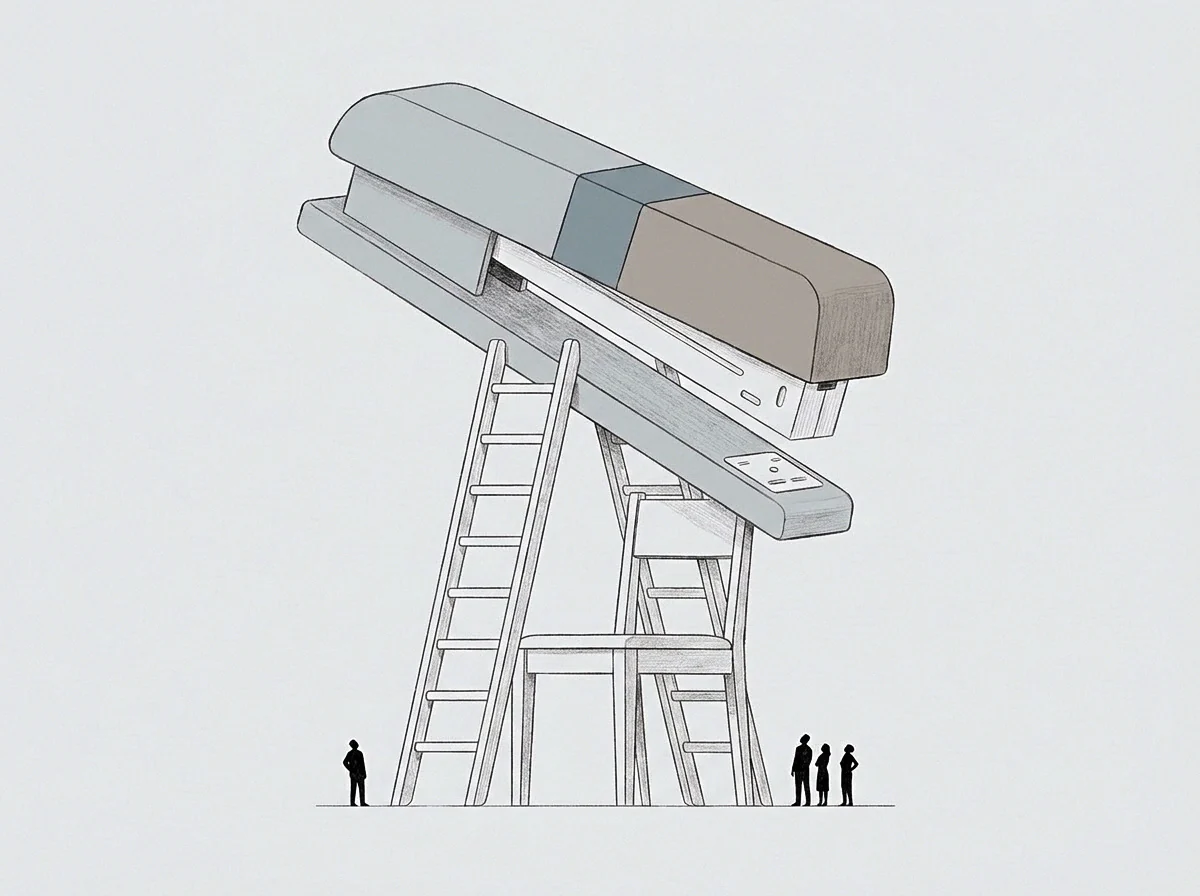
Ordinal Ranking of Input Elasticity
Deriving the baseline requires organizing operational strain into distinct, measurable tiers of difficulty. Teams borrow against tomorrow. Instead of relying on crude financial cost figures, analysts observe which organizational assets the system consumes as external pressure mounts.
The consumption sequence proceeds through predictable stages, each marking a steepening negative gradient:
- Discretionary Focus Allocation marks the initial reaction to volume pressure, during which staff cut informal professional development, internal mentoring, and strategic reflection to sustain production lines.
- Preventive Maintenance Suspension follows rapidly as workers stop updating process documentation, cleaning working tools, and running routine system diagnostics to preserve operational seconds.
- Structural Asset Liquidation represents the final defensive descent, characterized by burning institutional trust, violating employee rest cycles, and alienating core vendors to fulfill immediate delivery commitments.

The Boundary Geometry of Avoidance
The wall marks the perimeter. In optimization theory, gradient descent maps the path of least resistance across a mathematical landscape. In human organizations under intense strain, workers execute gradient descent by routing around tasks that demand high cognitive computation.
When an operational baseline is calculated, observing what staff systematically avoid reveals where the current operating model hits its wall. The magnitude of avoidance mirrors the magnitude of unspent, unprocessed organizational friction.
Computation replaces routine reflex. When a process hits its boundary, workers stop thinking through standard operating logic and resort to emergency preservation. If staff consistently refuse to touch a specific billing module or client onboarding protocol during busy periods, that refusal establishes the exact boundary of the viable operating baseline.
The baseline cannot include operations beyond that wall because entering that territory demands energy reserves the organization does not possess.
The clients will simply take their business down the street if delivery timelines slide backward by two weeks to accommodate internal process maintenance.

Reserve
True recovery demands complete cessation. When an organization endures prolonged operational strain, management frequently attempts to re-establish baselines by introducing marginal efficiencies: shortening daily meetings, adopting lightweight task boards, or shuffling seating arrangements. These minor interventions fail because they leave the underlying strain vector untouched.
Establishing a durable operational baseline requires anchoring the organizational floor directly to physical reality.
The floor holds the weight. A viable baseline represents the minimum dependable throughput an operation produces when every participant works strictly within sustainable physical constraints. Deriving that baseline demands measuring output when all overtime ceases, all maintenance functions run at full regulatory frequency, and no uncompensated human effort enters the production equation.
Anything above that floor represents temporary surge volume, not operational baseline capacity.
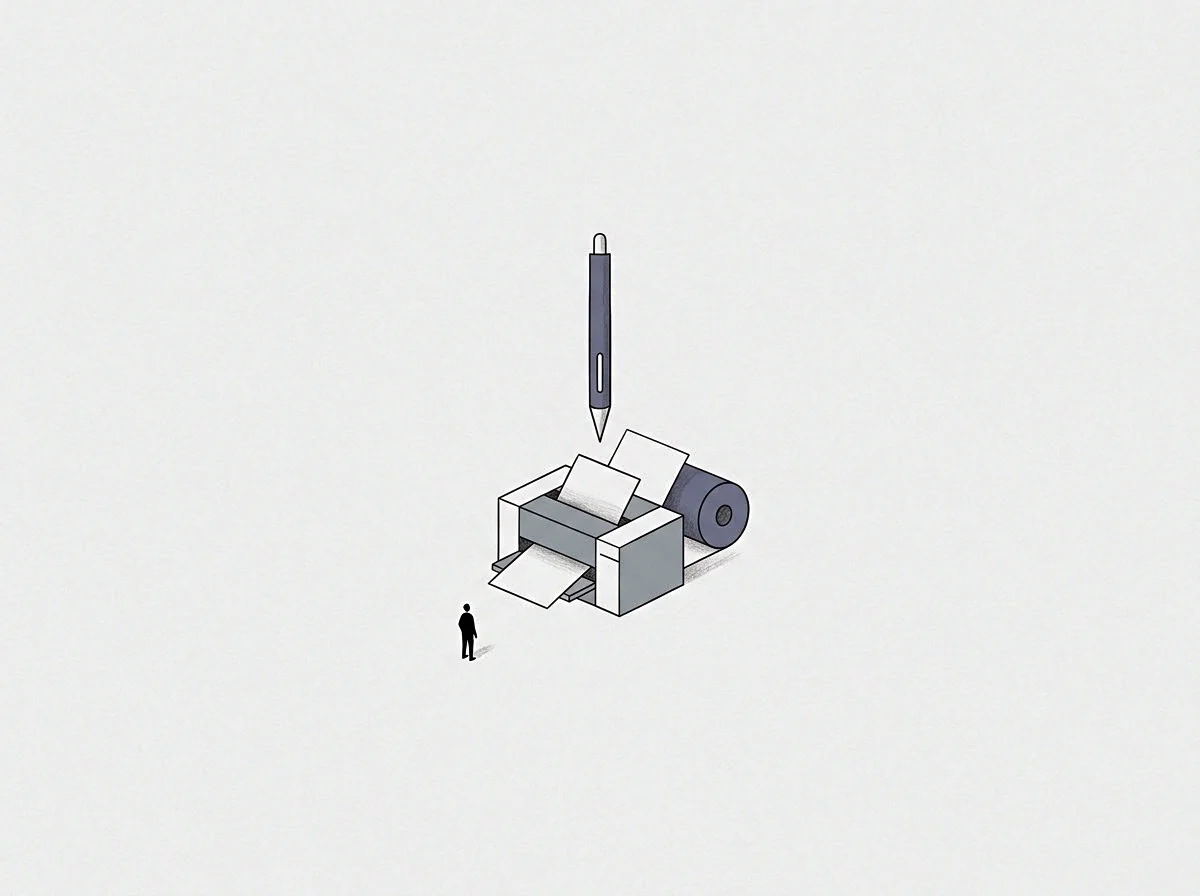
Floor Stabilization Under Persistent Load
Stabilizing the floor requires stripping out executive optimism. When leadership calculates capacity, they frequently blend historical best-case outputs with current emergency spikes, producing a synthetic target that guarantees continuous operational failure. An authentic baseline calculation looks exclusively at performance delivered during the least productive, highest-friction shifts.
That lower bound represents the true structural capacity of the organization.
Deriving the baseline from this conservative boundary protects the enterprise from compounding debt. When commercial commitments reflect the absolute floor, every temporary surge in human energy or technical availability produces an unallocated surplus that replenishes organizational reserves. When commitments reflect the peak surge capacity, every minor operational hiccup forces the team into immediate emergency triage, burning through capital and personnel to avoid default.

Unspent Capacity Beyond the Model Wall
Beyond the current boundary wall sits unspent capacity that the organization cannot access under its existing configuration. Accessing that volume requires restructuring the operating model rather than pressing harder against current limits. Pushing an exhausted team against an existing operational wall produces exponential friction for linear, vanishing returns.
The baseline calculation documents precisely where that dynamic begins, marking the threshold where additional input energy yields negative organizational value.
Deriving operational baselines under system strain is therefore an exercise in mapping boundaries rather than celebrating peak outputs. By measuring deflection, auditing friction surfaces, and discarding transient crisis maneuvers, the operator uncovers the durable foundation that remains when the noise of emergency management recedes. That foundation provides the only reliable datum for building future operational expansion.
How much structural capacity must an enterprise deliberately leave idle during peace to guarantee survival when the next prolonged operational surge arrives?