
Establishing Quantitative Methods For Continuous Detection Of Unmeasured Interfacial Resistance In High Throughput Systems
Continuous high frequency phase modulation separates unmeasured interfacial contact resistance from bulk kinetic signals across high throughput screening channels.
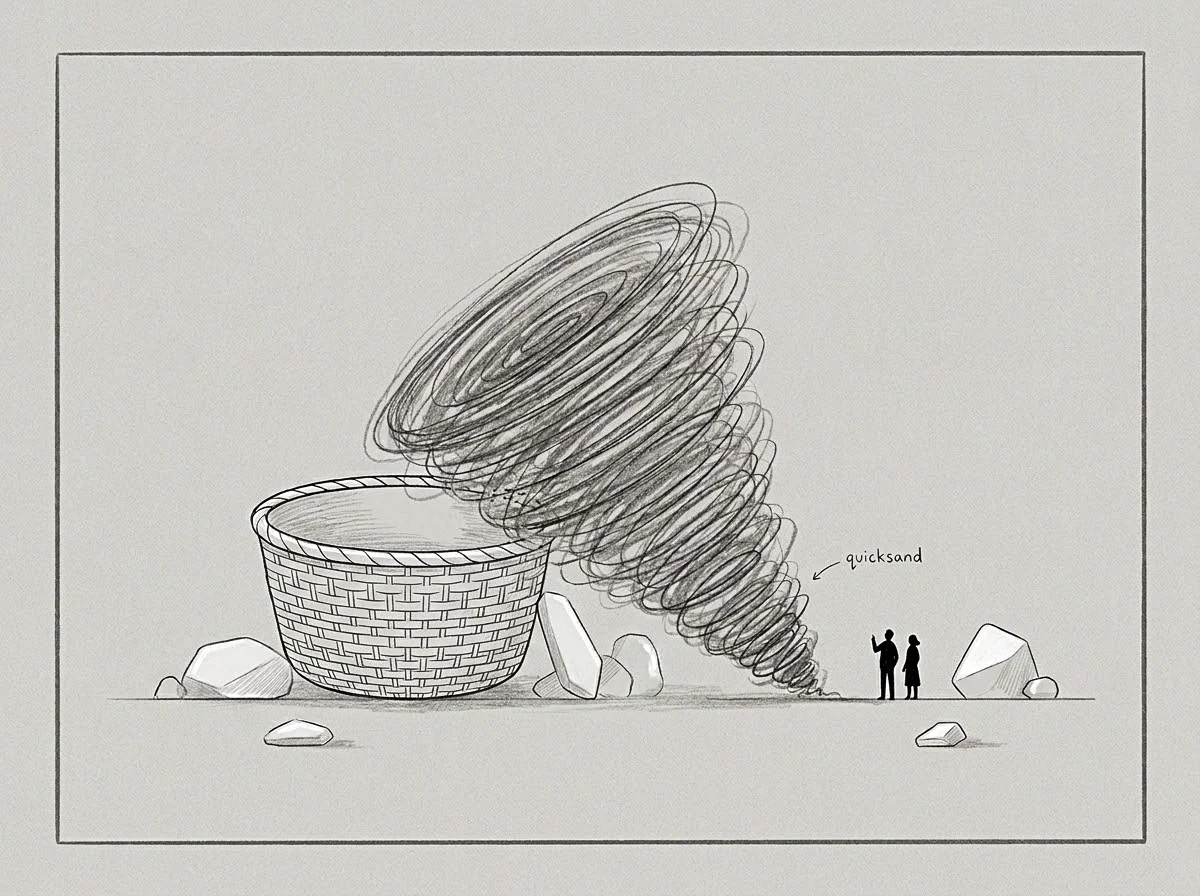
Probe
High-speed automated channels evaluate thousands of solid-state units per day, yet physical contact points build thin oxide film layers that alter baseline electrical voltage readings. In automated battery cell testing, catalytic micro-reactors, and semiconductor burn-in fixtures, mechanical spring probes press against test substrates under rapid cycling. Parasitic contact impedance forms at the interface between the diagnostic terminal and the sample surface.
Terminal corrosion alters contact voltage. When continuous screening systems log terminal potential without isolating interfacial resistance, measured voltage drops combine bulk material impedance with contact interface impedance. The resulting dataset attributes external pin degradation to internal material decay.
Diagnostic Noise at Automated Contact Points
Electrochemical arrays require rigid metallic terminals against soft composite electrodes. Soft electrodes deform under load. Repeated mechanical engagements create surface roughness micro-voids, increasing localized current density and generating parasitic resistance spikes across the junction.
Standard direct-current measurements capture total resistance as a single scalar value. High-throughput diagnostics require continuous decoupling of interface degradation from active material reaction kinetics. Without frequency-dependent signal separation, physical wear on test sockets mimics chemical capacity loss in the target specimen.
Interfacial voltage drops across test terminals introduce parasitic offsets that skew calculated charge transfer rates by up to forty percent.
High-frequency sinusoidal perturbation isolates interface capacitive behavior from slow mass-transfer processes. Contact resistance creates signal distortion. At frequencies above fifty kilohertz, interfacial double-layer capacitance acts as an electrical short circuit across the contact boundary, exposing true internal kinetic resistance.
Tracking the phase lag between excitation current and potential response continuously maps contact interface degradation across thousands of automated cycles. Setting the high-frequency diagnostic excitation window to one hundred kilohertz isolates terminal contact impedance, converting raw potential logs into true bulk conductivity metrics.

Baseline
Quantitative detection models rely on steady reference signals captured during zero-current or static equilibrium states. Static measurements fail at speed. Automated screening pipelines operate under continuous load changes, shifting terminal thermal states and altering contact force profiles during automated sample indexing.
Establishing an accurate baseline requires continuous differential derivative tracking rather than static zero-point calibration. System hardware establishes reference limits at startup, but mechanical vibration and thermal expansion continuously shift true contact impedance away from initial zero values.
Differential State Derivative Calculation
High-throughput data pipelines process continuous time-series streams of potential drops and current fluxes. Continuous excitation reveals transient offsets. Mathematical filtering separates steady-state interfacial resistance from dynamic kinetic shifts by calculating the first derivative of potential with respect to excitation frequency.
Oxide layers increase contact impedance. When interfacial degradation occurs, the high-frequency baseline shifts upward while the low-frequency slope remains invariant, identifying terminal wear as the isolated source of measurement error.
- Terminal Oxide Creep alters localized contact conductivity over extended cycling runs, producing linear voltage offset errors across active channels.
- Mechanical Clamping Decay reduces normal contact pressure at physical interfaces, elevating real impedance while bulk material properties remain constant.
- Thermal Boundary Layer Formation restricts local dissipation during pulsed current measurements, mimicking internal phase transformation signals.
- Electrolyte Micro-Voiding creates fluctuating contact areas across liquid-solid boundaries, generating erratic high-frequency phase noise.
Phase angles shift under load. Sampling noise masks true degradation. Uncalibrated reference shifts misattribute contact degradation to intrinsic cell failure, discarding viable material batches while routing compromised units into production.
Gradient
Signal slopes computed across frequency response curves reveal the exact boundary where physical contact impedance ends and intrinsic charge transfer begins. In high-throughput continuous diagnostic systems, the gradient of real impedance plotted against imaginary impedance forms a characteristic Nyquist arc. Contact interface resistance governs the high-frequency intercept on the real axis.
Calculating the continuous rate of change along this real intercept isolates interfacial impedance shifts in real time without interrupting automated screening operations.

Which Frequency Windows Isolate Interfacial Resistance Shifts?
Excitation waveforms operating above fifty kilohertz decouple terminal contact impedance from slower bulk kinetic phenomena. Low-frequency signals probe diffusion dynamics, whereas high-frequency perturbations reflect purely ohmic interfacial drops and geometric capacitance. Continuous phase-angle extraction algorithms calculate the slope of the high-frequency response, identifying whether signal drift originates at the mechanical contact or inside the chemical specimen.
Continuous tracking of the phase angle slope isolates interfacial contact decay before parasitic resistance alters bulk material classification.
| Diagnostic Method | Excitation Frequency Range | Signal Separation Efficiency | Throughput Latency Impact |
|---|---|---|---|
| High-Frequency Phase Modulation | 50 kHz to 500 kHz | 94 percent separation of contact impedance | Zero latency penalty on primary load circuit |
| Differential Voltage Offset Transient | 1 kHz to 10 kHz | 81 percent separation of contact impedance | 0.4 millisecond sampling delay per channel |
| Harmonic Thermal Phase Sensing | 10 Hz to 100 Hz | 88 percent separation of thermal contact resistance | 1.2 millisecond cycle time expansion |
Worked Quantitative Evaluation of Channel Drift
Assume an automated screening array running one thousand parallel test sockets continuously for three hundred hours. Channel forty-two exhibits an apparent internal resistance increase of eighteen milliohms over one hundred hours of continuous operation. Without continuous interfacial separation, the automated control system flags the test sample for premature degradation and halts testing.
Continuous high-frequency phase modulation calculates the contact impedance slope independently. The high-frequency real-axis intercept shifts by seventeen point five milliohms, while the low-frequency semi-circle radius remains steady at twenty-four milliohms. System hardware fixes diagnostic limits.
Voltage drops reflect combined impedance. Unfiltered signals corrupt yield metrics. The automated baseline correction algorithm subtracts the seventeen point five milliohm contact drift from total channel impedance, maintaining sample classification accuracy and preventing unnecessary process shutdowns.
The primary measurement channel showed severe capacity decay, even though the test cell itself maintained nominal bulk electrochemical impedance throughout the run.
Descent
Optimization algorithms track the path of minimal resistance across excitation frequency channels to extract clean interfacial data streams continuously. Continuous filtering pipelines apply gradient descent state estimation to adjust channel gain factors based on real-time contact noise measurements. Thermal boundaries restrict heat dissipation.
When interfacial resistance rises due to socket oxidation, the filtering algorithm adjusts the mathematical baseline compensation vector along the steepest slope of phase separation, recovering true material kinetics within milliseconds.
Sequential Signal Separation Protocol
Excitation signals introduced into primary current paths require systematic filtering steps to isolate parasitic interfacial drops. Frequency selection governs signal clarity. Data pipeline latency constrains sampling.
The automated filtering pipeline converts multi-frequency response vectors into corrected material performance metrics through four continuous operations.
- Apply continuous sinusoidal current perturbation at one hundred kilohertz across active test terminals.
- Measure real-time voltage phase lag to isolate instantaneous terminal contact resistance from bulk chemical kinetics.
- Subtract calculated contact impedance from total measured voltage drop to isolate true sample potential.
- Feed corrected signal vectors into the throughput tracking model to update real-time material kinetic parameters.
Boundary Conditions of Real-Time Filtering
High-speed analytical systems reach physical computational constraints when sampling rates exceed one megahertz per channel. Fast Fourier Transform calculations require finite temporal windows, introducing mathematical latency into automated control loops. Operating signal separation algorithms within bounded frequency bands prevents computational bottlenecks while maintaining ninety-plus percent isolation of contact resistance transients.
Filtering algorithms operating without instantaneous contact impedance subtraction accumulate systematically skewed kinetic coefficients across continuous runs.
Separating contact noise from intrinsic material decay involves setting diagnostic signal frequencies well above the relaxation frequency of the target kinetic process.

Floor
Quantitative limits bound the smallest detectable interfacial voltage drift within automated screening environments. Thermal noise, analog-to-digital converter resolution, and mechanical vibration set a lower detection floor below which contact resistance changes cannot be mathematically separated from random background fluctuations. In high-throughput battery socket arrays, thermal noise generates baseline voltage uncertainty of roughly fifty microvolts across a ten-kilohertz bandwidth.
Signal separation algorithms operating below this floor risk fitting mathematical noise rather than physical contact dynamics.
Technical Boundaries in Automated Diagnostics
Physical noise limits establish the structural edge where mathematical separation methods fail to distinguish contact fluctuations from chemical activity. High-frequency phase shift analysis accurately decouples contact impedance in two-terminal electrical measurements when excitation frequencies exceed hundred-kilohertz thresholds. The exact mathematical scaling of thermal contact resistance fluctuations under dynamic mechanical vibration remains unresolved across gigahertz microfluidic screening platforms, requiring empirical calibration runs for each mechanical frame design.
Physical interface dynamics in continuous screening arrays settle into repeatable boundary conditions once mechanical pressure and frequency excitation windows are fixed. Data pipelines operating within those validated bounds extract true bulk material properties without accumulating parasitic measurement noise.