
Measuring Capital Deflection in Scaling Teams
Capital deflection measures the liquidity diverted from direct value creation into internal coordination, interface negotiation, and defensive alignment.

Route
Fresh equity enters a bank account with explicit intent, yet its path across an expanding headcount bends away from direct product output. When twenty engineers join a group that previously held five, weekly shipped volume per person drops while total expenditure climbs fourfold. The gap between expected linear output and realized production defines capital deflection.
It measures the financial volume redirected into internal friction, interface negotiation, and defensive consensus. Teams rarely spend capital on overt luxuries. Money bleeds through structural diffusion, where every added participant expands communication paths combinatorially, pulling liquid reserves away from the primary problem into organizational maintenance.
The gradient of output relative to spend turns negative long before leadership detects the shift. Because progress metrics like pull requests merged or sprint points completed continue to climb, internal dashboards report healthy activity while raw delivery velocity toward market interfaces slows. Value axis measurement tracks actual changes in primary capability rather than internal task counts.
When capital takes the path of least resistance, it routes around difficult technical thresholds and into coordination rituals.
- Interface deflection occurs when specialists spend scheduled hours negotiating handoffs between architectural components rather than refining the core technology.
- Consensus insulation emerges as layers of middle management author internal proposals designed to protect departmental territory against audit.
- Administrative absorption directs operational liquidity into secondary tooling, redundant vendors, and governance structures that produce no external utility.
Capital flows along lines of organizational friction.
When additional capital expands the headcount of an uncalibrated team, operational liquidity routes into interface negotiation before reaching customer interfaces.
Left unmeasured, this misdirection deepens until additional cash reserves fail to shorten delivery schedules. Ignoring the initial deviation risks financial exhaustion while internal reports continue to show green status across operational units.

Seat
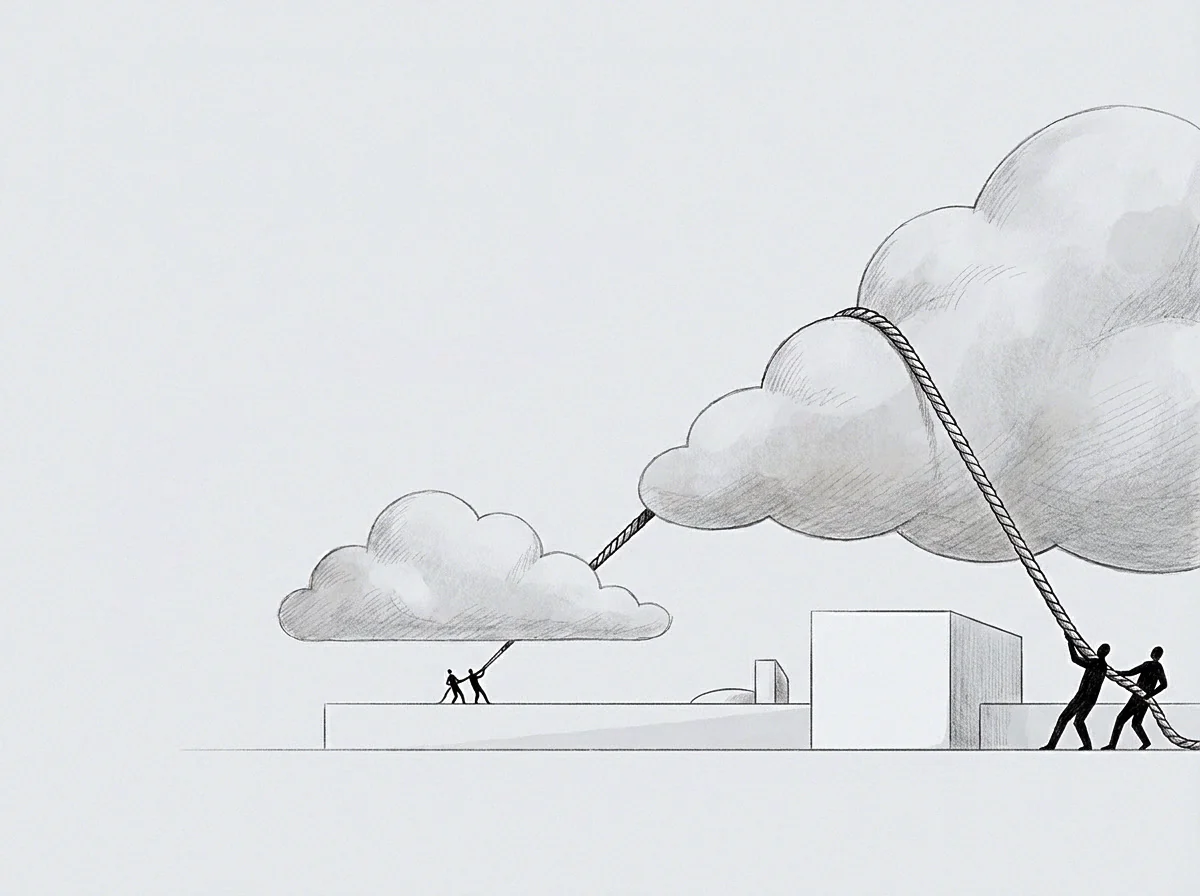
Headcount Expansion and the Drag Coefficient
Hiring plans often treat headcount as interchangeable units of capacity, assuming each incremental wage buys equivalent velocity. In practice, a newly filled role introduces relational dependencies across active system components. Instead of generating marginal utility from day thirty, each hire imposes an initial tax on experienced peers through onboarding, documentation reviews, and synchronization meetings.
In a company expanding from twenty to eighty people, coordination consumes the majority of total payroll rather than a marginal fraction.
The baseline operational burn rate rises permanently with every contract executed. Fixed payroll converts discretionary cash into contractual obligations, narrowing the strategic window available for experimentation. When capital routes into staffing layers that manage other managers, output flattens relative to spend.
Work stalls at unresolved structural interfaces.
| Team Size Tier | Direct Production Share | Coordination Drag Share | Deflection Vector Type | Observed Output Ratio |
|---|---|---|---|---|
| Tier A (5 to 12) | 0.82 | 0.18 | Tooling Setup | 1.00 Baseline |
| Tier B (13 to 45) | 0.54 | 0.46 | Interface Handoffs | 0.68 per Seat |
| Tier C (46 to 150) | 0.29 | 0.71 | Consensus Governance | 0.36 per Seat |
Direct production capacity contracts as the organization broadens its ranks. In Tier C, seventy-one cents of every compensation dollar sustains internal alignment rather than creating differentiated value. Leadership frequently mistakes alignment overhead for operational scaling, while the underlying output per seat declines with each hiring cohort.
The organization creates defensive buffers to shield itself from execution accountability.
Procedural compliance masks underlying product decay.
Allocating the headcount requested in the annual budget failed to prevent delivery velocity from dropping by half.

Leak
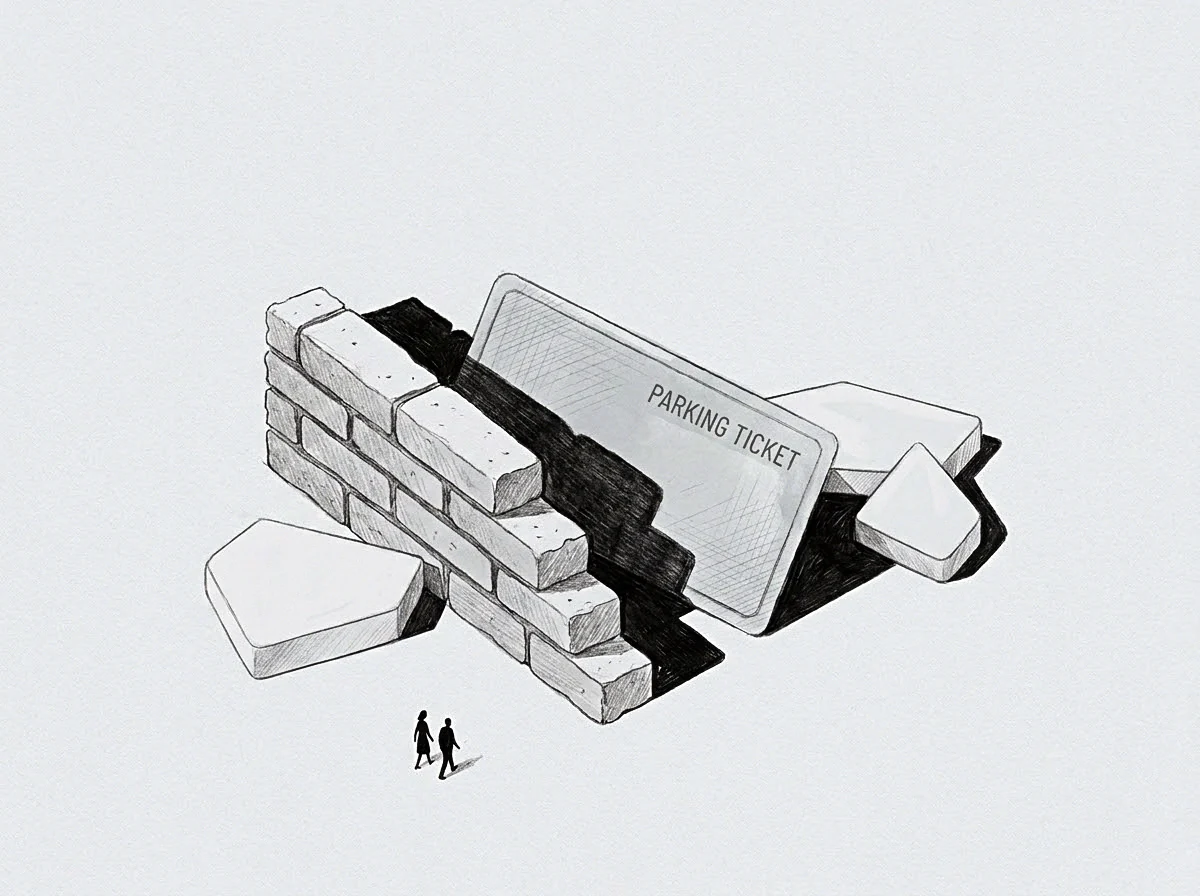
How Rapidly Does Coordination Siphon Production Value?
Secondary operational expansion creates conduits through which capital escapes without creating visible debt. Software subscriptions multiply across departments, middle management commissions exploratory reports from outside agencies, and internal committees establish protracted review cycles. The path of least resistance within an organization favors procedural caution over decisive execution, consuming capital while insulating decision-makers from the consequences of failure.
When an engineering director faces uncertainty around architecture, hiring four additional engineers appears safer than refactoring the underlying data model with existing staff. The new hires require onboarding, dedicated management, testing infrastructure, and revised reporting workflows. By routing around the difficult task of making an irreversible architectural bet, management converts acute operational uncertainty into chronic financial burn.
The volume of capital spent on administrative avoidance mirrors the magnitude of the technical debt left unaddressed.
The volume of capital deflected into internal alignment matches the magnitude of the unresolved technical decision leadership avoids.
Sequential decay follows when structural expansion substitutes for strategic focus:
- The primary product team encounters unexpected friction in customer acquisition or feature reliability.
- Executive leadership attributes the lag to resource constraints and allocates capital for immediate hiring expansion.
- Senior practitioners shift seventy percent of their working attention toward interviewing, evaluating, and onboarding incoming cohorts.
- Newly formed sub-teams create protective coordination boundaries, generating internal communication silos that require cross-functional liaisons.
- Overall production output drops, prompting leadership to authorize another round of capital deployment to correct the deficit.
Baseline operational drift accelerates under continuous expansion.
Internal friction steadily consumes available liquid reserves.
Capital deflection stems both from structural complexity and from social barriers built by operators seeking protection from direct market exposure.

Floor

Establishing Measurement Baselines
Tracking deflection requires establishing an ordinal baseline before deploying capital into team expansion. If leadership cannot quantify the unit cost of primary output when ten people occupy the room, calculating deflection at fifty people proves impossible. Ordinal tracking reveals whether current work ranks higher in utility than work completed three months prior, whereas cardinal accounting only records total treasury expenditure.
The wall represents the boundary of the current operating model, formed by tasks the system avoids because executing them requires intense focus. When teams scale, they push capital against this boundary, deflecting funds laterally into familiar tasks rather than resolving the core constraint. Measuring this shift requires auditing calendar allocations, communication network density, and the latency between code commits and user verification.
Unmonitored software licenses accumulate secondary operating debt.
A direct test reveals deflection in scaling software teams: measure the calendar hours separating an agreed technical specification from production deployment. In an uncompromised team of six, that latency spans forty-eight hours. In a deflected team of sixty working on an identical codebase, latency expands to six weeks, consumed by staging approvals, security waivers, and architecture reviews.
The delta between those durations represents capital diverted into organizational friction.
Discomfort at the organizational boundary marks where active computation occurs rather than procedural retrieval.
Deflection decreases only when leadership constrains team size instead of expanding capital expenditure.

Mark

Correcting the Trajectory
Reversing deflection requires firm boundaries around operational capital. Scaling organizations maintain stability by fixing strict ratios between production capacity and coordination overhead. When coordination overhead crosses thirty percent of available hours, halting headcount expansion forces the system to address handoff bottlenecks directly instead of masking them with additional labor.
Engineering payroll doubles without expanding delivery velocity.
Sub-teams shift focus to defending established scope.
Evaluating output relative to baseline reveals an organization’s latent potential: productive capacity trapped beneath defensive procedures. Reclaiming that capacity requires dismantling secondary review committees, eliminating redundant management layers, and returning primary contributors to direct contact with market interfaces. The transition creates immediate operational friction as active work replaces administrative routine.
Each additional handoff introduces systemic latency.
Enforcing a coordination ceiling below thirty percent of team capacity exposes latent production volume within twenty business days.
Operating boundaries remain firm under load.
Capital preservation in scaling enterprises depends on distinguishing operational growth from defensive insulation. When an organization measures output per dollar with mechanical honesty, administrative avoidance no longer masquerades as collaboration. Leadership strips away redundant governance layers, forces communication back to direct conduits, and aligns liquid cash strictly with market-facing execution.