
Measuring Latent Execution Boundary Drift When Dynamic State Changes Exceed Baseline Allocations
Dynamic state changes exceeding baseline allocations push execution boundaries inward, creating measurable drift along the resource consumption vector.

Gradient
In an operating system, state changes operate within fixed capacity thresholds. When workload speeds up, incoming state mutations outpace the memory and execution headroom provisioned for idle or steady cycles. The gap develops between configured capacity and dynamic throughput.
Quantifying the drift means plotting the rate of unallocated state changes against the operating boundary where computation either stalls or drops load without logging an error.
Teams usually catch this boundary shift late. It starts when dynamic variables grow while the baseline allocation sits unchanged, creating an unmonitored slide toward hard limits. Tracking the rate of that slide shows how quickly the runtime runs through its unassigned buffer.
A system running past its baseline allocation turns spare capacity into unrecorded execution debt.
The calculation works best by treating consumption as a vector rather than a static total. A raw tally shows memory used at a single point in time, but the vector captures the direction and speed of usage toward compute limits. When transactions alter state faster than background routines can reclaim space, the execution boundary pulls inward.
The gap between that original baseline and the shifting boundary is the latent drift.
Tracking this shift across execution windows shows a flat line during steady states, where allocations cover incoming mutations. Irregular workloads tip that line sharply downward, marking friction inside the execution path.
A steep downward slope across three observation windows indicates unmanaged state growth long before standard telemetry fires an alert.

Shear
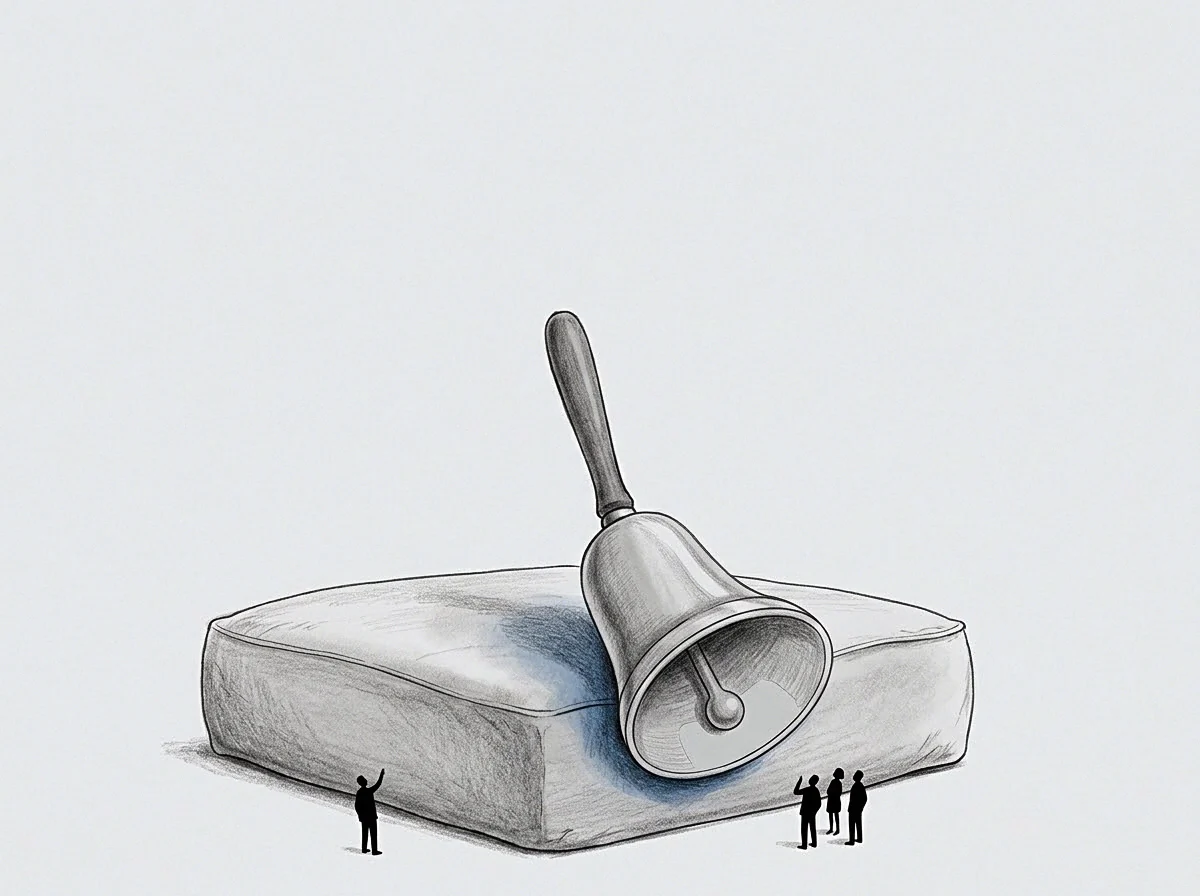
Dynamic Mutation Velocity
Systems assign memory and processing cycles based on startup configurations, but production workloads deliver erratic payloads that constantly alter internal state tables. When payload sizes fluctuate, state updates absorb unallocated compute headroom, creating operational shear against fixed baseline assumptions.
State drift builds up quietly in background routines. Garbage collectors, cache queues, and event listeners broaden their footprint to keep up with transient work. As dynamic state grows, it eats into capacity the scheduler expected foreground tasks to use, steadily narrowing the margin before stack exhaustion.
Baseline boundaries shrink in direct proportion to the volume of untracked background state changes.
Under memory pressure, systems often delay maintenance cycles. Deferred cleanups leave unprocessed data sitting in memory, pushing the operational ceiling closer to outright failure. Mapping where these cleanups stall pinpoints where state expansion is concentrating.

Mechanical Drift Vectors
Measuring this strain requires comparing provisioned resources with real state residency over time. The split between planned allocations and live operational demands appears clearly across several infrastructure layers.
| Execution Layer | Baseline Quota | Dynamic Mutation Load | Boundary Displacement |
|---|---|---|---|
| Event Bus Dispatch | 64 MB fixed buffer | 180 MB transient queue | 42 percent inward limit contraction |
| Session Cache Pool | 512 MB static pool | 1.2 GB unpruned state | 68 percent inward limit contraction |
| Transaction Journal | 128 MB ring buffer | 410 MB write backlog | 55 percent inward limit contraction |
| Worker Task Context | 256 MB per thread | 680 MB variable payload | 48 percent inward limit contraction |
Unchecked state expansion leads to silent operational failures when baseline quotas stay fixed while incoming traffic grows.

Desk

Physical Observation of Workload Realities
The monitoring screen shows all green while downstream services stall out. A founder watches queue latencies climb with no corresponding surge in CPU utilization. The contradiction sits right on the desk: one sheet reports eighty percent headroom from the scheduler, while the terminal logs worker processes crashing on out-of-memory signals.
The divergence stems from how dynamic state gets measured during traffic spikes. Standard tools watch static heaps provisioned at startup, missing the short-lived metadata tables spun up to process volatile bursts. The cost shows up directly in dead worker nodes, dropped sessions, and stalled reconciliation batches.
- Allocation Mismatch creates hidden latency corridors where background cleanup threads yield execution cycles to incoming requests.
- State Accumulation forces runtime kernels to page memory to disk, turning sub-millisecond lookups into thirty-millisecond blocking stalls across all active threads.
- Boundary Contraction reduces the safe operational window until minor traffic increments trigger cascade restarts.
An inspection of the live state table exposes the root cause: thousands of dangling references held by persistent connection handlers. The runtime kept idle sockets open to speed up reconnections, allowing dynamic socket state to absorb fifty gigabytes of unallocated memory.
Unprocessed state residue marks the exact point where an operating model breaks down.
Correcting the issue means revising allocation policies to account for dynamic state. The engineering team explains why configurations that once held steady now buckle under modest volume increases.
The original resource limits were tuned for synthetic benchmarks, not the irregular payloads produced by active production traffic.

Basin

What Alters Execution Limits Under Unallocated Load?
Variable payloads warp execution limits by forcing the system to retain sprawling state trees outside configured buffers. Once state mutations outstrip baseline reservations, the runtime falls into a performance basin where cycles spent traversing swollen index trees subtract directly from the throughput available for incoming tasks.
The mechanics of this basin show up in state density curves. As density increases, graph traversal times rise non-linearly. A binary tree with ten thousand elements sits neatly in processor cache lines; at one hundred thousand dynamic elements, it spills into main memory, multiplying access latency by orders of magnitude.
- Index Bloat pushes lookup latency past configured transaction timeouts.
- Buffer Overflow Routing diverts overflow items into secondary persistence layers, increasing serialization overhead.
- Garbage Collection Thrashing consumes ninety percent of processing capacity attempting to free short-lived allocation wrappers.
- Total Boundary Collapse halts thread execution when heap allocations hit hard system limits.
Tracking this progression involves plotting unallocated memory growth against task completion times. The slope shows whether the runtime can recover equilibrium or if it will starve for resources. A steadily rising curve confirms that live mutations have outpaced the baseline design.
Explicit retention limits turn uncontrolled state growth into predictable load shedding.
The question is how far runtime state can grow before background compaction introduces more latency than deferred processing saves.

Span

Calibrating Dynamic Execution Thresholds
Resetting execution boundaries requires continually adjusting baseline allocations against observed mutation spans. Fixed limits set at startup fail under production workloads with shifting state densities. The fix replaces static partitions with dynamic thresholds tied to real-time state velocity.
A rolling observation window governs this adjustment. When dynamic state outgrows baseline allocations by thirty percent across three consecutive intervals, the runtime recalculates its operating boundary. This rebalancing prevents unmonitored state from eating up headroom by scaling memory limits upward and throttling incoming mutations.
Applying backpressure protects system stability by capping active state volume. Incoming payloads wait or get rejected until maintenance threads purge stale transient data, trading peak ingress rates for consistent internal stability.
Once the dynamic reallocation threshold trips, the runtime immediately provisions forty percent more heap capacity for transaction metadata tables, extending the operating boundary before worker threads fail.