
Quantifying Structural Capital Friction At The Boundary Of Latent Enterprise Return Capacity
Enterprise return capacity degrades when structural capital friction diverts operational energy into uncodified procedural workarounds.
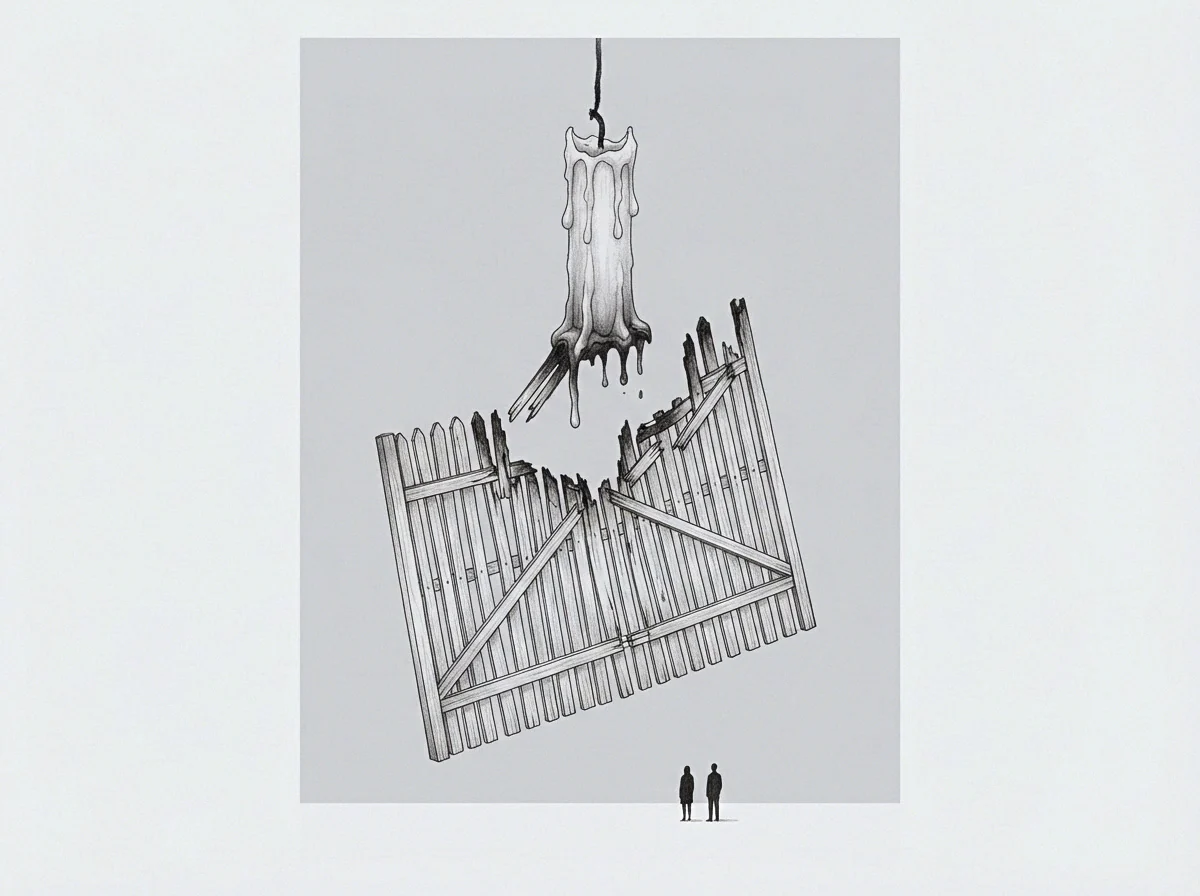
Yield
Enterprise capital allocations frequently expand while realized productivity stays flat. Commitments to software, manuals, and organizational architecture are meant to raise baseline return ceilings, yet output measures routinely fall short of theoretical limits. Operational friction consumes effort before asset potential ever reaches execution layers, generating resistance wherever codified rules meet daily work.
Asset accumulation generates return capacity that remains dormant if organizational pathways enforce high transaction costs on routine tasks. Structural assets, including software, proprietary databases, and operational governance models, are built to streamline throughput. Friction sets in when using these assets requires manual intervention, redundant approvals, or parallel documentation routines across divisions.
Measuring this friction starts by establishing the baseline transfer function between invested capital and realized operational velocity. When a system requires increasing capital resources to sustain constant transaction volume, internal resistance is escalating. The gradient of realized returns against asset density defines efficiency at the capital boundary; a flat slope indicates that additional structural investments are being absorbed by systemic drag rather than generating incremental capacity.
Organizations naturally route around uncodified knowledge gaps. Staff build informal channels to bypass rigid systems that slow daily throughput, concealing the true magnitude of systemic friction and masking structural failure under employee effort. Return capacity remains unrealized because structural assets operate below design specifications while labor bridges the deficit.
The gap between theoretical and actual returns widens as operational scale grows. Expanding scale multiplies boundary interfaces between units, compounding friction points. The key metric for organizational throughput remains the ratio of friction loss to total capital velocity across major asset divisions.
This dynamic leaves open whether an enterprise can accurately isolate friction costs without altering the operational environment during measurement.

Valve
Internal flow regulation determines how effectively structural assets convert into operational velocity. Information and authority pass through organizational choke points that calibrate execution speed across departments. When these control points enforce excessive verification rules, throughput slows and capital friction rises, accumulating unprocessed operational load at every administrative junction.
Structural friction manifests across distinct operational dimensions within an enterprise. Each dimension imposes specific energy penalties on capital assets attempting to generate returns.
- Administrative Duplication Vectors originate when overlapping governance protocols force redundant compliance reporting across parallel management tiers.
- Tacit Knowledge Disconnects occur when procedural manuals fail to capture actual execution requirements, forcing workers into time-consuming informal consultations.
- Legacy System Drag emerges where historical software architectures fail to interoperate natively, requiring manual data re-entry and custom transformation scripts.
- Approval Velocity Deceleration develops when decision rights remain centralized in remote executive seats while operational velocity requires localized resolution.
Quantifying these friction points requires isolating the velocity loss at each structural transition. The time elapsed between decision triggers and execution completion serves as a raw indicator of administrative drag. When delay scales exponentially with organizational height, structural friction dominates execution dynamics.
Systemic drag expands to fill the space between formal process rules and actual operational habits.
Friction accumulates where enterprise rules prohibit direct horizontal coordination across unit boundaries, letting systemic design dictate throughput limits.

Conduit
Transfer pathways carry organizational assets from strategic planning into daily execution. High friction along these pathways converts potential returns into administrative overhead. An enterprise operating with degraded transfer channels displays high baseline costs alongside stagnant market delivery speed.
The volume of unspent capacity sits locked behind structural barriers.

Can Capital Reallocation Resolve Internal Execution Friction?
Injecting additional capital into high-friction structures accelerates resource consumption without increasing realized throughput. Consider an enterprise operating a primary enterprise resource management platform alongside three legacy units acquired over five years. Assume the executive committee commits twenty million dollars to software upgrades to improve enterprise-wide reporting speed, but underlying data definitions across units remain unaligned, requiring thirty manual spreadsheet reconciliations every month before financial aggregation occurs.
The capital injection expands the asset base on the balance sheet. Realized return capacity remains unchanged because those manual reconciliations form an uncodified friction layer that throttles data velocity. Energy routes around the automated pipeline into manual processing, leaving the new software as a high-cost storage vessel while execution speed depends entirely on manual labor.
- The initial capital deployment increases theoretical enterprise capacity while leaving internal friction boundaries unmapped.
- Operational teams encounter structural mismatches and construct manual workarounds to preserve basic transaction delivery schedules.
- Management reads initial transaction completion as proof of systemic health, ignoring the labor hours consumed by informal workarounds.
- Cumulative friction costs erode return margins, prompting demands for secondary software allocations that repeat the failure loop.
Evaluating this sequence from the operator side reveals a structural imbalance. Operating staff expend discretionary capacity resolving system collisions rather than executing high-value commercial work, leaving potential capacity embedded in the asset dormant.
Uncoded operational workarounds convert dynamic capital assets into static administrative liabilities.
Friction persistence forces enterprises to maintain redundant staffing levels to cushion against procedural execution failures.
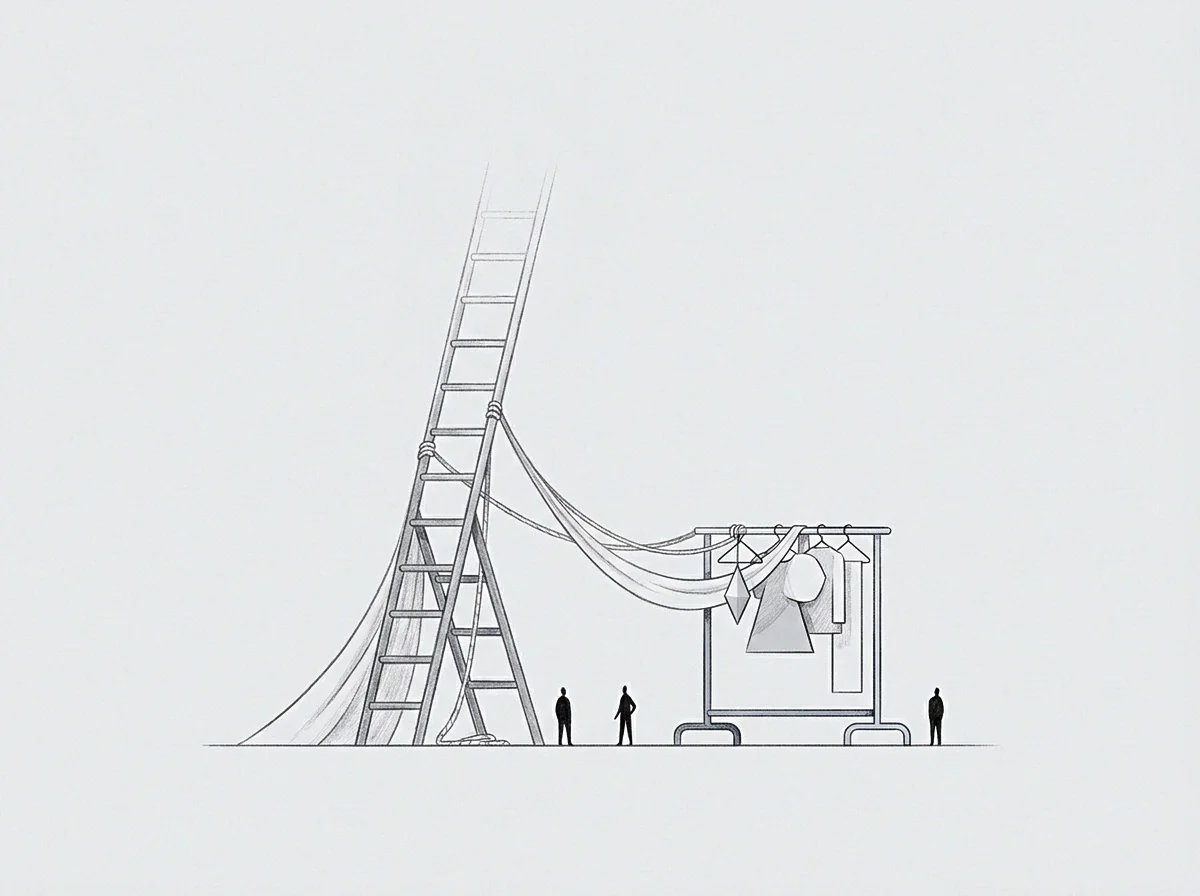
Metric
Quantification of structural capital friction demands explicit measurement instruments capable of isolating procedural resistance from market variance. Comparing friction levels across operational layers provides a clear profile of systemic enterprise drag.
| Operating Layer | Friction Indicator | Primary Resource Sink | Capacity Degradation Type |
|---|---|---|---|
| Governance Layer | Multi-tier approval loops | Executive attention hours | Strategic inertia and delayed positioning |
| Data Layer | Manual schema translation | Engineering operational time | Information latency and high error rates |
| Execution Layer | Uncodified procedural bridges | Frontline labor capacity | Sub-optimal throughput and high turnover |
| Asset Allocation Layer | Rigid budget boundaries | Unspent working capital | Misaligned returns and stagnant growth |
The math of structural friction maps directly to energy loss in physical systems: energy inputs divided by effective output yield the coefficient of internal drag. When the coefficient exceeds established baseline standards, capital allocation efficiency drops precipitously.
Friction measurement requires continuous tracking of baseline operational cycles. Variance from theoretical processing speeds reveals hidden procedural costs, which executives often interpret as inevitable operating realities rather than structural defects requiring remediation.
The cost vector of internal friction displays continuous upward drift unless structural boundaries undergo explicit redesign.
The system works as designed, even if the result produces zero net margin after friction deductions.

Limit
Operational boundaries define the outer edge of enterprise performance. Beyond this perimeter, internal friction equals total input energy, preventing further capacity realization. Pushing an enterprise past its structural boundary without resolving friction causes rapid operational degradation and administrative failure.
The boundary wall consists of accumulated procedural debt, rigid institutional designs, and unmapped tacit knowledge dependencies. Systems hit this wall when throughput demands exceed the structural capacity of internal channels. Discomfort within management ranks signals that organizational throughput has reached the current structural limit, requiring computation rather than simple routine execution.
Remediating structural capital friction involves mapping avoidance vectors, identifying informal workarounds, and codifying tacit operational knowledge into clear structural assets. Reducing boundary friction unlocks latent enterprise return capacity, restoring alignment between capital commitments and realized economic yield.
The boundary friction coefficient changes when decision rights shift to the precise operational coordinates where local knowledge originates.