
Quantifying Latent Operational Capacity Across Deflected Execution Gradients
Operational capacity remains latent when teams deflect down low-friction lateral paths, leaving an unspent volume calculable by decomposing the diverted vector.

Drift
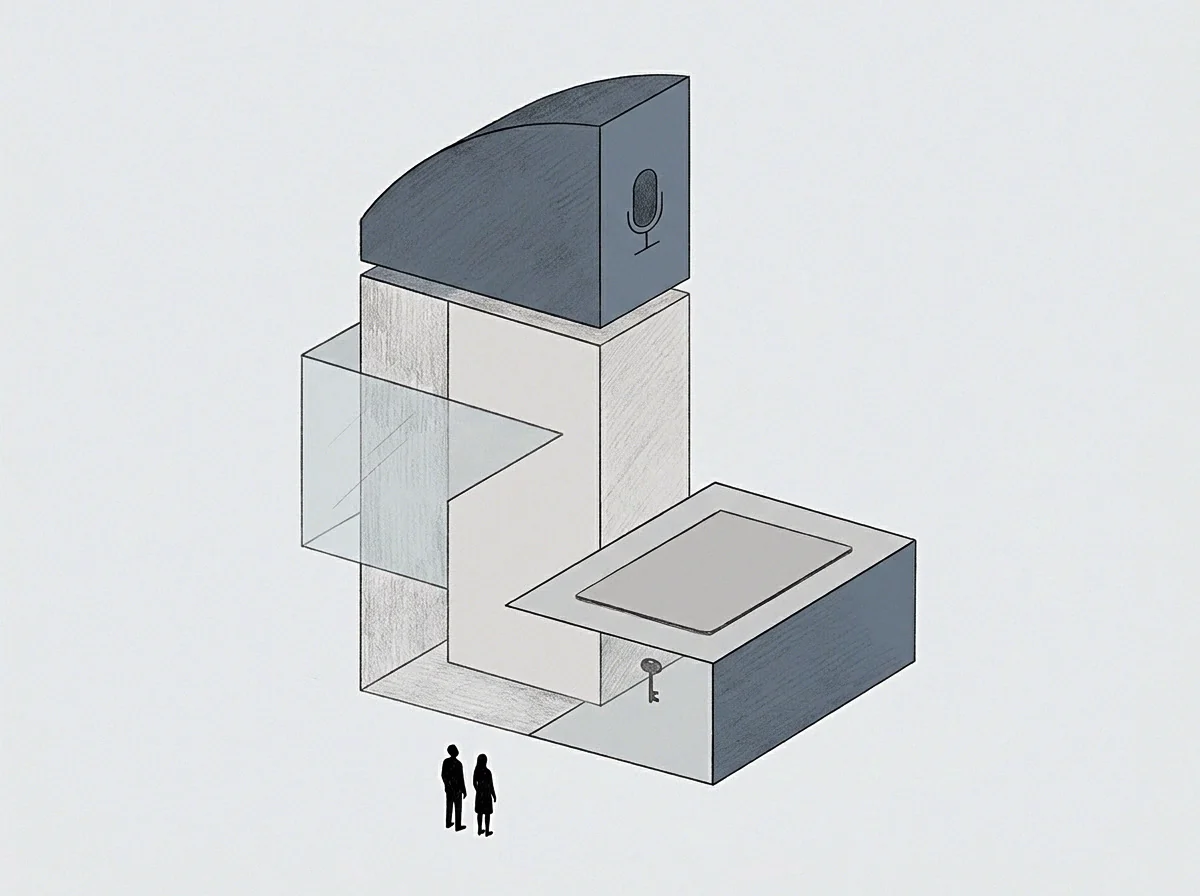
Direct Vector Displacement Across Consecutive Cycles
An operator tracks four consecutive quarters where delivered output drifts away from the operational baseline. The delivery schedule registers as complete, yet each deployment veers sideways into maintenance tickets, internal tooling tweaks, or documentation written defensively. Revenue stays level.
Headcount remains constant. The operation runs warm, but the core target slips deeper into the backlog as secondary tasks fill the available capacity.
The vector of intended work and the vector of actual output diverge at a measurable angle, reflecting lost operational drive. Human systems running off-course burn their reserves against internal friction. Along any operational path, the gradient measures value generated per unit of operational cost spent.
Direct execution follows the steepest ascent up that value surface. Deflection happens when an organization takes an easier lateral contour, dodging the heavy friction of ambiguous customer requirements, brittle core architecture, or an unresolved dispute over ownership. Activity continues, but elevation above the baseline stays flat.
A persistent lateral deflection in execution velocity marks the presence of an uncomputed cost along the direct line of ascent.
Quantifying the operational capacity trapped inside these deflected gradients requires measuring the spread between the path of least resistance and the intended path of value capture. Latent operational capacity represents the unspent volume of execution recovered when deflected output is projected back onto the primary vector. This capacity consists of actual attention, engineering hours, and capital expenditure currently consumed by deflection routines.
A software team avoids rewriting a failing billing engine by spending six months building automated reconciliation scripts around it. Those scripts promptly require ongoing maintenance, on-call rotations, and bespoke telemetry. The energy poured into holding that workaround together matches the capacity that could resolve the core failure.
Once the deflective gradient is measured, the operator isolates the exact volume of work freed for redeployment.
Meetings multiply precisely when delivery commitments approach execution milestones.
Contour
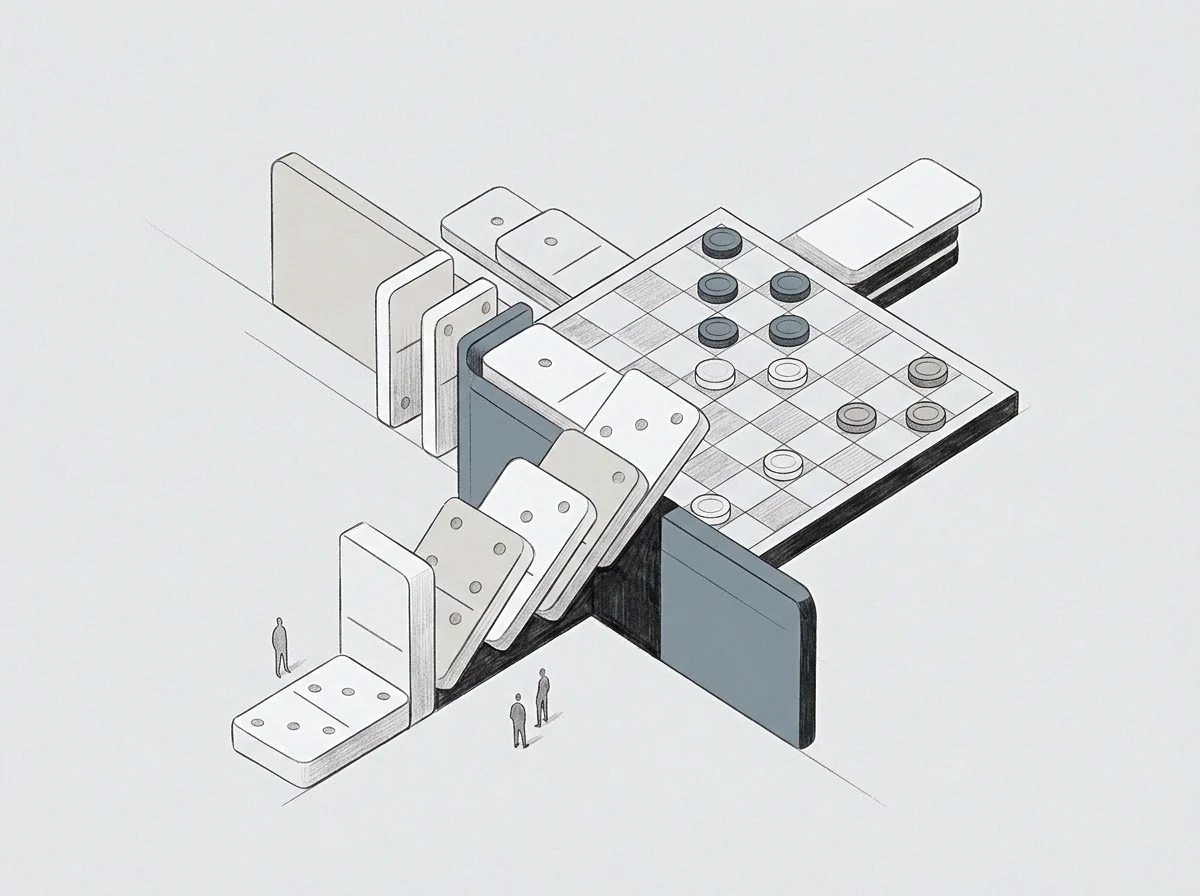
Topography of the Operational Cost Surface
Every business operates across a multidimensional cost surface where every coordinate reflects an allocation of capital, technical effort, and structural attention. The value axis runs perpendicular to this terrain, and movement across it meets variable friction based on the local slope. Formal optimization models assume an agent climbing toward a global maximum through gradient ascent.
In practice, operators routinely substitute local cost reduction for value generation, following the steepest drop in immediate friction instead of the steepest climb in value.
Deflected gradients form where immediate operational friction is steep and long-term political friction is flat. If tackling market validation demands direct interpersonal conflict or exposed risk of failure, the local slope feels punishing. Building an internal simulation, by contrast, carries almost no immediate social cost.
The organization slides into that low-friction trough, settling over several cycles into a stable, unproductive orbit around the original objective.
The structural anatomy of this deflection shows up across three operating modes:
- Direct Ascent Trajectory maintains complete alignment with core value capture while absorbing the immediate execution strain of each operating cycle.
- Lateral Deflection Contour expends energy along paths of internal comfort that produce negligible vertical gain on the value axis.
- Compensatory Orbit State generates procedural complexity to explain the widening spread between expended capital and realised output.
Avoidance serves as an exact coordinate marker. What an organization works around defines the outer edge of its current operating model, and the secondary work built to shield the team from that issue outlines the perimeter of its latent capacity.
A founder hesitant to raise contract prices builds elaborate cost-cutting dashboards to protect operating margins. Facing customer pushback carries social friction, whereas building spreadsheets requires only cognitive effort. The hours spent recalculating margins mirror uncaptured commercial pricing power, and tracking that defensive labor shows the capacity tied up in the workaround.
Leave an operational constraint unaddressed for six months, and the organisation tends to build an entire management layer just to navigate around it.
Split
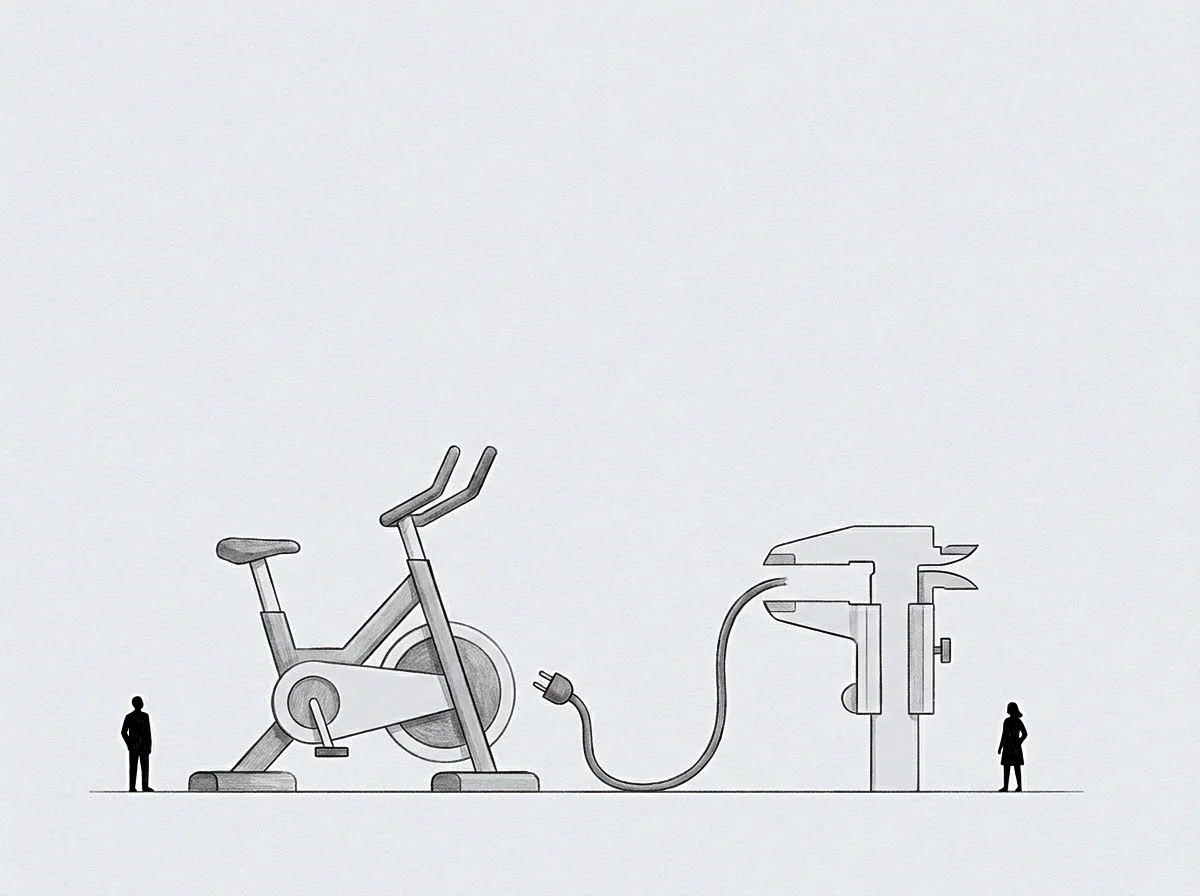
Comparative Mechanics of Aligned Versus Deflected Operating States
Distinguishing direct execution from deflected drift requires comparing operational metrics under matched conditions. As execution drifts, its profile shifts predictably across capital velocity, cycle completion, and diagnostic friction.
| Evaluation Parameter | Direct Ascent Execution | Deflected Execution Contour | Diagnostic Marker |
|---|---|---|---|
| Primary Velocity Vector | Collinear with value capture | Orthogonal or lateral to value capture | Displacement ratio per sprint |
| Variance Absorption | Absorbed through iterative core adjustment | Absorbed through secondary administrative buffering | Growth rate of internal tooling backlogs |
| Friction Location | External boundary contact with reality | Internal boundary contact between teams | Ratio of external feedback to internal coordination |
| Unspent Operational Volume | Zero or minimal residual capacity | High latent volume trapped in mitigation loops | Capacity recovered upon barrier removal |
Total energy expenditure across both regimes remains roughly equivalent. An organisation caught in deflected execution does not idle; it operates at high internal velocity. The loss comes entirely from the direction of the work relative to the value axis.
Expended operational energy remains invariant while output velocity decays in direct proportion to the angle of execution deflection.
Evaluating this diversion requires treating cost as an ordinal vector rather than a cardinal accounting figure. Cardinal figures like monthly payroll or infrastructure invoices capture gross spend, but they register nothing about directional deviation. The ordinal vector tracks the operational tax: lost market tempo, diminished team agency, and accumulated technical inertia.
A company can post clean cardinal financial efficiency while remaining paralyzed along its execution gradients.
Detecting whether a secondary initiative is functional deflection requires examining how the organization handles structural obstacles.
When a stated priority hits a blockage in an aligned team, work halts until the barrier is dismantled. In a deflected team, staff route around the blockage within hours, constructing a peripheral project to absorb available time. The speed of that diversion indicates the volume of capacity ready to be redirected.
A vendor promises delivery within thirty days yet spends forty-five days refining the reporting template before writing the first line of production code.
Basin
Local Minima and the Structural Cost of Ascent
Systems settled into deflected gradients occupy local minima on the cost surface. In these positions, any immediate move in any direction increases friction, even though substantial value sits higher up the slope. The basin holds an organization in place because people feel local resistance rather than the broader landscape.
Climbing out demands facing immediate, unbuffered friction—the required activation energy.
Take an enterprise software firm run by two co-founders, with twelve engineers and four hundred thousand dollars in remaining capital. The core product has data-ingestion latency that turns away prospective enterprise buyers. Addressing the latency means rebuilding the ingestion pipeline from scratch, an effort involving serious uncertainty and an estimated six weeks without visible feature progress.
The direct climb is demanding and carries clear risk.
Instead of overhauling the pipeline, the team launches four peripheral projects: an analytics export tool, a dark-mode interface, a compliance checklist module, and an automated feedback collector. With each project absorbing three engineers for six weeks, twenty-four engineer-weeks of capacity are consumed. The product remains unsellable because the latency bottleneck persists.
The cardinal cost comes to seventy-five thousand dollars of engineering payroll; the ordinal cost is six weeks of runway spent without improving the company’s survival odds.
The seventy-two engineer-weeks absorbed by secondary modules represent the latent capacity tied up in that deflection. That labor was spent keeping up visible activity. Halting feature work to fix the ingestion core would have cost the exact same engineering hours, but the expenditure would have moved directly along the value gradient.
The unspent volume of a deflected operation matches the scale of its workarounds. Sizing the duration, staffing, and scope of those diversions gives an operator the real capacity available for primary execution.
When an operating model leaves the central commercial barrier uncalculated, promotions and quarterly roadmaps simply reinforce the perimeter of the basin.
Room
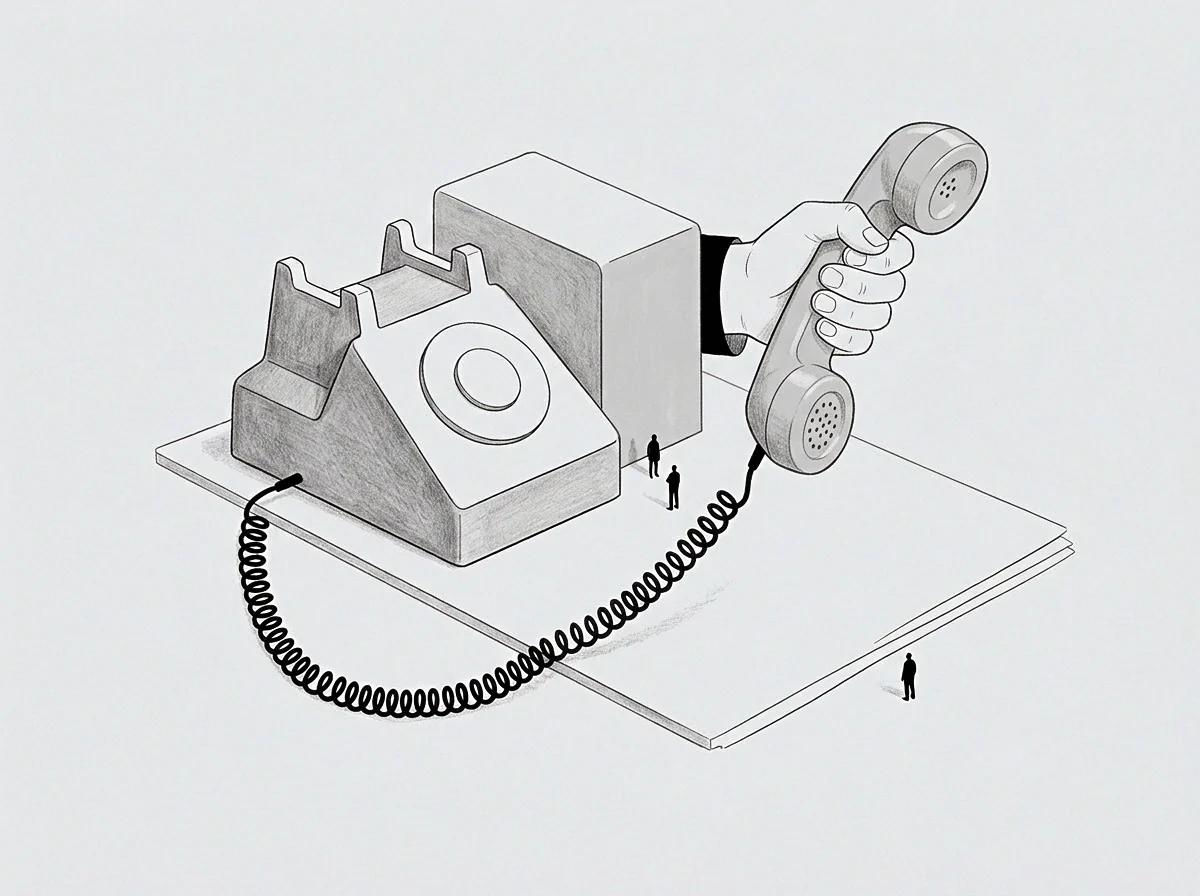
Physical Containment of Compensatory Coordination
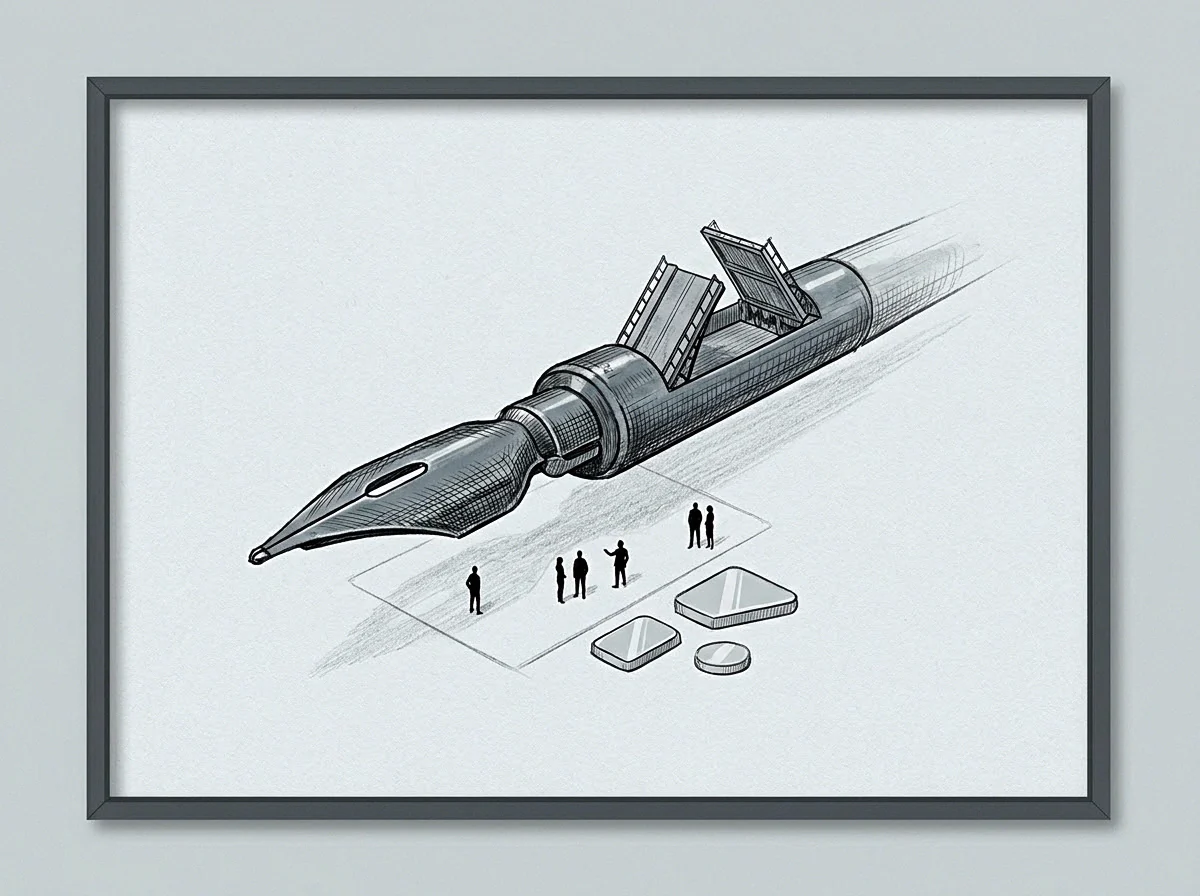
An organisation running on a heavy deflection gradient mirrors that retreat in its meeting spaces. Whiteboards fill with tiered workflows, governance checkpoints, and review gates. An issue two people could settle by testing an interface against reality instead draws fourteen attendees into an extended meeting.
The room functions as a baffle, softening external feedback before it can disturb the local minimum.
Meetings expand to fill the calendar space abandoned by direct execution. A standard control loop uses an error signal, the gap between desired setpoint and current state, to drive corrective action. In deflected execution, the organization dampens that sensor.
Instead of letting direct user rejection reach engineers, management places an intermediary layer of product strategists in between to interpret, soften, and catalog feedback into generalized summaries.
This buffering carries clear costs in operational attention and structural delay. The pattern recurs consistently across scaling operations:
- Sensor Insulation places administrative layers between core technical teams and raw performance data.
- Ritualised Coordination substitutes recurring consensus sessions for individual accountability on critical paths.
- Artifact Proliferation prioritises specifications, briefing decks, and alignment memos over shipped functional software.
- Boundary Reinforcement penalises informal cross-functional fixes in favor of departmental sign-offs that protect internal status.
These coordination habits stem from structural defense rather than staff disengagement. They bleed off the operational energy the organisation avoids committing to the main problem. A team carrying fifty hours of execution capacity per person per week cannot sit idle without tension; if internal risk aversion blocks that effort from the primary objective, the energy burns off through compensatory coordination.
The trapped capacity shows up as fatigue without output. Teams leave sessions depleted from the friction of defensive protocols rather than the productive strain of solving technical problems.
When primary problems cannot be confronted directly, preparation expands to fill the void.
Projection
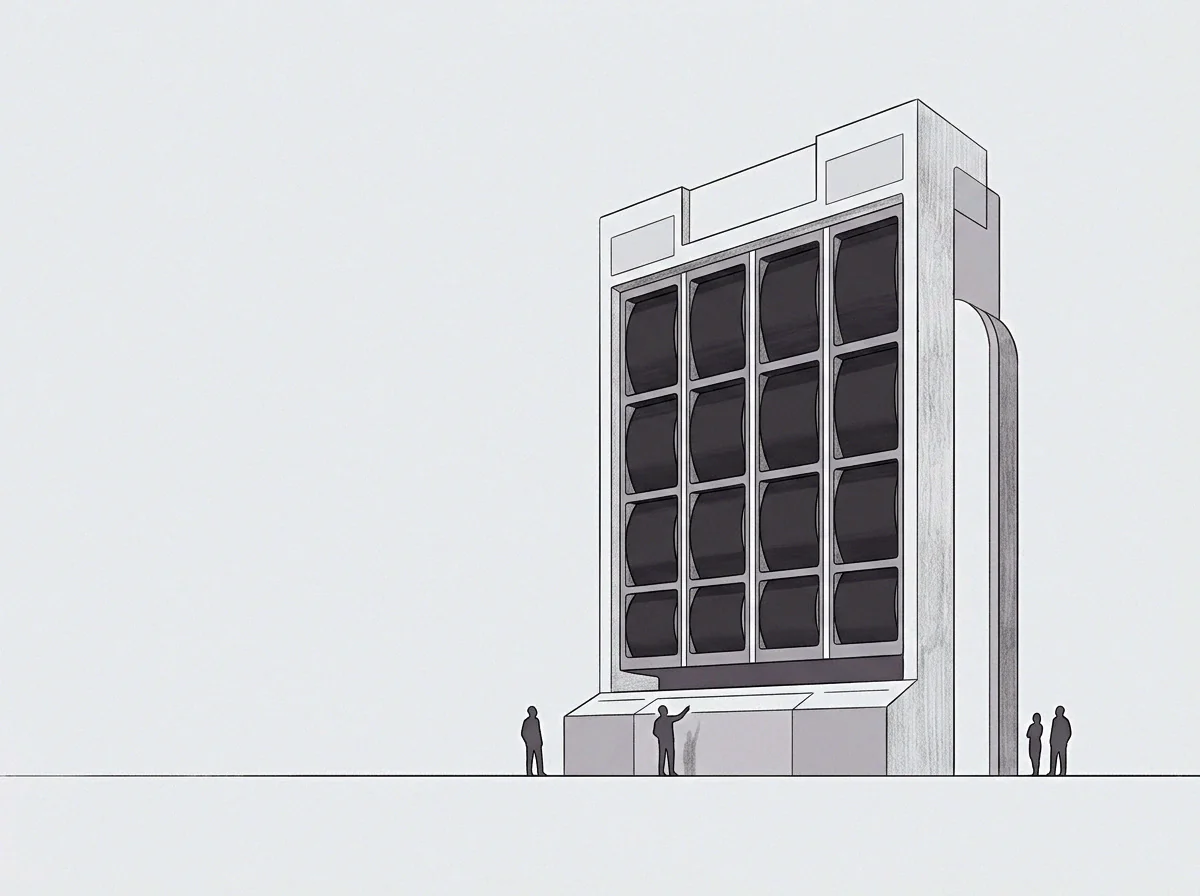
Vector Decomposition and Quantitative Recovery of Capacity
Calculating latent capacity involves projecting the deflected execution vector back onto the primary value axis using standard vector decomposition. Let total expended operational energy be vector E, oriented at an angle theta relative to the value gradient V. Forward velocity along that axis follows the projection:
V_eff = |E| cos(theta)
When execution aligns directly with value capture, theta equals zero, cos(theta) equals one, and expended effort turns directly into progress along the value axis. As deflection widens and theta approaches ninety degrees, cos(theta) falls toward zero. The organisation burns energy (|E|) while vertical progress stops.
The orthogonal component accounts for the diverted effort:
E_deflected = |E| sin(theta)
This orthogonal force is absorbed into compensatory overhead. The latent operational capacity equals exactly E_deflected, representing the volume of effort that becomes immediately available for primary work once theta returns to zero.
Latent capacity equals total expended energy multiplied by the sine of the execution deflection angle.
Harvesting this latent capacity does not require injecting capital, adding headcount, or running internal campaigns. Those moves only enlarge |E|, which accelerates compensatory overhead whenever theta remains wide. The operator focuses entirely on narrowing theta by identifying the obstacle driving the deflection, accounting for its cost, and steering work directly through it.
On an assembly line, a tolerance error causes downstream operators to file down parts by hand before fitting them into place. That filing is lateral effort. Instead of hiring faster filers, the plant manager stops the line, realigns the stamping die, and eliminates the workaround.
The filing hours immediately convert into direct assembly capacity.
The dynamic is identical across software, hardware, and operational design. Stripping out secondary initiatives, shutting down defensive coordination routines, and pointing the team at the core constraint surfaces that latent capacity immediately. The recovery is prompt, requires no new budget, and holds until a new avoidance pattern emerges.
Tolerating a deflection angle wider than forty-five degrees across two consecutive quarters allows defensive tooling to harden into permanent architectural overhead that outlasts the founding team.