
Quantifying Operational Data Loss Across Reporting Tiers
Operational data loss across reporting tiers is quantified by computing the entropy divergence between raw event distributions and smoothed summary metrics.
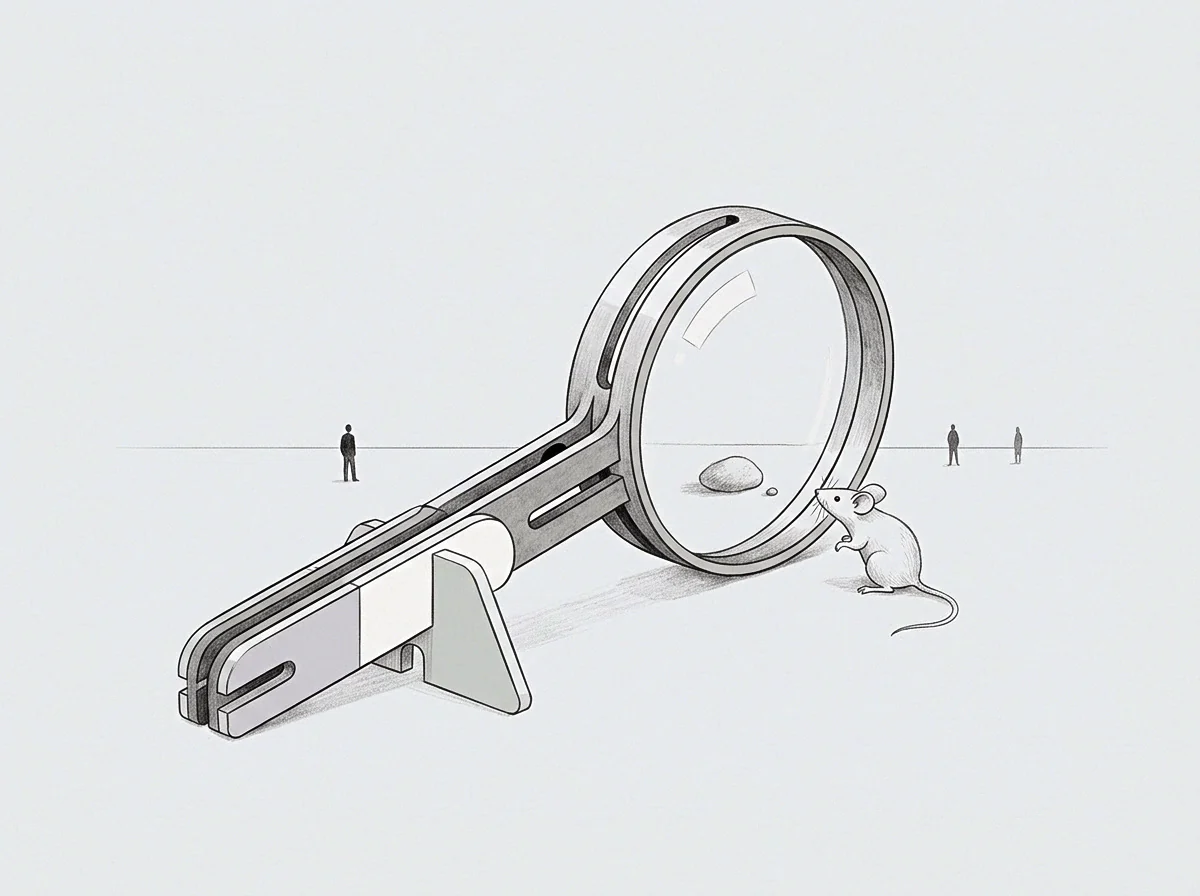
Sieve
A production log recorded seventeen thousand micro-stoppages across thirty days. The operational summary delivered to the vice president of manufacturing reported zero minutes of unplanned equipment downtime. That disparity represents an engineered loss of physical reality during upward transmission.
When raw telemetry leaves a machine controller, the data stream possesses high variance, localized timestamp clusters, and immediate physical context. The first administrative filter removes the micro-events below three minutes duration, categorizing them as routine process variability. Subsequent filters average cycle times over eight-hour operational shifts, removing variance and clipping anomalous peaks.
By the time machine performance appears on an executive summary card, three successive translation layers have destroyed the statistical tail distributions where systemic failures originate.
Each tier in an operational hierarchy functions as a selective filter designed to conserve computational bandwidth and managerial attention. The operator at the line monitors sensor volatility directly. The plant supervisor monitors shift averages.
The vice president monitors monthly capital utilization. Information loss along this ascent is predictable, directional, and mathematical. Operational data undergoes three primary forms of structural destruction during administrative translation:
- Arithmetic Smoothing eliminates local volatility by replacing raw time-series dispersion with aggregate mean values, hiding intermittent equipment stalls within acceptable performance distributions.
- Categorical Coarsening strips domain-specific fault codes down to generic corporate bucket labels. An exact spindle bearing race oscillation becomes an unspecified vendor maintenance variance.
- Threshold Censoring discards any variance event falling beneath an arbitrary reporting duration. Micro-failures that occur fifty times per shift vanish from the record entirely.
Data reduction methods in corporate architectures mirror standard downsampling techniques in signal processing. Downsampling without an appropriate low-pass filter produces aliasing, where high-frequency operational turbulence masquerades as stable low-frequency process control. The engineering baseline deteriorates silently while the summary metric shows steady state operation.
A supervisory layer removes operational friction from records whenever reporting that friction triggers uncompensated inspection tasks.
The shop floor supervisor does not report every micro-stoppage because documenting an event requires ten minutes of digital clerical entry for a stoppage lasting forty seconds. The operator adjusts the guide rail with a brass wedge, clears the jam, and resumes cycle speed. The transaction completes entirely outside the formal information architecture.
In this manner, human intervention covers the gap between theoretical operating envelopes and mechanical wear. The administrative layer above perceives perfect line stability precisely because unrecorded manual labor absorbs all physical oscillation. The reporting artifact presents an operational baseline that is mathematically fiction.
The machinery runs within acceptable boundaries until the operator steps away from the station.
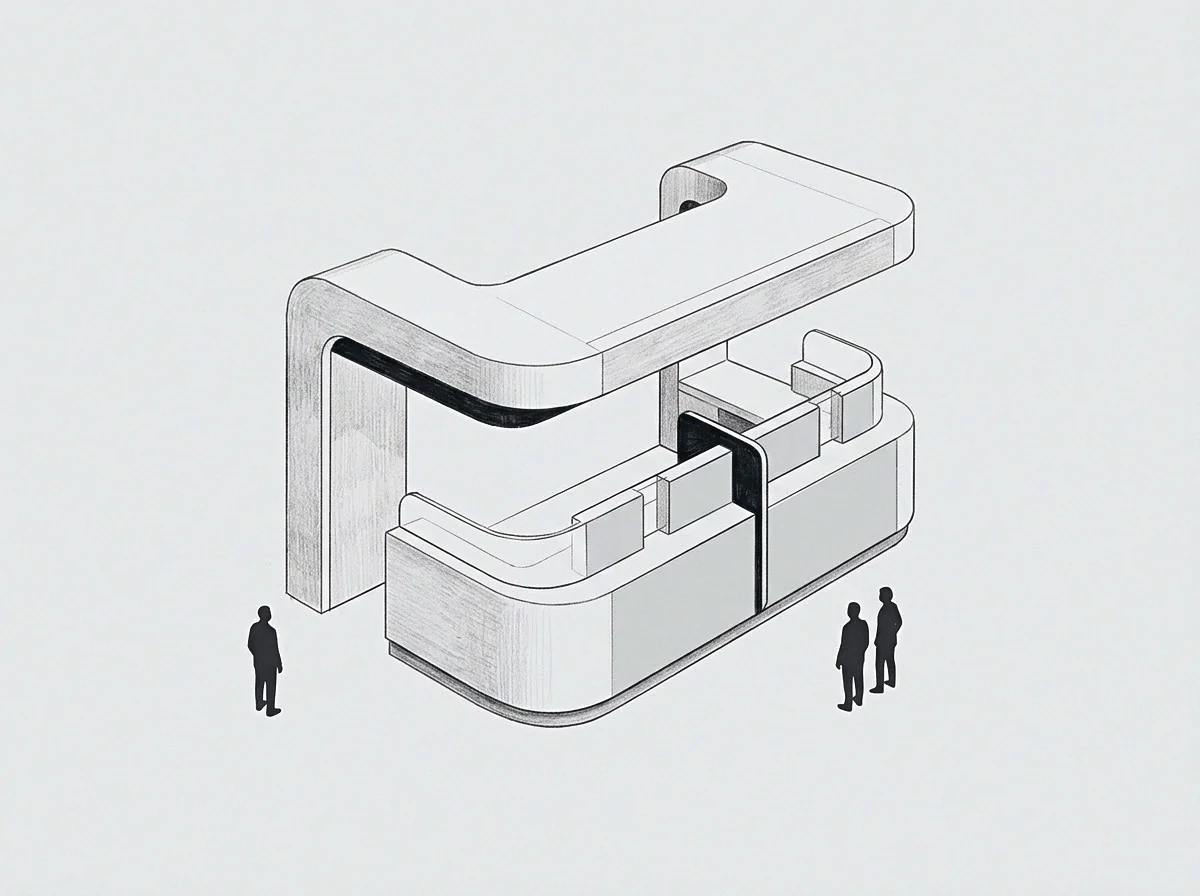
Slope
Quantifying information degradation across operational tiers relies on measurement theory and statistical divergence. When an operational tier condenses raw discrete event counts into continuous departmental averages, it discards higher-order statistical moments. Skewness and kurtosis carry the early warning indicators of systemic stress.
A normal distribution assumption applied to operational event logs hides fat-tailed risk profiles behind reassuring means.
The loss of fidelity between the raw observation space and the condensed reporting space is measured directly through relative entropy, mathematically defined as Kullback-Leibler divergence. Let the ground-truth operating states at the physical layer be represented by a probability distribution across failure modes and execution latencies. As telemetry ascends through supervisory databases and enters divisional management summaries, the original distribution undergoes compression into an aggregated model distribution.
The divergence value records the exact volume of structural information eradicated by the reporting filter.
| Reporting Tier | Data Resolution | Moment Retention | Primary Mathematical Loss | Divergence Magnitude |
|---|---|---|---|---|
| Field Telemetry | Milliseconds | All moments intact | Zero operational loss | Baseline null |
| Shift Supervision | Hourly aggregates | Mean and variance | Loss of kurtosis and skew | Moderate divergence |
| Plant Operations | Daily summary | Mean values only | Complete loss of variance | High divergence |
| Executive Dashboard | Monthly composite | Binary threshold indices | Complete distribution erasure | Maximum divergence |
Relative entropy increases monotonically with every reporting tier that sits between the physical asset and the budget allocator. An operator measures a physical quantity with continuous dimensions. The supervisor converts that quantity into an ordinal ranking of shift effectiveness.
The executive receives a cardinal budget variance percentage. Each transformation lowers the measurement scale, stripping the operational data of its predictive capacity.
A metric loses predictive capacity when its measurement scale shifts from physical dimensions to administrative indices.
Loss of higher-order moments creates an artificial gradient of stability. To a plant manager reviewing thirty-day rolling means, the operational terrain appears smooth and gradual. The actual physical asset experiences violent impulse loads, mechanical chatter, and thermal spikes that threaten structural failure.
The reporting slope flattens while physical friction accumulates at the base.
Operational stability reported at the top of a hierarchy masks mechanical volatility at the bottom.
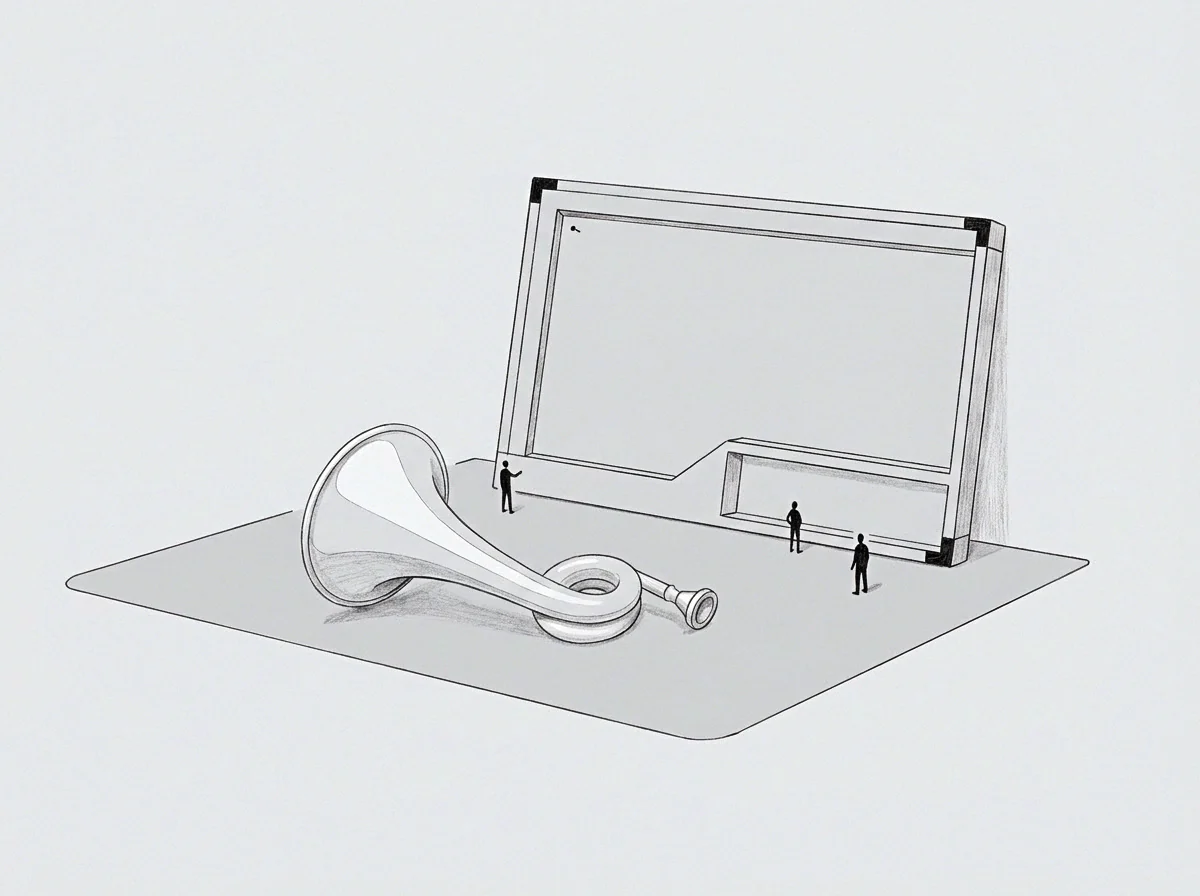
Mirror
Every operational system preserves an unspent volume of corrective capacity. When upward communication compresses data, it creates an inverse distortion field. The negative gradient of operational fidelity downward generates an equivalent latent cost upward.
What line workers route around on the shop floor represents unquantified corporate risk. This hidden friction acts as a mirror to formal reporting.

What Preserves Operational Fidelity Under Layered Condensation?
Direct mathematical preservation of operational fidelity requires retaining distributional bounds rather than aggregate averages. Standard enterprise systems compress data by computing arithmetic means across arbitrary time windows. Preserving operational reality across tiers requires passing non-parametric distribution summaries, such as quantile sketches and Pareto tail exponents, directly to executive repositories without intermediary human editing.
The t-digest algorithm allows distributed systems to retain extreme percentiles accurately without storing petabytes of raw high-frequency telemetry. This mathematical architecture ensures that rare, catastrophic impulse events remain visible to decision-makers.
Engineers often dispute whether human filtering protects organizations from noise or blinds them to structural drift. One position treats managerial filtration as an indispensable computational buffer that protects executive capacity from raw sensor volatility. The competing position views every human redaction tier as an agency barrier that conceals localized deterioration to preserve operational comfort.
Empirical studies in aviation safety records and hospital clinical handoffs confirm that programmatic distribution retention uncovers early-stage degradation months before conventional summary metrics shift.
An unchecked data filter converts physical degradation into sudden catastrophic failure.
Consider an automated logistics facility operating four hundred conveyor drives. Assume the field sensors log intermittent motor current draws exceeding twenty amperes for three hundred milliseconds, occurring four times daily per drive. The plant monitoring tier averages electrical current across fifteen-minute intervals.
The fifteen-minute average records a uniform eight amperes, well within safe operating limits. The executive dashboard reports green status across all drives based on power consumption metrics. Twelve months later, seventy drive motors experience stator burnout simultaneously during peak volume.
The electrical impulse data existed continuously in the controller memory. The reporting hierarchy erased the variance, preventing predictive rewiring.
How long can an organization operate on smoothed distributions before unmonitored tail variance consumes its operational reserve?

Wall
The reporting filter eventually encounters a physical limit. This wall is the boundary where administrative models shatter against accumulated physical reality. An organization builds its administrative buffers out of what it refuses to calculate.
Processing raw operational error signals requires engineering capital, schedule adjustments, and line shutdowns. Smoothing the data costs nothing in the short term. The system therefore descends along the path of least administrative resistance, eliminating error signals until the machinery seizes.
Operational data loss produces structural failure through identifiable breakdown mechanisms:
- Variance Insolvency occurs when physical shock amplitudes exceed the artificial safety margins calculated from smoothed historical averages.
- Feedback Loop Rupture severs the corrective signal pathway between shop-floor mechanics and capital allocation committees, starving degrading assets of replacement parts.
- Latency Inflation delays institutional recognition of failure until the cost of corrective engineering surpasses the asset replacement price.
Discomfort within operating teams acts as a precise measurement of computation. When an engineer argues with a plant manager about a vibrating pump that shows normal vibration scores on monthly summaries, the argument indicates that the administrative model has reached its perimeter. The metric reports compliance.
The pump housing is hot to the touch. The wall exists precisely where the digital index refuses to register the sensory reading of the human operator standing in the room.
Ignoring this perimeter guarantees that the asset forces its own shutdown on unnegotiable mechanical terms.

Cost
Calculating the true expense of operational data loss requires separating ordinal organizational discomfort from cardinal financial expense. A company incurs an ordinal loss when internal trust erodes between technicians and executive leadership. Cardinal costs arrive in replacement invoices, emergency vendor expediting fees, and regulatory penalties.
Corporate financial systems routinely track the price of replacement components while remaining blind to the multi-year latency cost of filtered operational communication.
A rigorous audit of operational data loss measures the transmission delta across every tier. The auditor samples raw controller registers at the edge and compares them against the database tables serving executive business intelligence dashboards. The ratio between the information entropy of the raw edge stream and the entropy of the executive metric establishes the data attenuation coefficient of the reporting hierarchy.
When an attenuation coefficient exceeds three orders of magnitude, executive decisions decouple completely from mechanical constraints.
Correcting this structural blindness demands an architectural contract. An executive board that requires raw quantile feeds alongside financial summaries removes the incentive for middle management to smooth uncomfortable variance. The line technician gains an unmediated channel to document physical drift, eliminating the covert contracts where operators quietly patch machinery with undocumented adjustments.
Grounding reporting architectures in mathematical distribution retention protects capital from the comforting illusion of effortless stability.
A corporate contract clause enforcing uncompressed distribution reporting across operational tiers directly restores baseline engineering visibility.