
Quantifying Engineering Throughput Loss Under Unbuffered Operational Queue Pressure
Unbuffered operational queue pressure forces repeated cognitive context switches that exponentially expand engineering cycle times and collapse throughput.
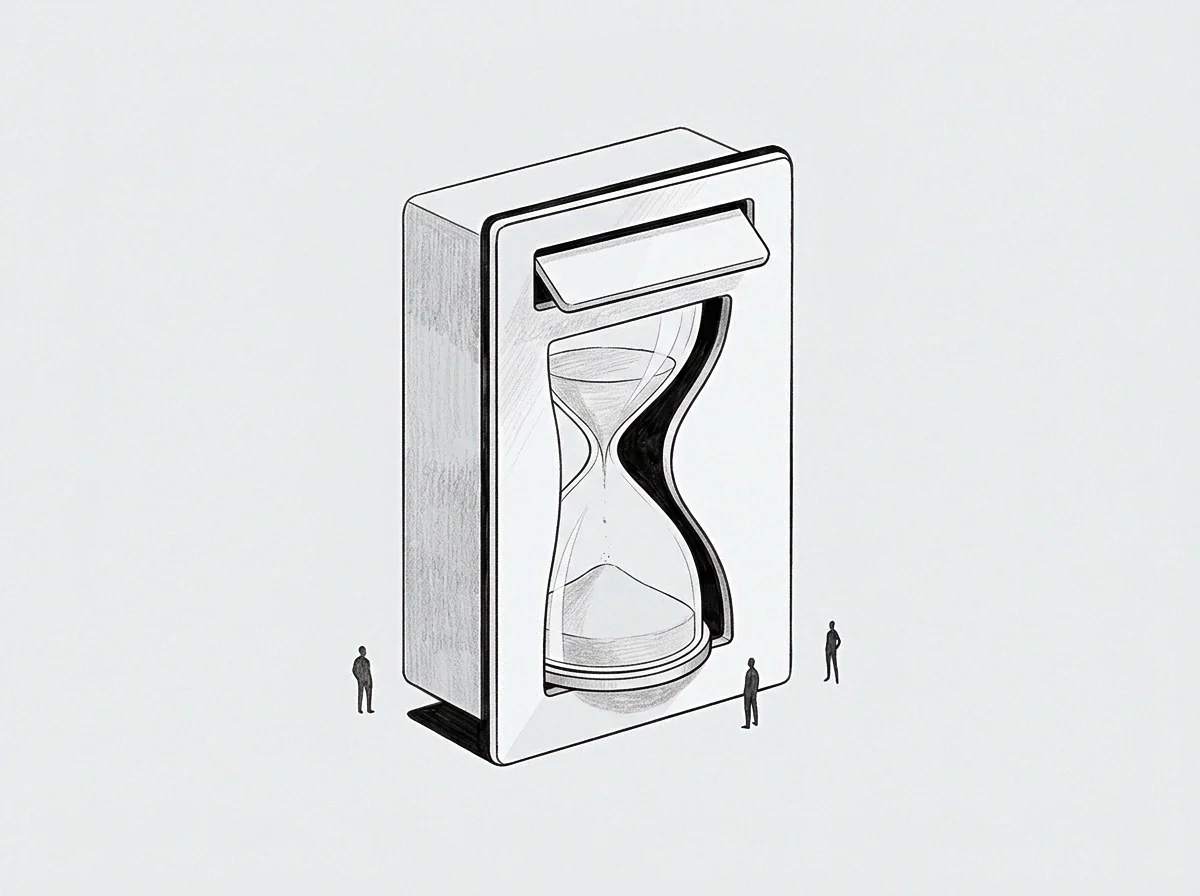
Arrival
Production engineering systems degrade when incoming operational requests arrive faster than human operators can complete them. A sudden influx of production alerts, client escalation tickets, and ad-hoc infrastructure demands consumes the raw hours of an engineering team. The direct reduction in primary product velocity follows directly from basic queueing behavior.
In an open queueing system without an admission barrier, queue length expands toward infinity as utilization approaches unity. When an engineering team operates at ninety percent baseline capacity, a five percent surge in unbuffered operational interruptions doubles the waiting time across all active work streams. The primary casualty remains deep development work, which relies entirely on sustained cognitive attention spans exceeding two continuous hours.
Every operational interrupt forces an immediate task preemption. The engineer pauses active product feature architecture to triage an incident, review an operational exception, or acknowledge an alert. The transition extracts a distinct, non-zero context switching tax.
Cognitive recovery requires twenty to twenty-five minutes before an engineer reconstructs the operational memory state required for complex code development. An unbuffered queue that injects twelve operational interrupts throughout an eight-hour working shift completely eliminates uninterrupted development blocks. The available engineering hours appear intact on administrative timesheets, yet shipped pull requests drop to zero.
When request arrival rates exceed system processing velocity without an admission barrier, queue wait times compound exponentially rather than linearly.
The unbuffered operational queue acts as a tax on engineering capacity. The cost vector splits into separate, observable magnitudes across multiple axes: direct hours consumed, attention fragmentation, system context erosion, and postponed feature capability. Operators attempt to absorb operational pressure by working longer shifts, a response that temporarily masks the structural imbalance while driving up exhaustion.
The true cost surfaces three quarters later when the primary software platform stagnates, technical debt hardens, and experienced senior contributors quietly depart.
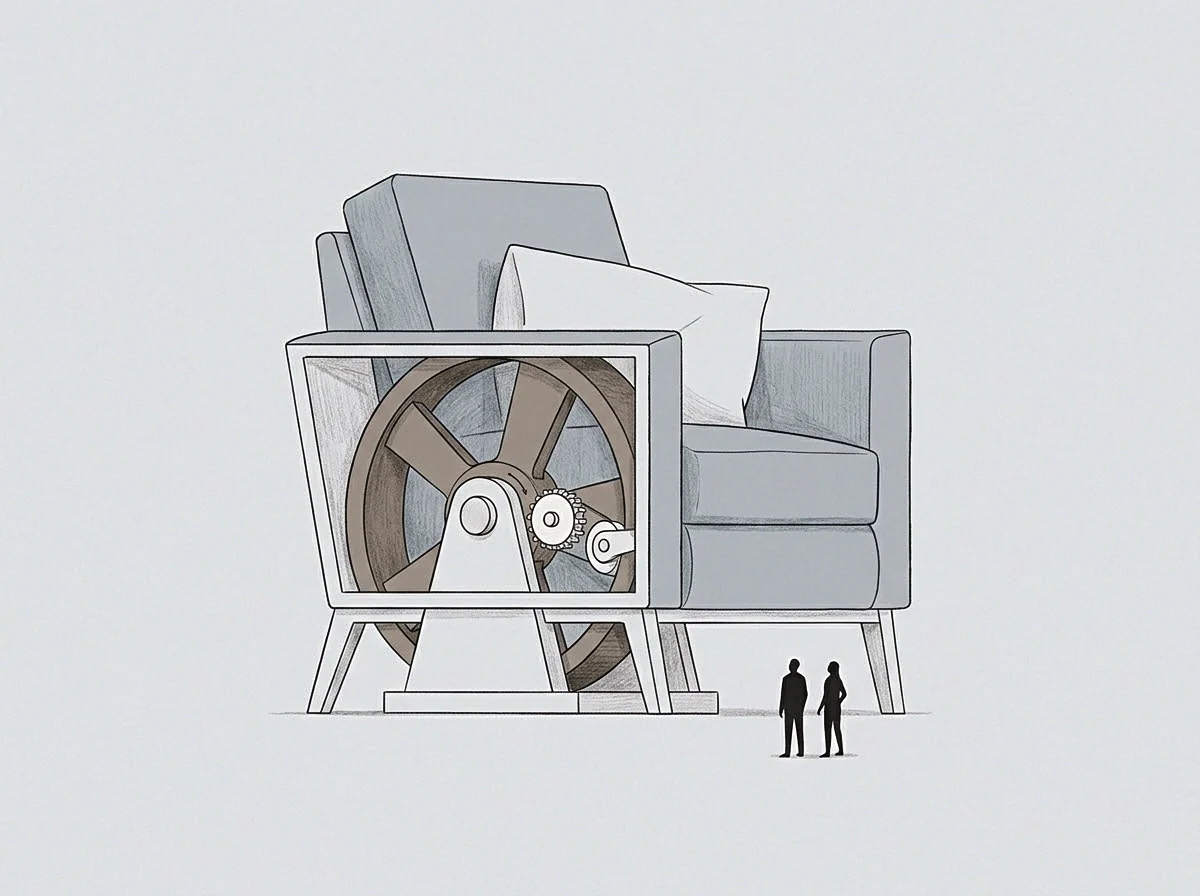
Operational Arrival Velocity Against Planned Commitments
Incoming interrupt traffic rarely distributes evenly across an engineering week. Alert clusters hit in stochastic bursts driven by batch pipeline runs, infrastructure deployments, or customer usage spikes. These bursts immediately collide with planned engineering delivery cycles.
Because operational interruptions carry immediate urgency, engineers process them through preemptive priority scheduling. High-priority interrupts systematically displace planned feature tasks regardless of the relative strategic yield of the scheduled work.
The operational queue behaves differently depending on whether incoming volume enters a managed intake buffer or strikes raw engineering attention directly. The contrast between these two intake environments manifests across every operational metric.
| System Variable | Buffered Operational Ingress | Unbuffered Operational Ingress |
|---|---|---|
| Arrival Rate Regulation | Intake batching with dedicated triage rotation | Immediate interrupt routing to any available engineer |
| Average Task Preemption Frequency | 0.4 interruptions per engineer each workday | 4.8 interruptions per engineer each workday |
| Effective Context Recovery Penalty | Under twenty minutes per day | Over one hundred sixty minutes per day |
| System Utilization Operating Threshold | Maintained between seventy and seventy-five percent | Consistently exceeds ninety-two percent |
| WIP Inventory Expansion Ratio | 1.2 times baseline sprint commitments | 3.6 times baseline sprint commitments |
| Planned Epic Completion Variance | Eight percent deviation from projected delivery | Fifty-four percent deviation from projected delivery |
The table isolates how an unbuffered queue damages throughput. Total hours spent in the building remain identical in both environments. The unbuffered configuration bleeds productive output through unmanaged utilization saturation and repeated recovery penalties.
The team in the unbuffered environment does not lack technical discipline; the physics of their operational intake mechanics ensures throughput collapse.
Leave operational intake unmanaged and the incoming queue steadily confiscates all engineering agency.
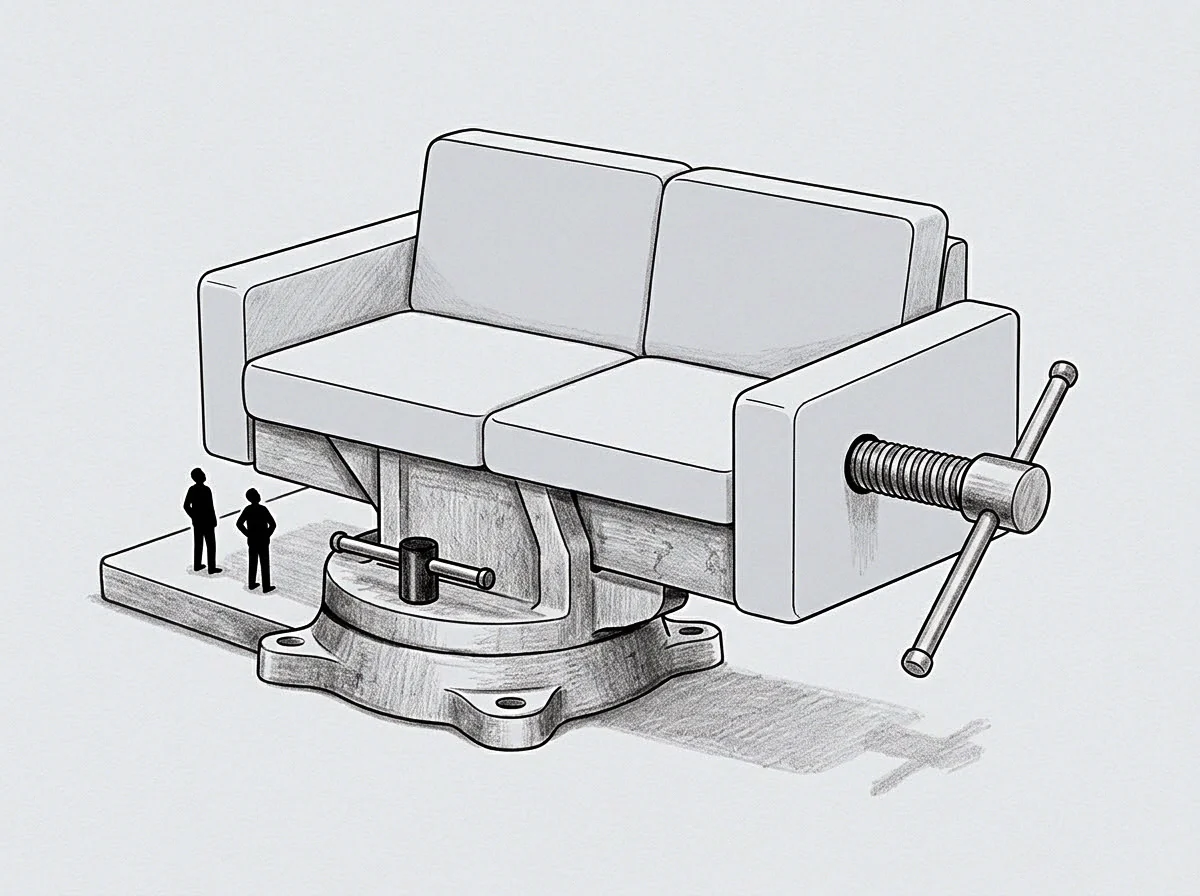
Drag
Mathematical modeling of operational queueing relies on Kingman formula approximations for heavy-traffic queues. Mean waiting time increases according to the variance of arrivals, the variance of service times, and the steep utilization factor expressed as utilization divided by idle capacity. As operational utilization approaches one hundred percent, waiting time explodes upward.
Engineers trapped in this state experience extreme task thrashing. They carry multiple unfinished features simultaneously while constantly fielding operational requests.
Work-in-process inventory expands dramatically under unbuffered conditions. An engineer interrupted halfway through an architectural refactor cannot easily close the branch. The work sits idle in the local repository.
Meanwhile, dependencies shift in the main codebase, generating merge friction that grows worse each day the branch remains open. When the engineer finally returns to the task four days later, simple rebasing demands hours of painstaking reconciliation.
Holding utilization near maximum capacity guarantees that any arrival variance will trigger runaway queue expansion.
This dynamic creates a self-reinforcing failure loop. Unfinished pull requests decay in repository storage, creating integration hazards that trigger new production alerts, which in turn generate fresh operational interrupts. The team spends increasing shares of every sprint responding to the very instability caused by their fragmented attention.
Throughput drops precipitously even as individual effort peaks.
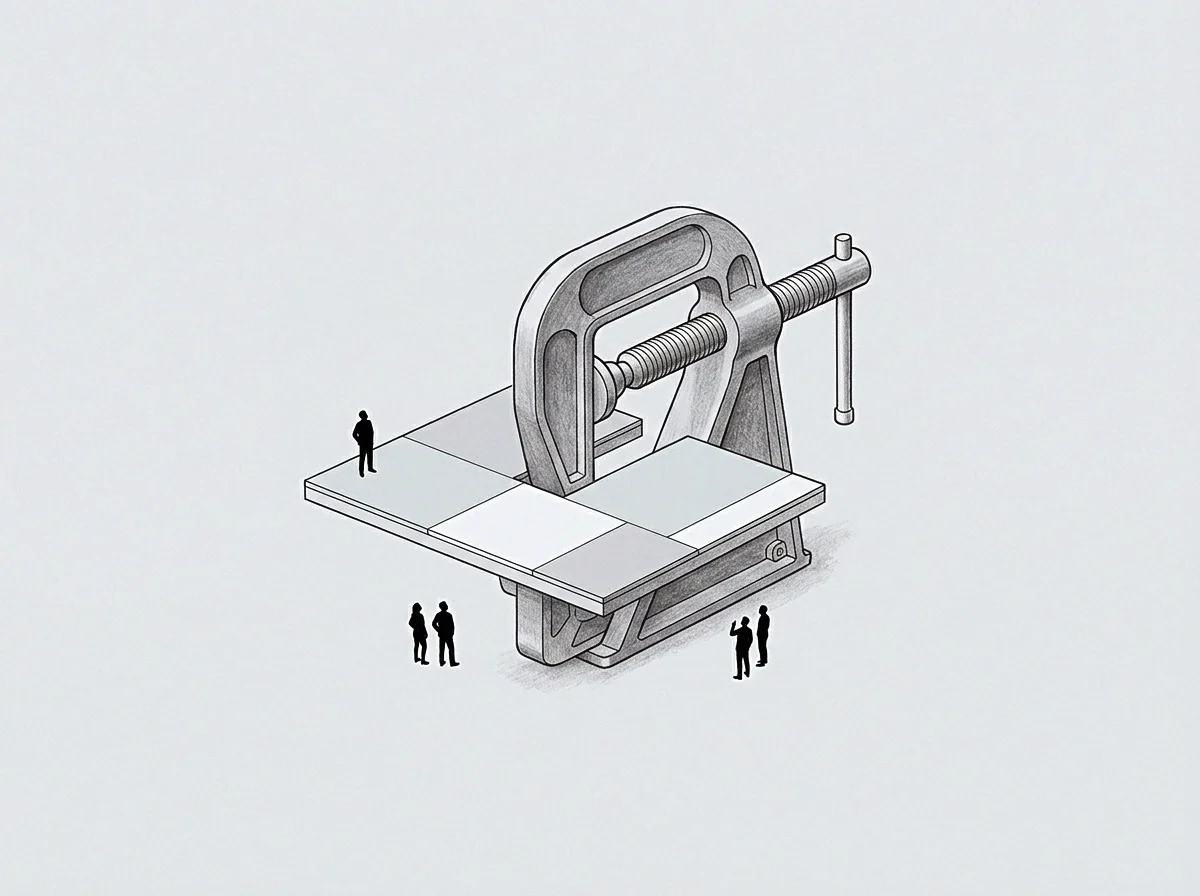
Quantifying Context Preemption Mechanics
Measuring the throughput penalty demands rigorous accounting of task preemption mechanics. A simple operational interrupt lasting ten minutes does not consume ten minutes of engineering capacity. The real transaction cost encompasses the full cognitive reload loop.
The physical stages of context recovery unfold sequentially:
- Triage suspension forces the engineer to write down incomplete mental variables, stash active code branches, and abandon working memory states.
- Operational service execution consumes the direct calendar time necessary to remediate the production ticket, alert, or operational inquiry.
- Environmental reconstruction involves clearing local testing caches, re-establishing development database seeds, and checking updated main branch heads.
- Cognitive state recovery requires tracing logic paths, reloading complex architectural schemas into biological memory, and locating the exact point of interruption.
Empirical measurement confirms that cognitive state recovery consumes at least double the duration of the operational interruption itself. A fifteen-minute server capacity alert routinely consumes fifty minutes of net productive capability. Five such alerts completely dismantle an engineer’s productive day, leaving zero usable margin for deep feature construction.
The engineer ends the week thoroughly depleted without having shipped a single line of customer-facing value.
An operator asks for a five-minute ticket review without realizing they are requesting an hour of fragmented cognition.
Decay
The erosion of engineering throughput extends far beyond calendar delays. Prolonged unbuffered queue pressure actively degrades technical quality. Engineers under persistent interrupt stress systematically avoid structural solutions.
When faced with a production anomaly, an exhausted engineer selects the fastest superficial patch rather than diagnosing the underlying systemic defect. The quick fix silences the immediate operational monitor but leaves the structural vulnerability completely intact.
This pattern compounds technical debt at an accelerated pace. Each superficial remediation adds fragile conditional logic, unindexed queries, or undocumented operational exceptions to the infrastructure. The codebase becomes increasingly brittle.
A brittle codebase generates a higher baseline frequency of runtime errors, which immediately translates into an elevated arrival rate for operational tickets. The unbuffered queue feeds upon its own exhaust.
Operational drag manifests across three distinct dimensions of engineering output:
- Structural design compromise emerges when engineers deliberately bypass modular design patterns in favor of copy-pasted implementations that resolve the immediate ticket within narrow thirty-minute windows.
- Verification scope reduction occurs as developers truncate integration testing, skip edge-case test definitions, and rely on shallow automated checks to rush pull requests through congested review queues.
- Documentation omission takes hold because updating technical design records, operational runbooks, and interface specifications consumes precious minutes needed to quench the next operational alarm.
Over two or three quarters, this mechanical degradation transforms the core product into a minefield. Simple feature additions require navigating layers of defensive patches. The team’s baseline velocity slows permanently, independent of the external operational arrival rate.
The capacity lost to brittle code architecture eclipses the hours lost to the operational interrupts themselves.
Persistent cognitive preemption forces engineers to trade long-term architectural stability for immediate ticket resolution.
The cost lands entirely on the maintainability component of the engineering asset. While executive leadership tracks gross feature velocity on summary progress reports, the foundational code integrity rots underneath. The system reaches an inflection point where even routine library updates spark multi-day outages.
The organization pays for unbuffered operational convenience by sacrificing the future architectural viability of the software.
Split
Resolving operational queue saturation requires an uncompromising structural division between planned feature development and operational triage intake. Organizations must terminate the practice of routing operational tickets directly to active product developers. The primary mechanism for protecting engineering throughput is the implementation of a deterministic triage buffer.
A rotating buffer role, often designated as a dedicated on-call shield engineer, intercepts and absorbs all incoming operational interrupts for a fixed operational cycle.
The on-call shield operates as an isolated queue consumer. All stakeholder inquiries, customer escalations, production alerts, and ad-hoc infrastructure requests must hit the shield engineer’s intake portal. The remainder of the engineering team remains fully insulated from incoming operational noise.
Protected engineers maintain zero operational ticket assignments, silence non-emergency alert channels, and retain uninterrupted cognitive blocks for high-leverage architectural builds.
Allocating Capacity Through Defined Buffer Roles
The shielding rotation must operate under strict mathematical constraints to prevent buffer failure. If operational arrival volume exceeds the processing capacity of a single shield engineer, the organization cannot solve the deficit by informally leaking tickets to other team members. Doing so immediately re-establishes the destructive unbuffered state across the wider engineering roster.
When arrival velocity surpasses buffer processing limits, the operator faces an explicit trade-off. Management must allocate a second dedicated shield engineer, directly acknowledging the cardinal price of operational maintenance, or enact strict admission control policies. Admission control involves rejecting or deprioritizing low-impact operational tickets, rate-limiting stakeholder ad-hoc requests, and forcing operational inquiries into asynchronous ticketing backlogs with defined service level agreements.
Assume an engineering team of six builders loses thirty percent of aggregate sprint velocity whenever operational queue spikes occur. By assigning exactly one engineer to a full-time, rotating operational shield position each week, the remaining five engineers achieve ninety-five percent delivery predictability on core roadmap milestones. Aggregate sprint capacity stabilizes immediately.
The team ships more net value with five focused engineers than it ever produced with six perpetually interrupted contributors.
The buffer makes operational maintenance costs visible, predictable, and structurally bounded.
Tally
Quantifying the precise operational throughput loss requires establishing rigorous telemetry across development workflows. Organizations cannot manage what they track exclusively through subjective sprint retrospectives. Engineering leadership must capture granular instrumentation that correlates operational interrupt frequency with code output metrics.
The primary measurement instruments focus on cycle time, pull request lifespan, and context fragmentation indices.
Cycle time measures the elapsed duration from an engineer’s first code commit on a branch to that branch successfully running in production. Under zero operational queue pressure, a focused five-hundred-line pull request typically moves from inception to deployment within forty-eight hours. Under heavy unbuffered operational pressure, the identical change regularly languishes for eleven business days.
The widening interval does not stem from code complexity; it reflects the accumulated context switching stalls and repeated rebase cycles forced by operational preemption.
How Does Queue Friction Surface in Engineering Telemetry?
Queue friction displays identifiable signatures across continuous integration and development dashboards. By analyzing the longitudinal relationship between operational tickets and code commit patterns, engineering leaders isolate the exact throughput penalty extracted by the environment. Key quantitative vectors include:
Active branch aging correlates directly with operational interrupt density. When incoming tickets surge, the daily commit frequency on feature branches drops, while the total calendar duration those branches remain unmerged expands by over three hundred percent. Pull request size conversely contracts as engineers attempt to push tiny, defensive changes rather than tackling coherent architectural modules.
The operational context switching ratio provides a direct mathematical measure of fragmentation. This figure divides the total count of operational triage interactions by the total number of committed code blocks per developer per week. Ratios exceeding 2.5 indicate severe operational congestion, where engineers spend more cognitive energy switching states than generating productive logic.
The context switching ratio exposes whether a team is primarily building assets or simply surviving system exhaust.
Tracking these values converts vague complaints about distractions into precise operational data. The engineering lead demonstrates exactly how many feature delivery days were surrendered to service an unbuffered ticket flow. This cardinal accounting provides the necessary leverage to defend operational buffers, enforce strict request gating, and renegotiate unrealistic product release schedules with organizational counterparties.
Whether leadership chooses to fund operational shields or continue paying the hidden tax of task fragmentation remains the defining structural decision for the engineering organization.