
Reading Internal Strain Beneath High Output Indicators
Internal strain measures the ordinal structural cost required to sustain cardinal output indicators along paths of high operational friction.

Seam
A software engineering group delivers twenty consecutive feature deployments on scheduled calendar dates. Board reporting decks reflect hundred-percent metric attainment, feature velocity charts show stable upward slopes, and open incident ticket counts remain flat. Beneath these cardinal indicators, senior engineers spend sixteen hours every weekend manually scrubbing database entries to prevent systemic schema corruption.
The primary delivery pipeline functions only because an unrecorded secondary human pipeline absorbs structural volatility. High output indicators record output volume along established channels. Internal strain measures the non-linear energy required to prevent those channels from collapsing under accumulated friction.
The separation between recorded throughput and hidden manual intervention marks the operational seam. Standard telemetry tools track closed tickets, converted leads, and deployed code artifacts. They fail to record the cognitive energy spent routing around system defects.
When an operational model reaches its structural limits, throughput remains steady while compensation costs compound exponentially. The system continues to generate expected deliverables, yet the energy cost per unit of output rises during every operational cycle.
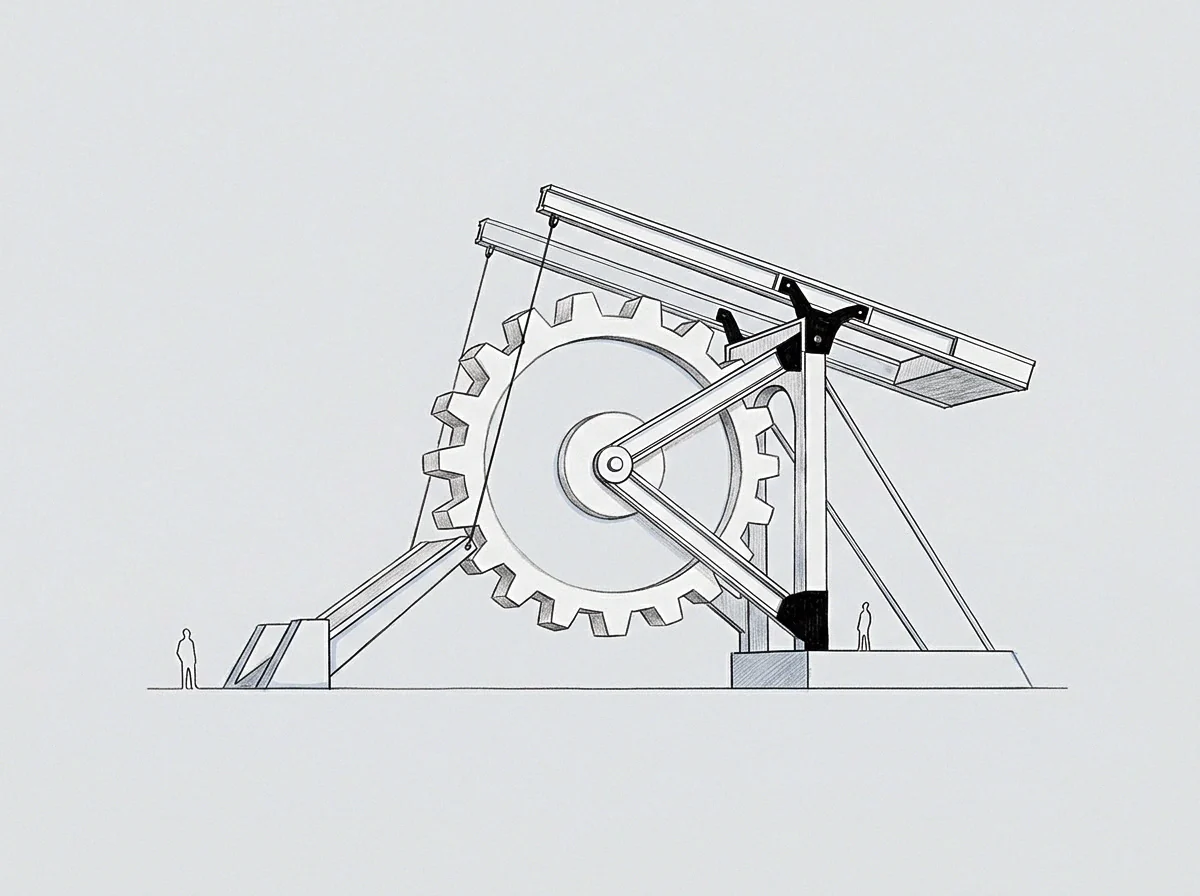
Divergence Between Velocity and Structural Latency
A system operating near structural exhaustion exhibits distinct behavioral signatures. Core processes depend on informal verbal agreements rather than documented system interfaces. Key personnel delay taking annual leave because unwritten procedures reside entirely inside individual memory.
Production errors receive localized patches that bypass root-cause investigation to preserve weekly release schedules. Output metrics measure volume. Output metrics never measure structural health.
The separation between cardinal output metrics and ordinal human cost marks the point where organizational debt begins to compound.
A primary operator handles system exceptions manually when automated validation fails. This pattern preserves output metrics while concealing underlying operational fragility from executive review. The true cost of production emerges when primary operators leave their seats, exposing unprocessed structural defects to routine operations.
Formal execution standards undergo immediate degradation when informal workarounds disappear. Stated delivery commitments remain unchanged until unrecorded manual interventions stop completely.

Vector
Internal strain acts as an ordinal vector against cardinal output figures. Cardinal metrics provide single numerical values, including monthly revenue, active user counts, or total tickets closed. Ordinal vectors define directional forces containing both magnitude and structural orientation.
Evaluating organizational health requires plotting the path of least resistance against the ideal gradient of operational efficiency. A team following the path of least resistance generates local optimization at the expense of long-term structural viability.
Workarounds serve as coordinate markers on an operational map. Where a system routes around an obstacle, unprocessed material accumulates behind the obstruction. The magnitude of the workaround corresponds directly to the size of the underlying structural defect.
Operators bypass rigid procurement channels to meet quarterly targets, building informal supplier networks on personal credit lines. Production teams omit mandatory unit test sweeps to preserve release windows, transferring quality verification directly to end users. The output indicator records successful execution.
The workaround records structural strain.

How Workarounds Map Latent Operational Friction
Workarounds emerge systematically where formal structures impose high computational costs on standard execution. The following list identifies four distinct structural strain markers observed in high-throughput environments.
- Compensation Debt accumulation occurs when routine execution depends permanently on overtime hours, off-hours messaging, and untracked individual effort to sustain standard baseline metrics.
- Interface Divergence manifests when cross-functional teams build duplicate parallel data stores to avoid negotiating unified schema definitions across departmental boundaries.
- Validation Suppression takes place when teams intentionally disable automated alerting thresholds or broaden error tolerances to preserve uninterrupted visual pipeline status.
- Knowledge Encapsulation develops when critical system remediation steps exist exclusively within undocumented personal scripts and individual memory structures.
Operators track these strain markers by calculating the ratio between formal process duration and actual end-to-end cycle times. The gap between theoretical process specifications and real-world execution paths defines the volume of latent friction. High volume gaps indicate that reported performance numbers rely on systematic structural evasion.
Workarounds mark the precise coordinates where formal system architecture fails to support operational reality.
Misreading an ordinal strain vector as a simple variance in output leads management to increase workload targets. Higher targets force operators deeper into informal workarounds, escalating hidden structural costs until core delivery systems fracture under pressure.

Shunt
A functional shunt diverts system stress away from visible monitoring channels. In electrical engineering, a shunt provides a low-resistance path for electric current, allowing current to pass around another point in the circuit. Organizational shunts perform an identical function by diverting operational friction into human capacity, keeping baseline dashboards clear while internal reserves drain.
Evaluating operational integrity demands comparing environments that utilize human shunts against environments that enforce explicit structural boundaries.
Consider two technology services firms operating at identical monthly billing volumes. Firm Alpha utilizes senior managers to intercept customer complaints manually, resolving service delivery failures through unbilled weekend consulting. Firm Beta sets rigid service-level boundaries, triggering automatic contract renegotiation or service termination whenever delivery thresholds break.
Firm Alpha exhibits pristine customer retention metrics alongside elevated staff turnover. Firm Beta exhibits moderate customer churn alongside stable operating margins and low staff attrition.

Why Does Throughput Mask Control Loop Saturation?
Control loops rely on error signals to adjust systemic operations. When human shunts absorb error signals before those signals reach central feedback mechanisms, the control loop becomes saturated. System managers receive zero deviation indicators, concluding that operating parameters remain optimal.
The internal strain builds without generating an external signal until human absorption capacity reaches absolute saturation.
| Evaluation Dimension | Human Shunt Model | Baseline Constraint Model |
|---|---|---|
| Primary Friction Reservoir | Individual operator capacity and unpaid working hours | Explicit system queue and visible task backlog |
| Error Signal Visibility | Suppressed; localized within informal communications | Exposed; recorded directly on central monitoring boards |
| Root-Cause Resolution Velocity | Zero; workarounds prevent structural investigation | High; system halts force immediate operational remediation |
| Executive Perception | High stability alongside low operational risk | Controlled volatility alongside transparent structural capacity |
| Data reflects observable operational profiles across high-output business units over twelve-month monitoring windows. | ||
Human shunts create an illusion of infinite systemic elastic potential. Operators expand their personal capacity to shield projects from administrative delays, hardware bottlenecks, or unclear governance models. This absorption conceals genuine capacity limits from executive planners.
Systemic capacity limits remain invisible as long as human operators absorb structural friction without logging operational debt.
A senior operator maintaining a permanent human shunt eventually remarks that the team handles every emergency without executive management ever discovering the true cost of execution.

Setpoint
Control theory defines a setpoint as the target value a system seeks to maintain. When an external disruption displaces a system from its setpoint, internal feedback mechanisms generate compensating action to restore baseline equilibrium. The time required for a system to return to its baseline setpoint following a high-output push serves as the definitive gauge of internal strain.
A healthy organization recovers baseline operational capacity quickly after peak delivery periods. A strained organization exhibits prolonged recovery lag, remaining in a depleted operational state long after peak demand subsides.
Evaluating recovery lag requires tracking post-launch operational metrics across consistent time windows. The period immediately following a major product release reveals systemic resilience. Healthy teams clear post-launch incident backlogs within days, returning to baseline feature development cadence without structural disruption.
Depleted teams experience extended operational drag. Routine maintenance stalls, team communication breaks down, and minor technical defects trigger widespread operational outages.
Measuring setpoint recovery involves tracking three sequential operational recovery stages across consecutive quarters.
- Immediate incident resolution velocity following high-demand delivery cycles.
- Return to nominal communication response times across cross-functional interfaces.
- Restoration of discretionary capacity allocated to long-term structural maintenance.
Discretionary capacity disappears first when internal strain accumulates. Teams dedicate hundred-percent allocation to immediate delivery obligations, abandoning internal tool development, process refinement, and structural documentation. The absence of discretionary capacity prevents the system from expanding its operational model.
The time required to restore baseline discretionary capacity measures structural exhaustion far more accurately than output volume.
System stability drops when baseline recovery time exceeds the interval between high-output delivery cycles.

Boundary
The boundary represents the absolute limit of an organization’s operational model. It consists of processes the system refuses to execute due to extreme computational or human costs. High output indicators frequently mask the reality that a business operates directly against its boundary wall.
Operating at the boundary generates intense internal discomfort, signaling that active computation rather than routine retrieval drives daily execution. Discomfort serves as a precise instrument for mapping organizational limits.
Errors function as coordinate markers for boundary expansion. Every operational failure identifies an uncomputed edge condition within the existing business model. Organizations that treat errors as individual performance failures miss the structural coordinate the error reveals.
Translating operational failures into structural boundary coordinates allows systems to expand their functional model systematically. This expansion converts latent potential into active operational capacity.

Mapping Operational Limits Through Failure Coordinates
Latent potential resides in the volume between current operational baseline execution and the boundary wall. It represents unspent structural capacity that becomes accessible only when internal strain receives direct remediation. A system that routes around internal strain locks its latent potential behind permanent workarounds.
Unlocking that potential requires eliminating human shunts, exposing suppressed error signals, and confronting the explicit cost of structural adaptation.
Confronting boundary constraints requires leadership to accept short-term throughput reductions in exchange for long-term structural integrity. Halting a high-output pipeline to repair core infrastructure reduces immediate delivery metrics. It also clears accumulated internal strain, re-aligning output metrics with genuine operational capacity.
Organizations that balance cardinal throughput against ordinal strain build structures capable of sustained long-term execution.
What structural modifications occur when an organization systematically prioritizes setpoint recovery speed over cardinal throughput targets?