
Resolving the Fundamental Conflict Between Strategic Valuation Metrics and Frontline Physical Execution Constraints
Strategic valuation metrics collapse when enterprise financial velocity models ignore frontline physical execution capacity limits and asset wear curves.

Split
A software valuation multiple applied to a hardware-dependent logistics firm assumes margin expansion without physical decay. When board-level models project forty percent annual growth based on software capital efficiency, the warehouse floor absorbs the structural deficit through unrecorded overtime, machine duty-cycle acceleration, and inventory staging density. Strategic valuation metrics measure financial velocity on an arbitrary baseline, whereas physical execution constraints operate on non-linear friction curves established by thermodynamics, spatial limits, and labor physiology.
The friction manifests long before it appears on an income statement. The floor holds the load.
Corporate valuation models treat capital allocation as a frictionless vector where dollars yield immediate operational scale. On the factory floor, scaling throughput requires equipment recalibration, operator certification, thermal stabilization, and supply chain queue optimization. Executive dashboards aggregate these physical realities into smoothed quarterly averages, masking localized bottlenecks until batch failures occur.
The divergence between strategic expectations and physical realities widens exponentially when capital infusions demand linear output increases from assets operating near maximum capacity.
Strategic projections model throughput as a continuous scalar while physical assembly operates in discrete, latency-bound batches.
The core systemic conflict emerges from mismatched time horizons and unit definitions. Financial analysts compute enterprise value using discounted cash flows anchored to gross margin targets that assume infinite elasticity in fulfillment infrastructure. Frontline operators manage fixed physical envelopes where doubling volume requires quadratic increases in sorting floor area or exponential power draw.
When executive leadership forces financial velocity targets onto frontline machinery without altering physical baseline assets, the operational layer develops structural workarounds that hide emerging failures until system breakdown occurs.
An executive board evaluates an enterprise through financial ratios designed for capital-light business models, isolating gross margin expansion as the primary valuation driver. Frontline management contends with physical batch sizes, equipment failure rates, and human shift constraints. The unresolved discrepancy between these operational realities leads to distorted resource allocation, where capital funds digital acquisition channels while core fulfillment physical infrastructure degrades to operational failure.

Index
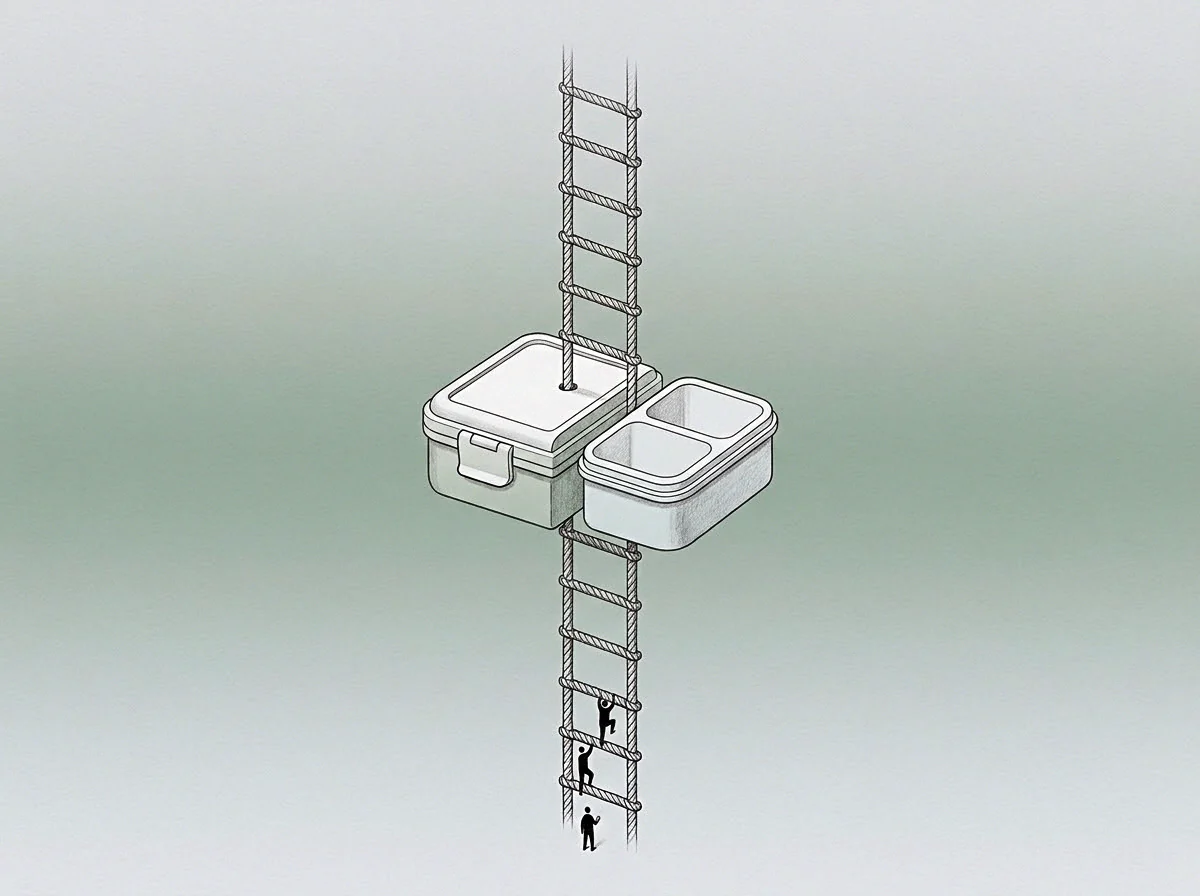
Structural Metrics Versus Frontline Physics
Strategic valuation frameworks utilize cardinal financial metrics designed to rank corporate performance across disparate industries. Return on invested capital, annual recurring revenue growth rates, and net expansion metrics isolate financial yield from the physical mechanisms producing that yield. Frontline operations rely on ordinal physical vectors, including equipment cycle times, thermal dissipation rates, material stress thresholds, and shift fatigue curves.
Capital assumes instant response. Translating a strategic metric directly into an operational command creates systematic misallocations of capital and labor.
When financial targets dictate physical operations, local optimization creates long-term system fragility. High-yield production runs scheduled to hit quarterly EBITDA thresholds bypass preventative maintenance windows, accelerating mechanical wear and compounding future operational downtime. Physical assets decay sequentially.
The strategic metric records temporary capital efficiency while the underlying physical asset suffers permanent capacity degradation.
- Multiple Compression Cascade occurs when capital spending yields diminishing physical output because structural bottlenecks on the fulfillment floor restrict maximum operational throughput.
- Phantom Efficiency Gain manifests when operational teams eliminate safety margins or bypass routine equipment servicing to meet short-term financial velocity targets set by external valuation models.
- Capacity Vector Misalignment arises when financial models treat supply chains as instantly scalable software connections rather than physical transport networks subject to queueing theory and transport delays.
- Thermal Overhead Accumulation represents the hidden operational friction incurred when equipment runs continuously above nominal engineered ratings to satisfy strategic batch requirements.
Strategic models often evaluate physical expansion through linear unit economics. Increasing warehouse throughput by fifty percent does not simply scale operating expenditures by fifty percent. Expanding physical volume alters fluid dynamics in shipping lanes, increases picking error rates due to aisle congestion, and causes non-linear wear on automated sorting equipment.
Margins collapse under physical friction.
The financial ledger measures price paid for capital equipment, while the physical environment calculates ordinal cost in machine duty cycles and operator fatigue. When strategic metrics ignore physical baseline costs, management mistakes asset consumption for sustainable operational yield. The resulting financial statements reflect high returns on capital until the physical baseline reaches operational failure, requiring capital infusions to replace depleted infrastructure.
Continuing to project strategic valuations without calibrating operational capacity metrics guarantees capital misallocation across all physical fulfillment facilities.

Room

Spatial Envelopes and Physical Throughput Floors
The physical warehouse floor defines the absolute envelope within which all strategic valuation targets must execute. A floor plan contains fixed square footage, specific aisle widths, maximum floor load capacities, and dock door throughput limits. Executive leadership frequently projects inventory turnover acceleration without expanding dock door counts or staging areas.
Material accumulation in receiving zones halts sorting speed regardless of capital deployed into digital order processing.
- Receiving dock congestion slows raw material intake, backing up transport trucks into off-site staging lanes.
- Internal aisle congestion forces forklift operators to lower transit speeds to meet workplace safety parameters.
- Automated conveyor belts overheat during continuous operation, triggering thermal safety shutdowns that halt packaging lines.
- Outbound shipping staging exceeds physical floor boundaries, blocking emergency access routes and emergency exits.
Workplace physiology introduces another immutable physical constraint to strategic execution models. Human operators working twelve-hour shifts exhibit predictable performance degradation curves characterized by declining picking accuracy and slower movement speeds. Speed accelerates wear rates.
Software dashboard metrics that project constant human efficiency across continuous operating schedules induce high worker turnover and increased error rates.
Requiring physical operations to match software valuation multiples without physical infrastructure expansion degrades equipment service life by half.
Machine maintenance represents an unspent volume of operational capacity that strategic valuation metrics consistently misprice. Modern automated picking systems require scheduled recalibration and component replacement after specific operating hour intervals. Overriding maintenance alerts to maintain quarterly production metrics converts planned downtime into catastrophic equipment failure.
The cost of emergency repairs and missed shipment penalties far exceeds the capital saved by delaying routine service windows.
Operational teams frequently adapt to unrealistic strategic metrics by constructing informal workarounds on the warehouse floor. Workers stack pallets above recommended height limits, bypass safety interlocks on conveyor systems, and manually route orders around failing automated scanners. These workarounds maintain the illusion of strategic metric compliance while building operational fragility across the entire physical facility.
Equipment operators note that machinery runs beyond rated tolerances daily simply to keep executive dashboard indicators green.

Scale

Comparative Analysis of Strategic Metrics and Frontline Execution Constraints
Evaluating enterprise valuation targets against frontline physical realities requires comparing financial expectations directly against operational mechanisms. Strategic metrics operate on aggregated accounting periods, whereas physical execution occurs in real-time continuous space. Shift handovers reset throughput.
| Strategic Valuation Metric | Frontline Execution Reality | Divergence Mechanism | Operational Cost Profile |
|---|---|---|---|
| Gross Margin Target Expansion | Fixed Equipment Duty Cycles | Increased line speed accelerates mechanical wear and maintenance costs. | Non-linear repair expenses and sudden capital replacement requirements. |
| Linear ARR Growth Multiple | Physical Dock Staging Capacity | Order volume exceeds physical loading door throughput capabilities. | Demurrage fees, freight expediting costs, and customer churn. |
| Inventory Turnover Acceleration | Warehouse Aisle Space Limits | High inventory velocity causes aisle congestion and picking slowdowns. | Increased labor hours per picked unit and higher product damage rates. |
| Labor Cost Reduction Percentage | Operator Fatigue and Cycle Limits | Reduced staffing leads to elevated error rates and safety incidents. | Worker compensation claims, retraining costs, and output quality decay. |
Strategic financial models rely on cardinal figures that allow smooth interpolation across time periods. Frontline execution operates under threshold constraints where minor increases in input volume produce disproportionate operational failures once physical limits are crossed. Overhead expands without baseline checks.
Adding one additional transport vehicle to an already saturated loading bay causes a total throughput freeze rather than an incremental increase in shipping output.
Evaluating an enterprise solely through financial multiples ignores the operational friction accumulating on the physical floor. A high return on invested capital metric achieved by running equipment at continuous maximum capacity reflects asset consumption rather than sustainable operational efficiency. Correctly assessing enterprise health requires integrating physical capacity constraints directly into valuation calculations.
Incorporating a physical duty-cycle constraint into board-approved growth models lowers short-term projected financial velocity while protecting long-term asset productivity.

Shield

Does Floor Latency Mirror Strategic Target Overhang?
Systemic avoidance occurs when executive leadership isolates itself from frontline physical data. Management teams routinely construct reporting shields using aggregated financial metrics that intentionally obscure operational friction. The queue dictates latency.
By focusing exclusively on high-level software indicators, leadership avoids confronting the capital investments required to expand physical warehouse capacity or modernize aging equipment fleets.
The magnitude of frontline workaround activity mirrors the scale of unrealistic strategic metric overhang. When strategic targets exceed physical execution limits by fifty percent, operational staff spend equivalent energy managing system friction rather than processing volume. Thermal thresholds cap batch sizes.
Frontline staff construct informal staging areas, utilize manual data overrides, and improvise material handling methods to bridge the gap between financial targets and physical floor capability.
Operational workarounds mask physical capacity limits until sudden batch failures break fulfillment commitments.
Avoidance at the strategic level manifests as persistent failure to budget for physical infrastructure maintenance. Capital is directed toward customer acquisition software and sales expansion initiatives, while floor machinery operates on emergency repairs. The system routes investment around physical constraints because physical upgrades require long lead times and immediate capital outlays that reduce short-term accounting margins.
The boundary of an operational model becomes visible when frontline teams can no longer improvise solutions to bridge strategic targets and physical limits. At this boundary, minor equipment breakdowns trigger catastrophic facility-wide operational stoppages. Vectors diverge at speed.
Recognizing this boundary requires executive leadership to look past aggregated dashboard metrics and directly inspect physical floor conditions.
Physical execution limits govern total throughput regardless of capital allocation decisions on executive dashboards.

Yield
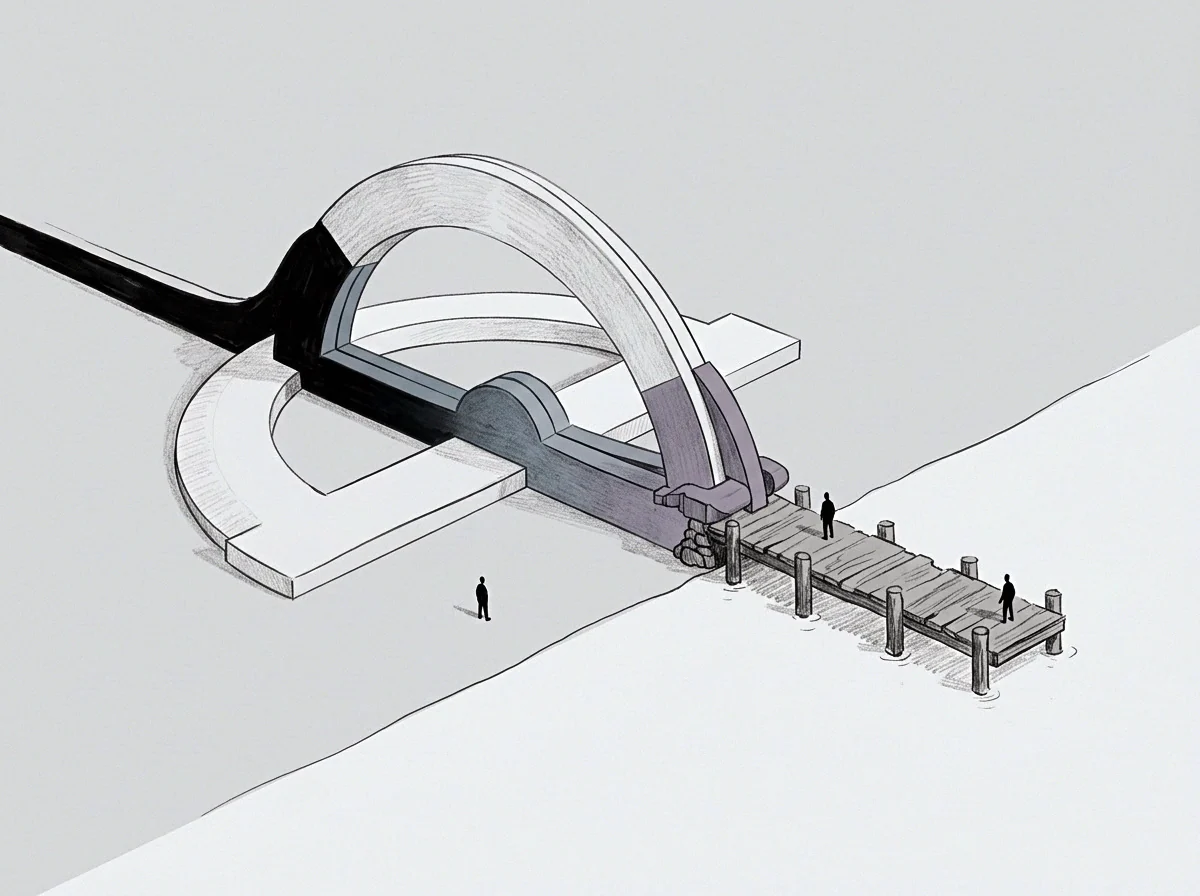
Re-Aligning Strategic Valuations with Operational Floor Reality
Resolving the conflict between valuation metrics and physical constraints requires establishing derived operational metrics that accurately reflect floor capacity. Enterprise financial models must incorporate physical constraints, including equipment duty cycles, staging envelope limits, and human labor sustainability. High valuation multiples are unsustainable when built on the rapid consumption of unbudgeted physical infrastructure assets.
Capital allocation frameworks should tie financial velocity projections directly to physical asset expanded capabilities. Investment in digital sales channels must be matched by proportional capital expenditure in fulfillment dock capacity, sorting automation servicing, and physical space expansion. The physical line operates constantly.
Operational teams require direct structural channels to communicate physical capacity limits to executive boardrooms before strategic growth targets are finalized. Establishing hard physical constraints within strategic planning software prevents the formulation of unrealistic financial models that degrade frontline infrastructure.
Calibrating enterprise valuation multiples to actual frontline physical limits produces accurate capital forecasts and protects core operational infrastructure from premature degradation. Financial metrics that reflect physical limits sustain long-term operational health and protect asset investment values over multi-year horizons.