
Scalar Unit Conversion Across Multi Dimensional Performance Telemetry
Converting multi-metric telemetry to a scalar projects disparate channels onto an economic loss gradient that reveals the nearest physical constraint.
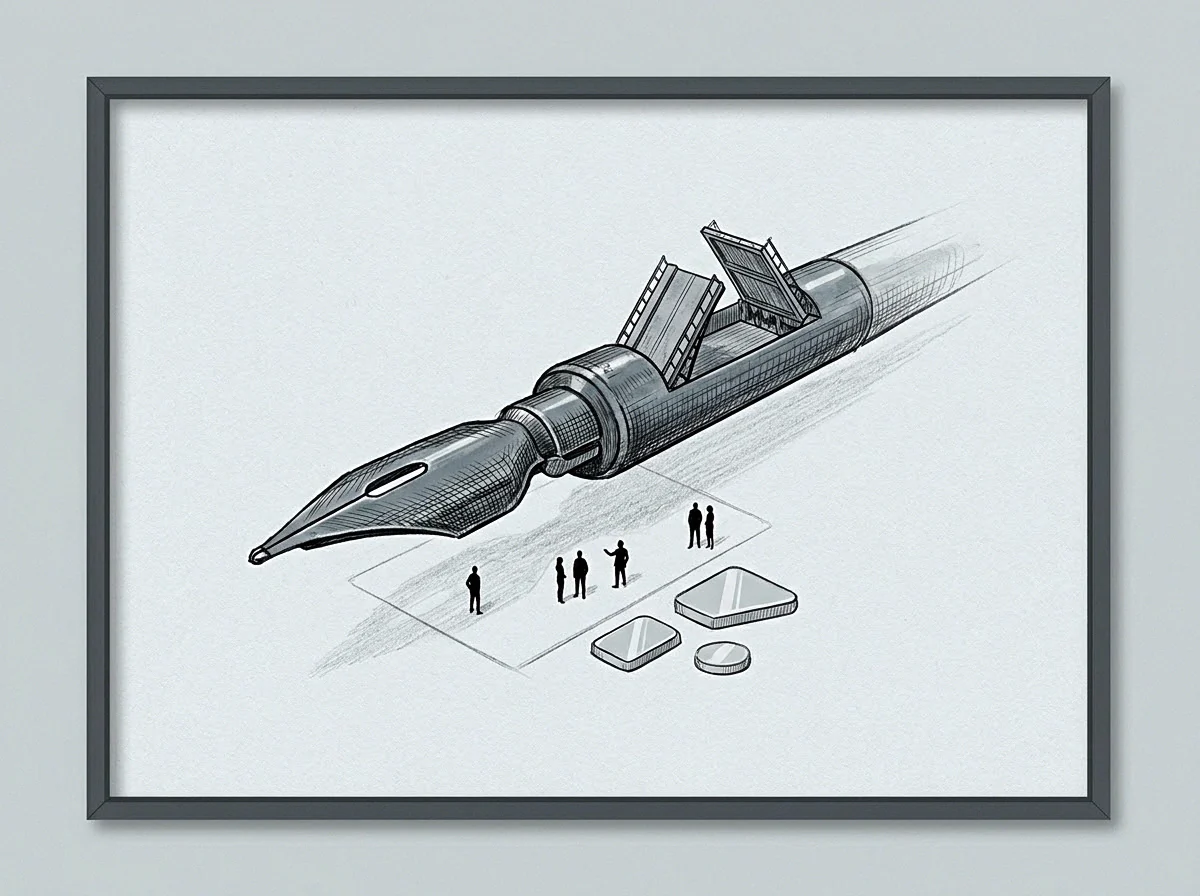
Norm

Loss Projection Over Heterogeneous Channels
Production systems emit telemetry across unaligned physical coordinates. Memory pressure registers in mebibytes, network ingress records as gigabits per second, transaction latency accumulates in milliseconds, and hardware leases accrue in pennies per machine hour. When an operator compresses these disparate streams into a single composite health metric, mathematical projection takes the place of direct observation.
Arithmetic aggregation across disparate units creates an artificial surface. Adding milliseconds of tail latency to percentage points of processor utilization yields an ungrounded scalar sum. A run of high latency paired with low processor draw produces the identical index value as low latency paired with heavy saturation.
The operational meaning of those two states remains entirely distinct.
Projection onto a single coordinate requires a loss function anchored to real operational consequence. The common currency across machine fleets is monetary expenditure and contractual failure. Rather than scaling units arbitrarily by their observed historical maxima, the engineering team maps each telemetry channel to its marginal penalty.
A millisecond of delay beyond a service agreement incurs a quantifiable probability of customer departure. A gigabyte of uncollected garbage allocation increases memory footprint, driving cluster node count. Converting each raw channel into an economic or survival gradient produces an ordinal vector that respects physical limits.
Collapsing telemetry streams destroys directional information. The resulting scalar conceals which component initiated system drift.
Converting raw coordinates into marginal loss preserves physical meaning across disparate machine metrics.
Standardization techniques often compound the distortion. Computing a z-score across a window assumes stationarity and Gaussian distribution in the underlying telemetry. Queuing delays and packet drops follow heavy-tailed Pareto or Weibull curves.
Normalizing tail latency with standard deviations hides catastrophic variance inside an artificially compressed coefficient. The operator reads a stable scalar while the underlying queue experiences exponential growth.
Telemetry channels register failure through distinct mathematical profiles:
- Saturation cliff telemetry manifests where queue depths remain flat until storage buffers fill completely. The metric then jumps several orders of magnitude within milliseconds.
- Linear resource attrition displays steady upward progression over days of persistent leaks. The rate remains constant until operating system memory tables lock.
- Stochastic tail dispersal creates rare percentile spikes that pull aggregate means upward. The vast majority of transaction traces show normal transit times.
When normalization methods compress these disparate distributions into a single uniform scale, the supervisory logic reacts to false minimums while real hardware boundaries fracture under unmonitored load.
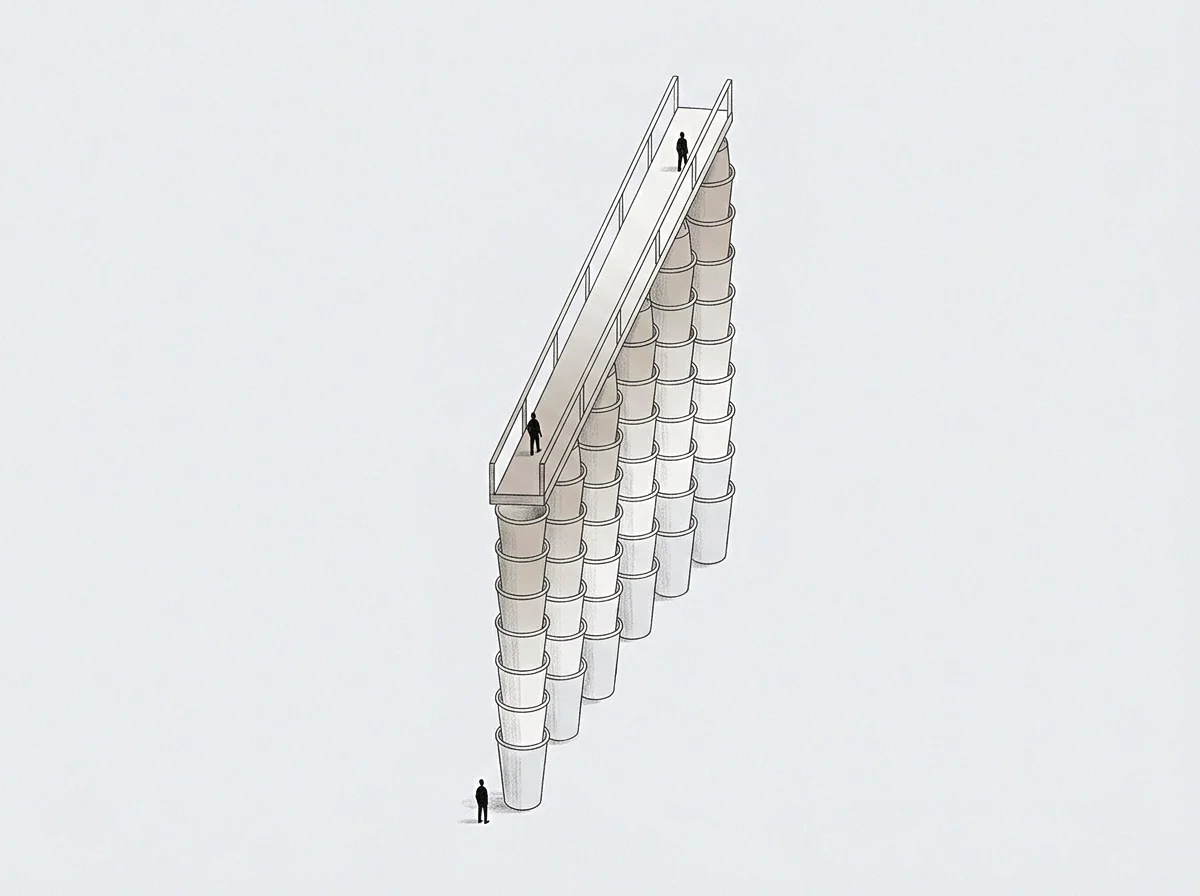
Weight

Arbitrating Metric Trade Surfaces
Every scalar transformation incorporates an implicit system of values. Assigning a numerical coefficient to a latency channel relative to an error counter declares what an operator will surrender to preserve system response. In distributed systems, this exchange rate shifts continuously with total load.
At five percent cluster capacity, an operator trades spare processor cycles freely to compress outbound payload bytes. At ninety-five percent capacity, saving those processor cycles takes precedence over transit bandwidth. Static weights fail because the trade-off curve between physical units is non-linear.
The vector gradient computed from a value axis carries no moral judgment. It describes the rate of state transformation along each component vector. When a telemetry collector projects these components into an operational scalar, it chooses a direction through an unaligned multi-metric space.
The angle of that path dictates which subsystem starves first. Mathematical normalization schemes attempt to resolve this tension by removing unit scale, yet each scheme imposes distinct distortion patterns on the telemetry landscape.
| Transformation Method | Preservation of Extremes | Sensitivity to Outliers | Computational Overhead | Failure Surface Behavior |
|---|---|---|---|---|
| Min-Max Rescaling | Truncates novel spikes | Distorts full scale on single anomaly | Minimal processor cost | Conceals catastrophic shifts beyond historic bounds |
| Z-Score Standardization | Compresses long tails | Shifts mean value across non-normal data | Moderate sliding window computation | Understates Pareto queue expansions |
| Logarithmic Compression | Expands low-end resolution | Suppresses acute high-frequency bursts | Continuous mathematical operations | Dampens critical warnings near structural thresholds |
| Marginal Economic Loss | Maintains absolute limit spikes | Scales monotonically with financial damage | Lookup table evaluation per ingest | Accurately reflects existential system boundaries |
Evaluating these transformations reveals why naive scalar indexes create operational blind spots. When telemetry aggregation relies on min-max rescaling, an unprecedented latency spike sets a new boundary, immediately compressing every subsequent reading toward zero. The system interprets routine elevation as trivial noise simply because an extreme event expanded the calculation envelope.
Under z-score standardization, a steady shift in base performance moves the rolling average, gradually normalizing systemic degradation.
Mathematical elegance cannot replace empirical grounding. The transformation must reflect physical constraints of silicon and fiber.
A scalar conversion formula defines the exact contractual penalty an operator accepts before shedding load.
Engineering teams frequently construct balance metrics that attempt to average availability, throughput, and operational expenditure. These composite indicators smooth the real performance topology, turning jagged cliffs into gentle slopes. The supervisory automation follows the synthetic gradient straight into deadlock because the scalar score signaled stability while individual buffer limits reached saturation.
A valid scalar conversion functions as an envelope detector, preserving the vector magnitude of the nearest physical wall.
The stated threshold of a service contract fixes the conversion coefficient until legal terms renegotiate the liability boundary.
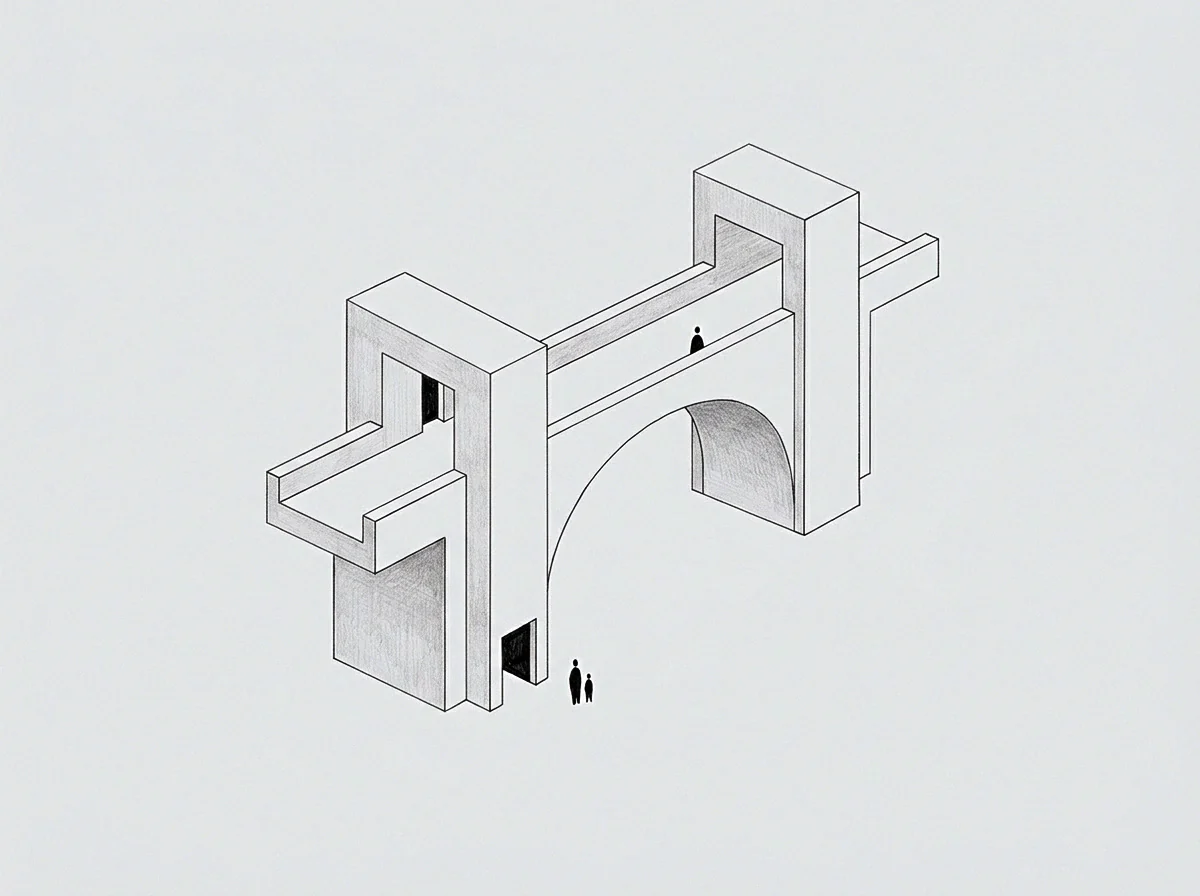
Desk
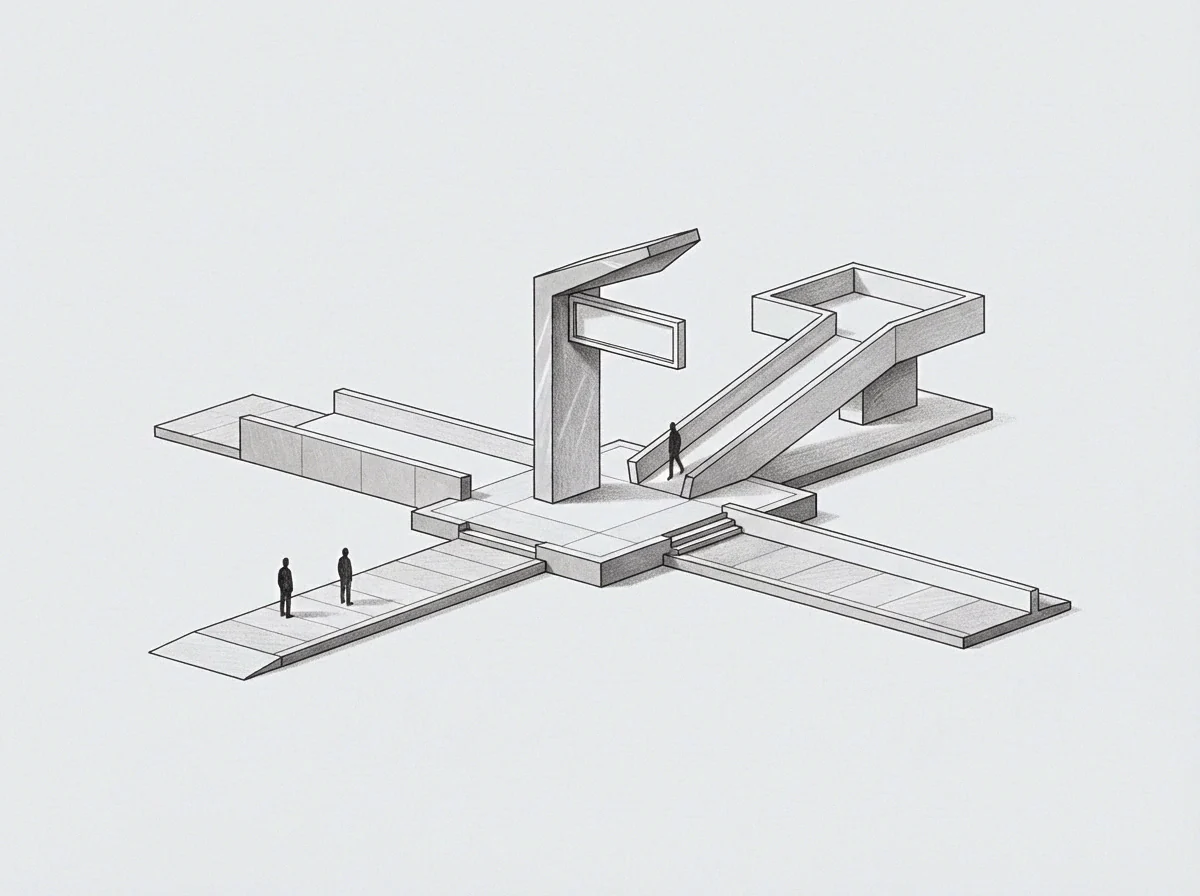
The Operator Interface and Conflicting Telemetry
The engineering console presents twenty competing graphs to an operator on call at three in the morning. Each chart renders its own axis: disk input operations per second, garbage collection pause duration, remote procedure call retries, and database lock wait times. Cognitive capacity under sleep deprivation is severely constrained.
The human mind cannot compute an eight-variable vector projection in real time. The person in the chair seeks a single number that indicates whether the platform is recovering or degrading.
That psychological pressure drives the creation of consolidated health scores. The score promises simplicity by digesting hundreds of metrics into a decimal bounded between zero and one. In practice, the aggregation introduces a dangerous delay.
A sudden rise in memory allocations masked by an identical decrease in cache misses keeps the aggregate health indicator green. By the time the consolidated number drops, the database pool has exhausted its connections, initiating a cascading restart.
The console screen reflects an unresolved institutional argument between infrastructure expense and customer experience. The finance lead evaluates server cluster expenditures on a monthly invoice. The site reliability lead tracks ninth-percentile query resolution times across three continents.
When these competing priorities collapse into an internal billing algorithm, the resulting scalar merely hides the conflict. Operational staff learn to distrust the aggregate dial, opening raw metrics in separate terminal panes to locate actual system behavior.
Composite dashboards frequently mask acute failure states. Raw counters reveal the physical strain.
The operator inspects the telemetry looking for the path of least resistance. That path represents the trajectory the system naturally follows when automated routines shed defensive checks to preserve baseline throughput. Automated routines optimize for the metric that triggers alarms, shifting strain onto unmonitored subsystems.
A team that measures only request duration discovers that their services return empty responses within five milliseconds, maintaining the scalar index while shedding the business workload.
The service meets its response target while failing to process incoming transactions.

Descent

Optimization Trajectories Across Multi-Metric Topologies
Automated remediation routines rely on gradient descent to return distributed fleets to safe operating envelopes. When the target function is a synthetic scalar constructed from normalized telemetry streams, the optimizer navigates an artificial mathematical landscape. The algorithm moves downhill along the steepest synthetic slope, adjusting configuration parameters to minimize aggregate error.
The path taken depends entirely on the conversion factors used to bridge non-comparable telemetry units.
A steepest-descent computation operates mechanically, blind to institutional context. If the conversion model equates ten milliseconds of latency with five machine instances of capacity, the automated scaling loop will launch hardware until budget quotas lock the cluster. Conversely, if economic cost weights dominate the telemetry vector, auto-tuning routines will throttle background reconciliation workers to preserve immediate margin.
The system descends into an operational trap where ledger balance remains intact while data consistency quietly decays.
Optimization routines follow distinct steps when traversing multi-metric telemetry planes:
- Channel state capture samples raw telemetry streams across divergent units and sampling rates.
- Dimensional transformation applies scaling functions, mapping raw counts to normalized coordinates.
- Weight vector dot product generates the composite loss scalar defining the current error surface.
- Directional derivative evaluation determines which machine parameter adjustment achieves the sharpest metric reduction.
- Actuation feedback verification records system movement along the real performance boundary to detect unexpected friction.
When the scalar conversion distorts the topology, the descent vector points toward an unviable state. The system converges on a parameter set that satisfies the mathematical aggregator while starving physical components of necessary resources. Real engineering capacity then burns during emergency rollbacks to undo the automated optimization.
True operational stability mirrors the negative gradient of real constraint violation rather than synthetic scoring surfaces.
A remediation loop follows the easiest mathematical descent regardless of hardware survivability.
The boundary of the operational model is marked by what the infrastructure refuses to execute. A database engine will not accept writes when disk queues fill completely. That wall constitutes an absolute physical coordinate, not a negotiable weighting variable.
Scalar conversions that treat absolute system limits as soft penalties invite catastrophic failure, because an optimizer will happily overstep a hardware barrier if gains in other channels balance the aggregate score.
An optimization trajectory that ignores hardware limits guarantees emergency manual intervention.
Volume

Quantifying Latent Operational Capacity
Behind every conservative operating limit lies an unspent envelope of hardware performance. Infrastructure operators routinely run compute clusters at fifteen percent nominal utilization to safeguard against unmodeled demand surges. That buffer represents latent potential, a reserve capacity maintained because the multi-metric telemetry model lacks sufficient precision to predict true failure margins.
The gap between current load and catastrophic saturation constitutes an unmapped operational volume.
Converting multi-metric telemetry into a well-calibrated scalar projection allows an organization to map that reserve territory. Rather than maintaining static safety margins across all channels simultaneously, the telemetry processing pipeline tracks the distance to the nearest physical constraint. If network bandwidth has eighty percent head room while local memory pools sit near saturation, the effective scalar limit reflects the memory vector alone.
The platform measures its operational margin by the single coordinate that restricts further expansion.
Every conservative safety margin represents an unspent budget of hardware capacity.
Tracking this boundary requires understanding what an engineering team actively routes around. When developers construct complex application caching layers to avoid calling a legacy storage engine, their architectural avoidance acts as an exact coordinate marker. The volume of engineering hours spent maintaining the workaround measures the magnitude of the underlying system limit.
Telemetry that incorporates these software friction points alongside raw machine counters reveals the true cost of operating the platform.
Converting these heterogeneous telemetry vectors into a singular scalar gradient remains an active challenge. Operators balance the necessity of clear diagnostic visibility against the mathematical distortions inherent in collapsing multi-metric spaces. The question remains whether telemetry aggregation can preserve physical reality without overwhelming the human operator tasked with maintaining cluster integrity under catastrophic failure.