
Evaluating Long Term Capability Vector Recovery Constraints Following Multi Year Startup Cash Conservation Cycles
Capability recovery fails when organizations treat preserved capital as restored operational capacity without first rebuilding atrophied internal routines.
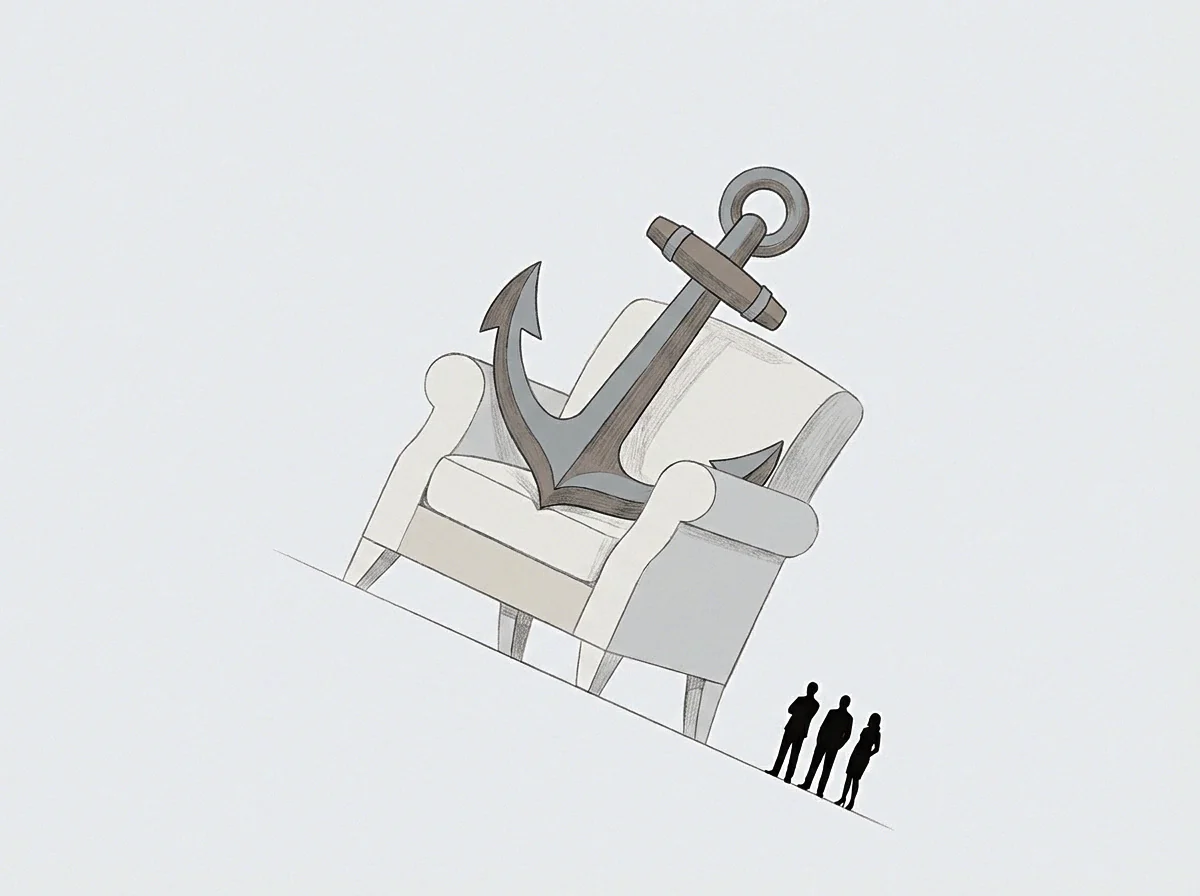
Floor
The bank statement showed eighteen months of operating cushion remaining after thirty-six months of defensive austerity. The cash balances held. In the ledger, the preservation program looked like discipline: zero net hiring, cloud infrastructure locked down to reserved instances, customer discovery paused, experimental product branches deleted.
The team stopped learning. The executive team celebrated reaching operational break-even on five legacy customer contracts, yet the organization had quietly forfeited its ability to ship complex software into competitive markets. Survival in financial accounting often conceals severe operational decline.
Evaluating an operational vector demands separating cardinal accounting figures from ordinal capacity measurements. Monetary reserves are cardinal numbers; they sit in accounts, can be added or subtracted directly, and transfer across boundaries without distortion. Operational capability behaves as an ordinal vector with divergent components: engineering velocity, institutional context, exploratory cadence, production resilience, and domain intuition.
When an operating team cuts expenditure to extend runway, it freezes money outflows while actively eroding internal capability. This trade produces a false setpoint. The organization assumes that returning capital to development teams restores output linearly, forgetting that tacit skill dissipates during hibernation.
Deferred operating capacity extracts repayment through compounding friction rather than immediate invoices.
The person directing the firm during austerity measures runway by the burn rate denominator. Shrinking that denominator preserves the business entity on paper. Meanwhile, every delayed refactor and suppressed product bet degrades the vectors that generated original market attraction.
When leadership finally decides to redeploy capital, the baseline capability sits lower than where the freeze began. Planning a renewal cycle without recognizing this degraded baseline causes management to commit capital against dead lines of execution, burning fresh cash reserves before the operating engine achieves lift.

Structural Deterioration During Austerity
Prolonged freezes alter the social and structural architecture of an enterprise. Tooling froze in place. Senior individual contributors depart when technical scope shrinks to defensive triage, taking undocumented operational memory with them.
The engineers remaining behind spend quarters resolving repetitive infrastructure incidents rather than building scalable architecture. Old assumptions decay. The operational feedback loops that once connected product iterations to market signals sever completely during defensive pauses.
Three primary vectors experience acute regression while financial statements appear stable:
- Deferred architectural migration creates compounding dependencies that break under new throughput demands, forcing incoming engineering cohorts to spend quarters cleaning infrastructure before delivering customer-facing features.
- Skeletal maintenance staffing eliminates institutional documentation habits, leaving critical deployment routines in undocumented operational routines known by single individuals.
- Suppressed experimental cadence trains surviving product teams to reject ambiguous opportunities, replacing calculated risk assessment with defensive compliance habits.
Loss of capability accumulates quietly along the hours vector. A task that required ten development hours three years earlier now demands fifty hours because downstream dependencies decayed and nobody understands the original deployment scripts. Codebases calcify under neglect.
The monetary price of the software license remained zero throughout the preservation cycle, yet the internal exertion needed to modify the system multiplied fivefold.
Skill decay accelerates when teams isolate systems from continuous production stress.
Knowledge dispersal accelerates. Does an organization that maintained cash reserves by freezing exploratory initiatives for forty months retain the structural coherence required to restart those initiatives, or does it merely own a legal shell housing legacy routines?
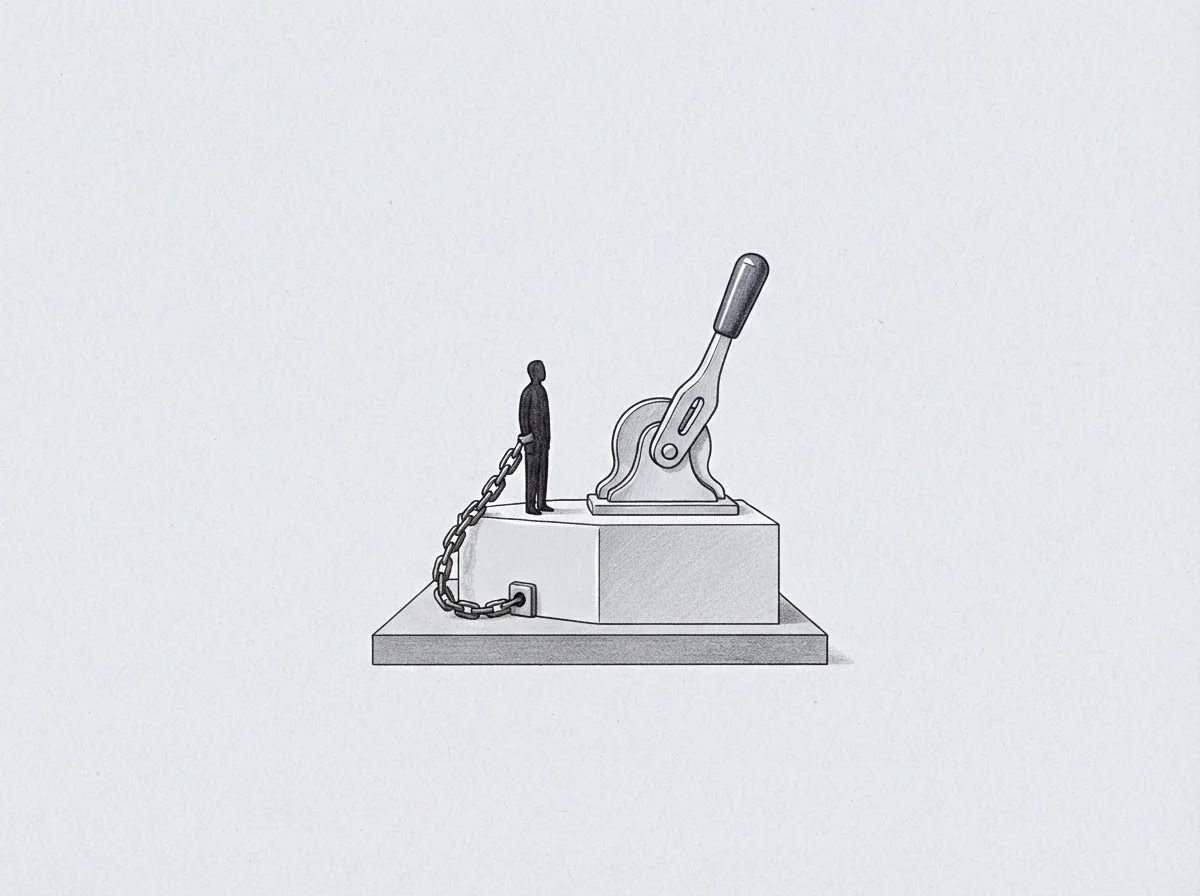
Tally
Measuring the real state of an enterprise emerging from conservation demands inspecting individual operational components. Cardinal balance sheets offer no help here. The operator inventories capabilities ordinally, observing which team routines execute cleanly and which choke on basic friction.
Attention scatters across fires. Without deliberate measurement of these degraded capacities, capital allocation errors multiply rapidly.
| Capability Vector | Conservation Posture | Recovery Bottleneck | Relative Exertion Multiplier |
|---|---|---|---|
| Core Architecture | Frozen dependencies and hotfix patches | Compound technical debt and obsolete frameworks | High |
| Product Discovery | Customer outreach limited to renewal retention | Atrophied interview cadence and obsolete personas | Severe |
| Recruiting Pipeline | Zero hiring and terminated recruiter relationships | Repriced labor market and diminished brand presence | Moderate |
| Delivery Cadence | Monthly manual safety releases | Broken continuous deployment suites | High |
| Domain Expertise | Documentation backlogged in triage tickets | Tacit institutional knowledge loss | Severe |
The table reveals how defensive operational postures distort subsequent recovery work. In core architecture, freezing dependencies avoids immediate license fees and migration labor, but subsequent modernization requires complete platform rewrites. The relative exertion multiplier reflects the internal operational drag imposed on the organization relative to continuous maintenance baselines.
What seemed like a prudent saving of three hundred engineering hours per year transforms into an unavoidable expenditure of fifteen hundred hours during reconstitution.
Product discovery atrophies rapidly. An enterprise that stops continuous discovery work loses touch with the shifting preferences of its target accounts. The team assumes customer profiles remain static, only to discover upon relaunch that procurement criteria evolved.
Re-establishing those discovery channels demands substantial executive attention, pulling leadership away from architectural remediation. Every operational vector competes for the same finite pool of executive stamina.
The governing covenant of an operational recovery budget changes the moment leadership writes down degraded components on an ordinal scale, establishing that technical debt must clear before feature delivery resumes.
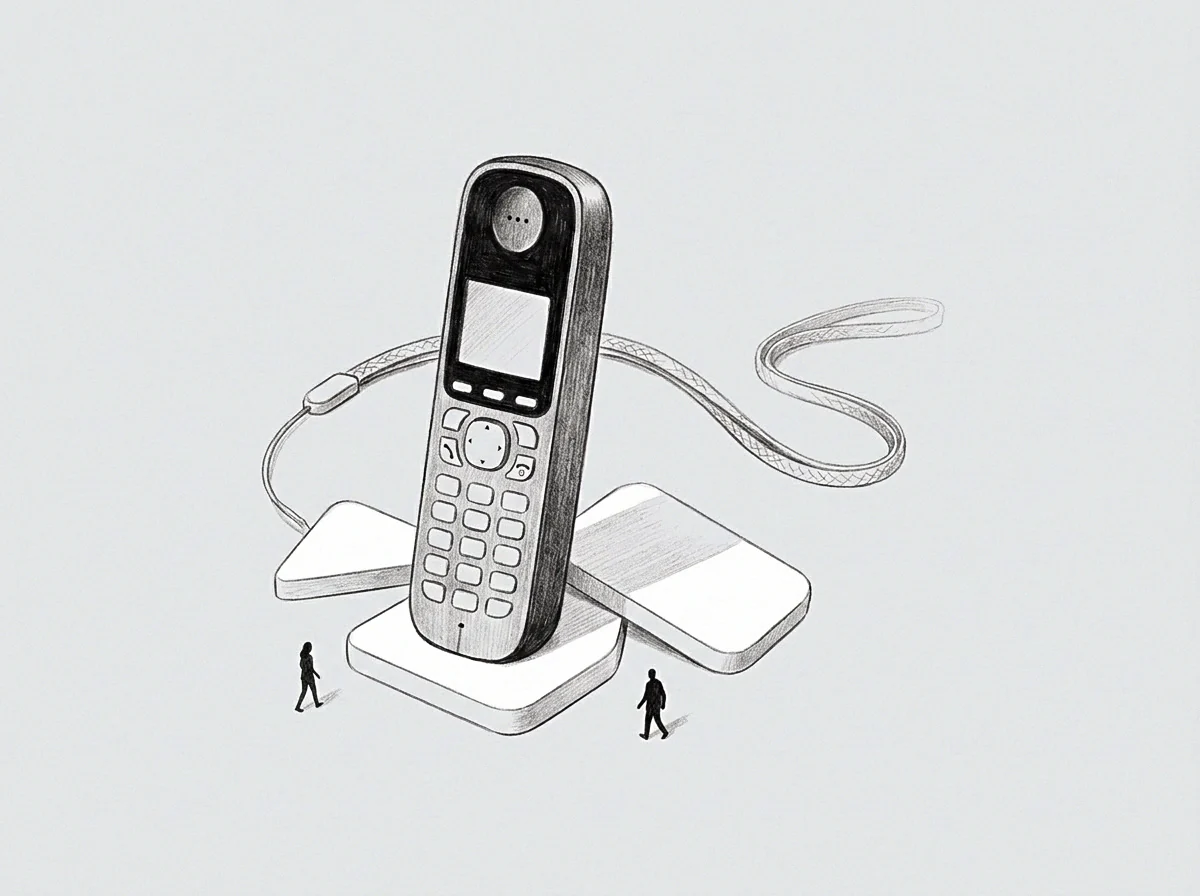
Intake
Deploying fresh funding into an atrophied operating structure produces immediate organizational choke points. Leadership often attempts to cure multi-year capability deficits through aggressive recruitment campaigns. Rates escalate quickly.
Injecting capital into an organization with fractured deployment pipelines and missing documentation creates coordination chaos rather than productive output.
Rebuilding operational velocity follows a mandatory physical sequence that capital cannot bypass:
- Stabilize underlying continuous integration infrastructure before introducing external contributors.
- Codify existing production routines into accessible documentation so incoming personnel can self-onboard.
- Recruit anchor individual contributors who accept technical debt remediation as their primary objective.
- Pilot narrow, low-risk product experiments to re-establish broken feedback loops between design and delivery.
- Expand outward customer discovery initiatives only after internal release cadences achieve predictable reliability.
Rebuilding consumes reserves. When an organization injects twenty new developers into an architecture maintained by three burnt-out veterans, the immediate result is negative productivity. The existing engineers spend sixty percent of their working week explaining legacy workarounds to new hires rather than fixing the underlying issues.
The internal rate of feature deployment drops, causing executive teams to question the intelligence of their capital deployment decisions.
Onboarding velocity drops in proportion to the unaddressed technical debt present in legacy systems.
The labor market repricing creates severe internal friction during intake. Personnel who survived the cash conservation period work on equity arrangements or compensation tiers set during crisis conditions. New entrants demand market rates reflecting current talent scarcity.
The resulting internal compensation disparity damages morale, encouraging the very veterans who hold critical operational context to tender their resignations.
The new engineer looks at the unmaintained deployment scripts, points to the broken continuous integration suite, and explains that nothing ships until the foundation gets rebuilt from scratch.
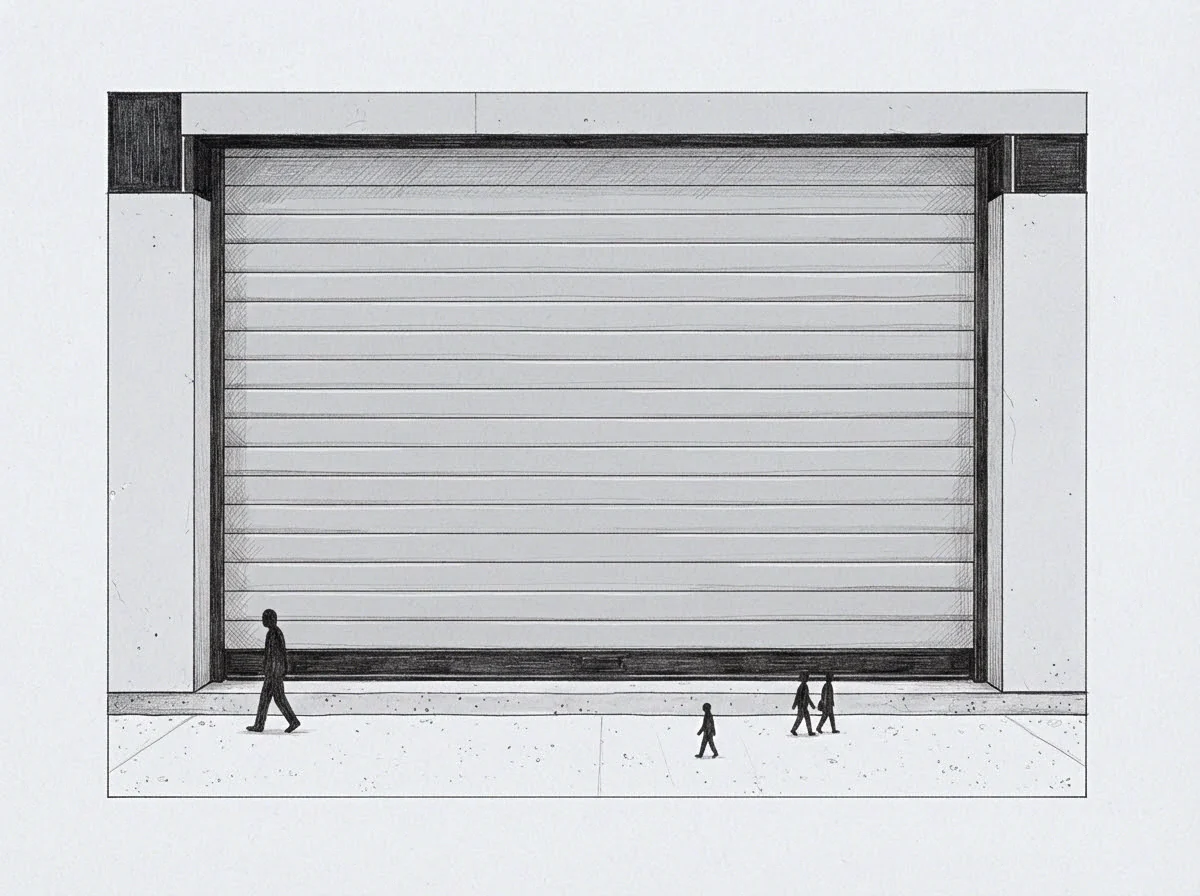
Pace
Governing the reconstitution of capability requires matching the recovery velocity to actual absorption capacity. Capital cannot buy velocity. The executive who attempts to recover four years of frozen innovation in four quarters simply blows apart the remaining institutional fabric.
Habits outlast austerity. When an operating team learns defensive triage, that psychological pattern persists long after funding constraints dissolve.
The room stays quiet. Execution slows down. Managing the recovery vector demands establishing sustainable setpoints that allow engineering and product teams to rebuild institutional confidence incrementally.
Initial projects must remain modest in scope, prioritizing pipeline health and release predictability over ambitious market promises. Pushing teams to execute high-stakes product launches before operational reflexes recover creates cascading release failures that reinforce historical organizational trauma.
Capacity recovers through repetitive operational success rather than aggressive management targets.
Leadership monitors recovery by tracking internal drag metrics: the cycle time from code commit to production verification, the onboarding duration required for new engineers to merge their first bug fix, and the elapsed time between customer feedback and product adjustment. When these operational indicators improve, the capability vector ascends. Rebuilding true enterprise resilience is a gradual physical reconstruction that yields durable operating margins only when patience governs capital deployment.
A team moves forward safely only when its operational recovery matches its real rate of internal learning.