
Detecting Hidden Fault Surfaces In High Throughput Systems
High throughput systems mask state corruption behind stable mean latencies until invariant output payloads signal un-evaluated cached responses.

Wire
High-throughput infrastructure masks internal failure planes by running processing threads against decoupled asynchronous queues. When message velocity exceeds ten thousand operations per second, worker pools absorb execution delays without raising immediate error codes. Mean latency metrics smooth out isolated thread panics, payload drops, and corrupted state mutations.
The telemetry collector aggregates execution durations over sixty-second intervals, concealing micro-stalls under fifty milliseconds. Continuous incoming traffic converts structural degradation into growing queue depth, keeping the surface stable until queue capacity saturates completely.

Aggregated Telemetry Masks Silent State Corruption
Centralized metric collection relies on arithmetic averages that obscure extreme percentile behavior. When ninety-nine percent of incoming requests resolve within five milliseconds, the remaining one percent can fail entirely without shifting the aggregate performance index. That silent percentile often carries the actual fault surface.
In memory-mapped storage backends, page lock contention causes thread starvation under specific key distribution patterns. The processing node continues acknowledging inbound socket writes while failing to commit underlying transaction logs. The system records zero socket-level rejections during the micro-stall, masking database writes hitting invalid memory pointers.
The evaluation window dictates whether state divergence appears in health checks. Standard diagnostic routines poll endpoint responses every thirty seconds. If a worker process hangs for eight seconds, resets its internal state, and resumes queue draining within the polling gap, the status indicator stays green.
The baseline remains uncorrected because the sampling interval is wider than the fault duration. Setting a maximum queue latency boundary of fifteen milliseconds forces the load distribution layer to flag uncommitted worker threads before memory fragmentation halts the node.

Mask
Caching mechanisms obscure processing failures by returning pre-computed values when execution pipelines stall.

Why Do High Rate Buffers Obscure State Drift?
Worker threads under saturated network traffic reuse volatile storage values to maintain outbound response rates. When upstream dependencies fail or time out, aggressive read-through caches supply stale data payloads without triggering failure callbacks. The downstream caller receives valid HTTP status codes while the internal state engine operates on outdated pointers.
An invariant output payload emitted during fluctuating write traffic serves as the primary diagnostic signal for cached evaluations replacing live computations.
An invariant output payload emitted during fluctuating write traffic indicates that the storage tier has bypassed active state evaluation.
When mutation requests enter a high-throughput stream, live evaluation requires compute allocation for schema parsing, validation logic, and disk persistence. If input data structures change while output latency remains static to the microsecond, the node retrieves an old cached object instead of evaluating the payload. A diagnostic test forces un-cached mutation payloads into the incoming queue to observe whether execution time shifts.
Because a live computation varies with input complexity, a system relying on cached fallbacks returns identical timing metrics regardless of payload size or structure. Accepting invariant latency metrics during structural API changes leaves latent pointer corruption unmitigated until full database failure forces an uncoordinated cold restart.

Friction
Operational overhead increases rapidly when diagnostic probes attempt to capture transient faults inside saturated execution paths. Consider two messaging node clusters running fifty thousand concurrent WebSocket connections across identical network hardware. Cluster A relies on batch log ingestion processed every ten minutes, while cluster B injects continuous synthetic probe events into worker threads every five hundred milliseconds.
If both systems experience a fifteen-percent hardware interrupt spike caused by network card buffer overflow under peak load, cluster A’s arithmetic mean response time stays at seven milliseconds, hiding a two-percent packet drop rate that corrupts session state tokens. Cluster B detects payload state mismatches within two seconds of the interrupt, flagging worker process starvation before corrupted tokens propagate to user databases. The continuous probe overhead consumes three percent of total compute capacity, whereas cluster A spends forty hours of engineering allocation recovering corrupted records.
| Evaluation Approach | Detection Window | Overhead Vector | Silent Failure Risk |
|---|---|---|---|
| Continuous Synthetic Probes | 500 Milliseconds | 3% Compute Allocation | Negligible Payload Drift |
| Batch Telemetry Aggregation | 600 Seconds | 0.2% Compute Allocation | Unmonitored State Loss |
A polling gap exceeding thread recovery time converts systemic memory starvation into unrecorded dropped requests.

Failure Modes in Message Stream Architectures
Worker node pools exhibit distinct degradation patterns when queue ingestion velocity surpasses network serialization capacity.
- Thread Starvation Lockout occurs when lock contention on shared memory structures prevents worker processes from pulling pending tasks from incoming queues.
- Buffer Overflow Discard happens when inbound socket queues reach maximum memory capacity and silently drop incoming payload frames without firing socket reset flags.
- Stale Cache Fallback Injection occurs when micro-services encounter database timeouts and return expired state payloads to prevent HTTP gateway connection drops.
- Desynchronized Log Mutation manifests when secondary storage replicas fall behind primary write operations, creating state divergence across concurrent execution paths.
Synthetic probes consume unnecessary memory bandwidth during peak operational windows.

Partition
Isolating network hardware degradation from internal application logic requires structured synthetic inputs that stress specific thread paths.
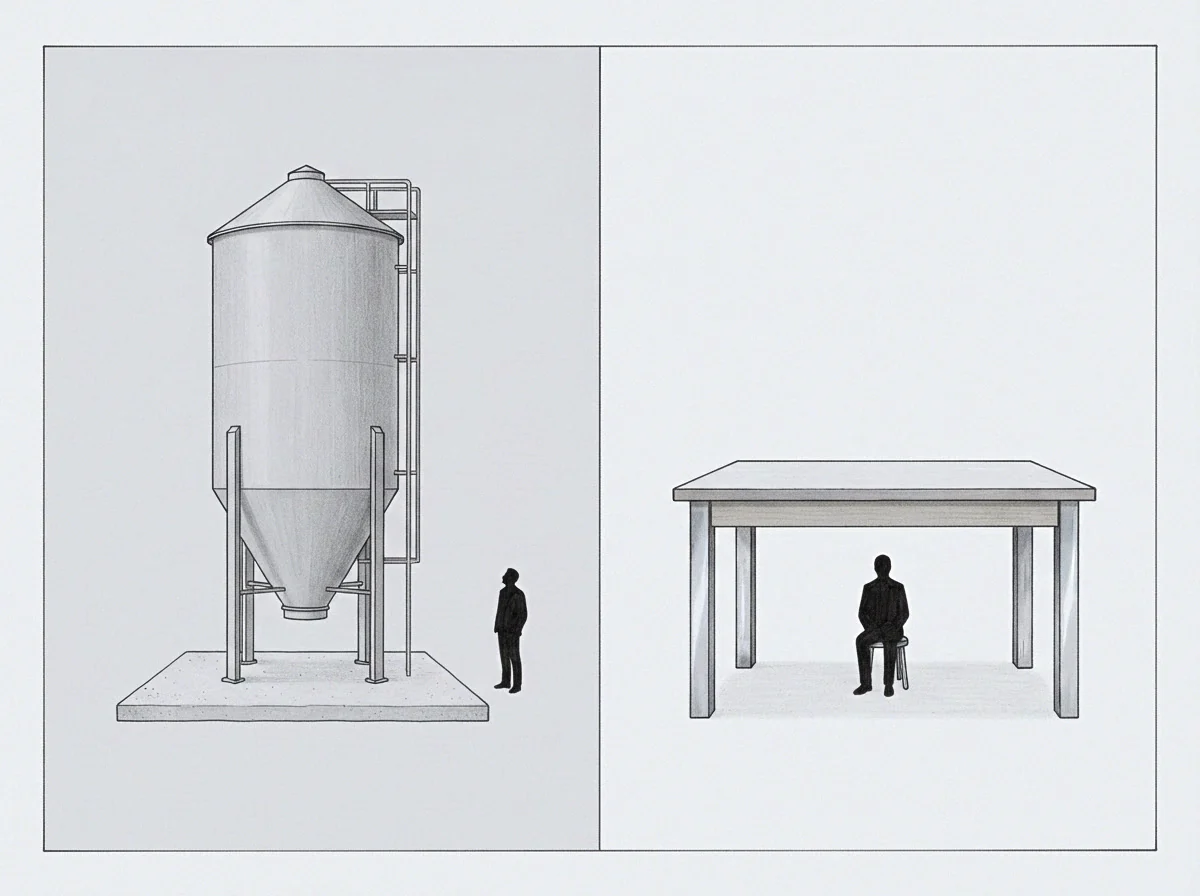
Diagnostic Verification Sequences for Saturated Clusters
Isolating hardware execution stalls from application memory leaks depends on injecting calibrated test vectors into execution pipelines. Just as high velocity in fluid channels conceals internal turbulence until friction causes boundary separation, high-throughput streams mask execution stalls until payload mutations force non-cached computations. Operators run structured verification steps to force live path execution.
Observing latency variation during input payload mutations confirms that execution paths remain un-cached and functional.
- Inject Variable Payloads into inbound worker queues to force live path evaluation across all serialization layers.
- Record Baseline Latencies across distinct payload sizes during baseline traffic windows to set normal distribution boundaries.
- Measure Execution Spikes at the ninety-ninth percentile to identify micro-stalls before worker processes drop active socket connections.
- Evaluate Thread Memory Usage during sustained execution bursts to pinpoint allocation failures prior to process crashes.
A delta reading shows drift when dynamic trace sampling rates exceed one hundred thousand operations per second, introducing telemetry dropping risks that current benchmarking literature cannot resolve. Under this uncertainty, operators maintain fixed sampling rates on ten percent of worker threads and rely on hard execution timeouts to trigger node isolation. Whether distributed tracing overhead can be reduced during high-concurrency event bursts without obscuring tail-latency fault surfaces remains open for experimental validation.
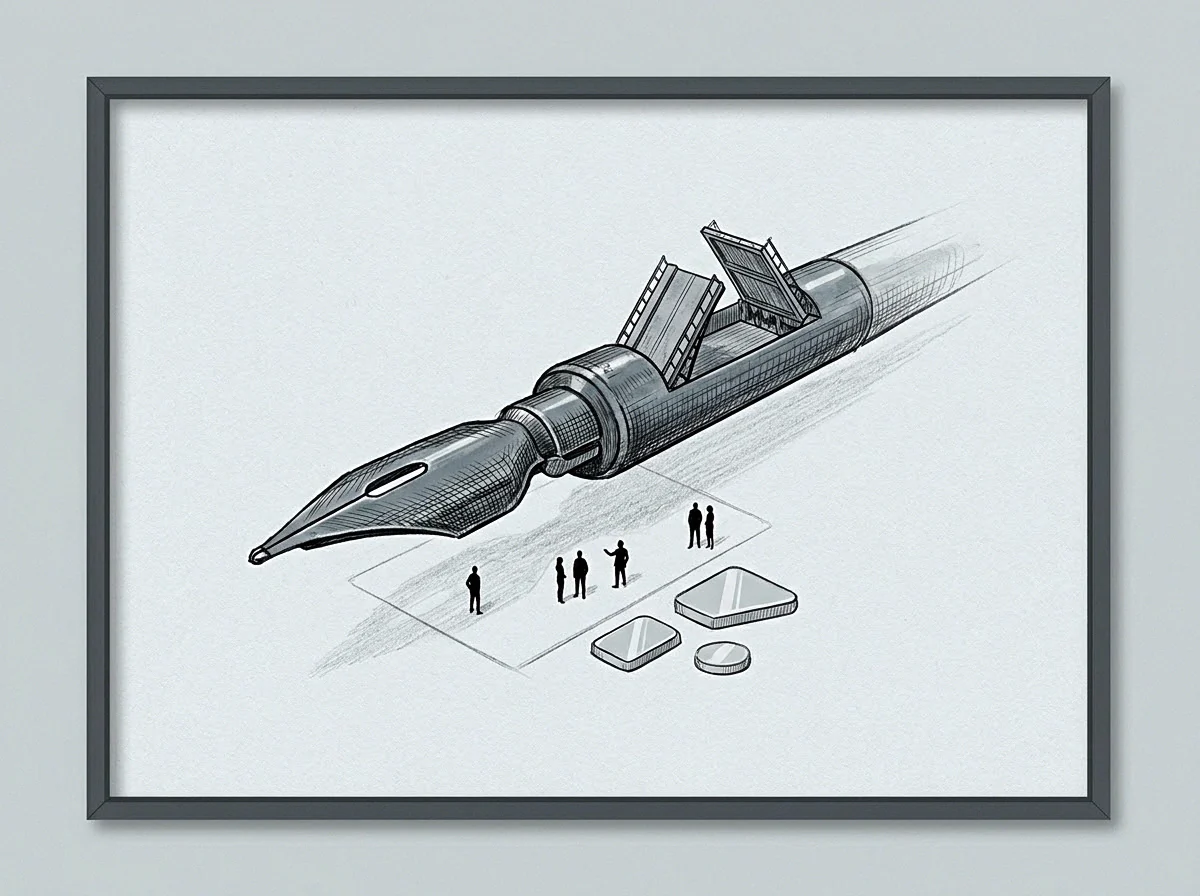
Circuit
Implementing automated boundary controls prevents degraded nodes from accepting traffic while executing recovery sequences.

Establishing Baseline Probes in Saturated Environments
Measuring response delta against pre-recorded performance profiles reveals structural queue degradation.
Systems operating near hardware limits conceal state corruption until thread pools exhaust available virtual memory allocations.
Continuous calibration relies on comparing real-time operational metrics against a reference class recorded during stable baseline windows. When a high-throughput message bus processes hundreds of thousands of transactions per second, operators rely on automated health signals rather than manual dashboard reviews. Injecting synthetic tracing tokens into inbound queues exposes processing delays instantly.
The delta between normal compute time and degraded execution time identifies fault surfaces before infrastructure collapses. Measuring delta values over a five-hundred-millisecond baseline window provides enough lead time for load balancers to re-route incoming sockets. Dropping degraded nodes from active pools isolates structural failures before corrupt state commits to distributed storage.
Operators record baseline delta metrics continuously to detect underlying storage stalls before high request rates overload backup recovery instances.