
Quantifying Structural Variance Between Trailing Economic Baselines and Live Execution Vectors
Structural variance occurs when trailing financial metrics lag live operational execution vectors, requiring window alignment to read true directional momentum.

Divergence
An executive board reviews a quarterly income statement reflecting expanded enterprise software sales signed two quarters prior, while daily operational telemetry records a continuous drop in active platform transactions. The trailing income statement records cash flows from past agreements. The live telemetry records current user activity, system interaction rates, and immediate operational consumption.
When historical financial reports indicate expansion while active software interactions decline, decision makers rely on stale signal streams. The vector turns before the income drops. Historical accounting reflects completed exchanges.
Trailing balance sheets obscure live operational friction. Current burn rates accelerate silently.

Financial Accounting Lags Operational Direction
Standard accounting practices record economic activity after specific contractual performance obligations take place. This structural delay produces an administrative buffer between operational changes and reported cash flows. A customer enterprise may reduce daily internal utilization of a software product by half over sixty days while scheduled contract invoices continue to clear bank accounts without interruption.
The financial reporting layer presents a stable baseline because contractually committed payments arrive on time. The underlying execution vector displays severe downward trajectory as user churn accelerates inside the active billing cycle.
A board reviewing trailing balance sheets sees historical activity while operational burn reflects present trajectory.
Measuring performance through trailing economic indicators introduces a systematic lag into operational decisions. Operational feedback loops require real-time signals to adjust resource deployment, software engineering priorities, and client coverage models. Relying on ninety-day billing summaries creates an uncalibrated control system where corrective actions take place months after operational trajectory shifts.
The delay between operational decay and financial reporting generates invisible structural variance inside commercial ventures.
Quantifying this structural variance demands a dual-window evaluation schema. The primary window captures the trailing economic baseline through recognized revenue, gross margin percentages, and audited operating expenditures over twelve months. The secondary window measures live execution vectors using daily active user ratios, operational API response volumes, continuous unit delivery costs, and net support ticket resolution times read over fourteen-day intervals.
Comparing the direction and rate of change between these two distinct observation windows reveals operational variance before standard audit metrics reflect the shift.

Measuring the Delta Across Disparate Measurement Windows
Calculating the delta between trailing baselines and live execution vectors involves comparing cardinal financial quantities against ordinal operational indicators. Financial statements measure total dollar values across fixed calendar periods. Live execution vectors measure the rate and direction of operational activity across continuous rolling windows.
Comparing cardinal financial gains against declining ordinal usage trends identifies structural misalignment inside an enterprise.
When an enterprise observes expanding revenue figures alongside declining operational interaction metrics, the underlying unit economics face impending deterioration. Capital allocations based on trailing accounting stability dilute future operational capacity by supporting stagnant customer segments. Treating historical revenue growth as confirmation of current operational health leads to delayed cost adjustments, misallocated software development resources, and sudden capital depletion when lagging financial reports finally align with operational reality.

Gradient
Evaluating enterprise trajectory requires measuring the directional rate of change across active operational channels. Cardinal financial totals record cumulative history, whereas ordinal operational vectors indicate immediate trajectory. An enterprise generating ten million dollars in annual trailing revenue may experience an operational gradient that points directly toward user attrition and margin compression.
Tracking active directional gradients provides early signal clarity long before accounting ledgers register financial losses.

Directional Velocity Versus Historical Revenue Accumulation
Operational velocity measures the speed and alignment of active execution tasks. When software delivery velocity, customer onboardings, and platform transaction rates slow down, the enterprise gradient turns negative regardless of past cash collection records. The feedback loop requires synchronized windows.
Speed alone signals cached execution. Ordinal vectors measure directional drift. Static accounting hides active decay.
Directional variance alters future capital needs.
When live execution vectors decline while trailing revenue expands, capital allocations based on accounting metrics inflate hidden operating losses.
The setpoint determines error signal amplitude. Live metrics capture real time usage. The baseline provides the reference anchor.
Systemic divergence between trailing cash receipts and live execution gradients creates systemic mispricing of internal capital. Operating teams expand headcount based on historical quarterly revenues while customer engagement vectors decline. This structural divergence expands operational overhead at the exact moment operational output demands resource consolidation.

Operational Failure States in Trailing Baseline Drift
Unmonitored variance between historical financial performance and real-time execution vectors generates predictable organizational breakdowns. The following states highlight typical failure modes encountered when executive leaders rely exclusively on trailing accounting indicators:
- Capital Mismatch Resource allocations routed toward trailing revenue channels starve emerging execution vectors of operational capacity.
- Deferred Depletion Operational expenses registered in real time offset historical cash balances recorded in preceding financial periods.
- Invariant Velocity Signals Execution speed measured across surface operational tasks conceals zero net movement in underlying product adoption.
- Window Misalignment Telemetry read over fourteen days generates actionable direction while quarterly financial cycles obscure real-time decay.
Managing an enterprise by trailing balance sheets alone causes management to misinterpret operational slowdowns as temporary noise. By the time trailing financial statements show declining cash flows, the operational vector has maintained a negative slope for multiple quarters. Correcting operational trajectory under depleted cash reserves limits executive flexibility and forces severe structural restructuring.

Floor
Establishing an operational threshold protects enterprises from mistaking trailing cash flows for durable execution health. Setting a structured floor involves anchoring operational expenditures to live execution telemetry rather than historical revenue run rates. The following comparative table illustrates structural differences between trailing financial baselines and live execution vectors across essential organizational measurement axes:
| Measurement Axis | Trailing Economic Baseline | Live Execution Vector | Variance Impact |
|---|---|---|---|
| Measurement Scale | Cardinal cash accounting | Ordinal directional trajectory | Lagged capital commitments |
| Feedback Latency | Ninety-day audit cycle | Real-time daily event stream | Unrecognized operational decay |
| Calibration Reference | Historical baseline accounting | Live usage vectors | Distorted resource allocation |
| Error Signal Generation | Post-hoc balance sheet correction | Continuous operational feedback | Delayed structural adjustment |

How Does Variance Predict Baseline Atrophy?
Divergence between accounting metrics and active user vectors functions as a leading indicator of revenue atrophy. When platform telemetry displays persistent drops in user task completion rates, customer account cancellation notices follow three to six months later. Operational decay precedes contract non-renewal.
Tracking live user interaction gradients allows team leaders to identify failing customer implementations while contract revenues remain nominally intact on trailing statements.
An uncalibrated measurement window masks underlying structural decay until capital exhaustion forces recognition.
Checking live operational signals for invariant output signatures separates superficial task activity from authentic user engagement. Invariant output occurs when engineering teams submit high code commit volumes or client services log numerous client touchpoints without producing improvements in platform usage metrics. High operational activity combined with flat user trajectory signals a cached execution pattern.
Real operational progress produces measurable variation in downstream customer retention vectors.
Measuring execution vectors requires evaluating whether active operational outputs respond dynamically to new input variables. When operational units return identical productivity throughput metrics despite shifts in customer demand or market conditions, the underlying execution relies on retrieved routines rather than live computational adaptation. Identifying cached routines allows management to recalibrate operational workflows before structural baseline atrophy undermines enterprise stability under a stated limit on available capital reserves.

Draft
Take a software venture operating with twenty engineers, five customer success managers, and three million dollars in annual recognized trailing revenue. The trailing accounting baseline reflects twenty percent year-over-year revenue growth based on contracts signed twelve months ago. Daily platform telemetry over the last forty-five days shows active account usage dropping by thirty-five percent, while customer support resolution hours double due to recurring product defects.
The primary financial metrics report stability, while the live execution vectors display rapid operational degradation. Unit economics deteriorate during volume gains. Static operational budgets continue funding customer acquisition channels that deliver continuously declining user retention rates.

Isolating Invariant Velocity from Live Computational Adaptation
To resolve the divergence between trailing accounting statements and live execution velocity, operational leadership applies a structured four-stage calibration sequence:
- Record the trailing baseline economic performance over a sixty-day observation window.
- Map daily operational execution vectors against concurrent resource consumption.
- Calculate the structural delta between financial trajectory and operational velocity.
- Adjust allocation limits before quarterly financial audits expose cumulative losses.
Live execution speed without directional movement indicates cached operational response rather than genuine computational progress.
Evaluating execution vectors through continuous window alignment prevents enterprises from over-investing in declining business segments. When live execution data reveals negative user trends, executive teams reallocate engineering resources to address retention bottlenecks before standard accounting ledgers register financial losses. Operating with synchronized measurement windows ensures capital allocations correspond with active operational momentum rather than past commercial achievements.
Unadjusted operational plans lead counterparty investors to question internal management controls. Board members reviewing quarterly financial statements expect operational trajectories to match historical revenue growth. Presenting real-time execution vectors alongside trailing baseline statements demonstrates rigorous internal governance and provides early justification for strategic operational shifts.

Yield
Aligning trailing accounting records with live execution vectors stabilizes enterprise capital deployment. Establishing an accurate reference class requires gathering historical performance data from comparable commercial ventures operating under similar market conditions. Operators lacking a relevant reference class often misinterpret initial operational speed as sustainable economic momentum, leading to uncalibrated expenditure commitments.
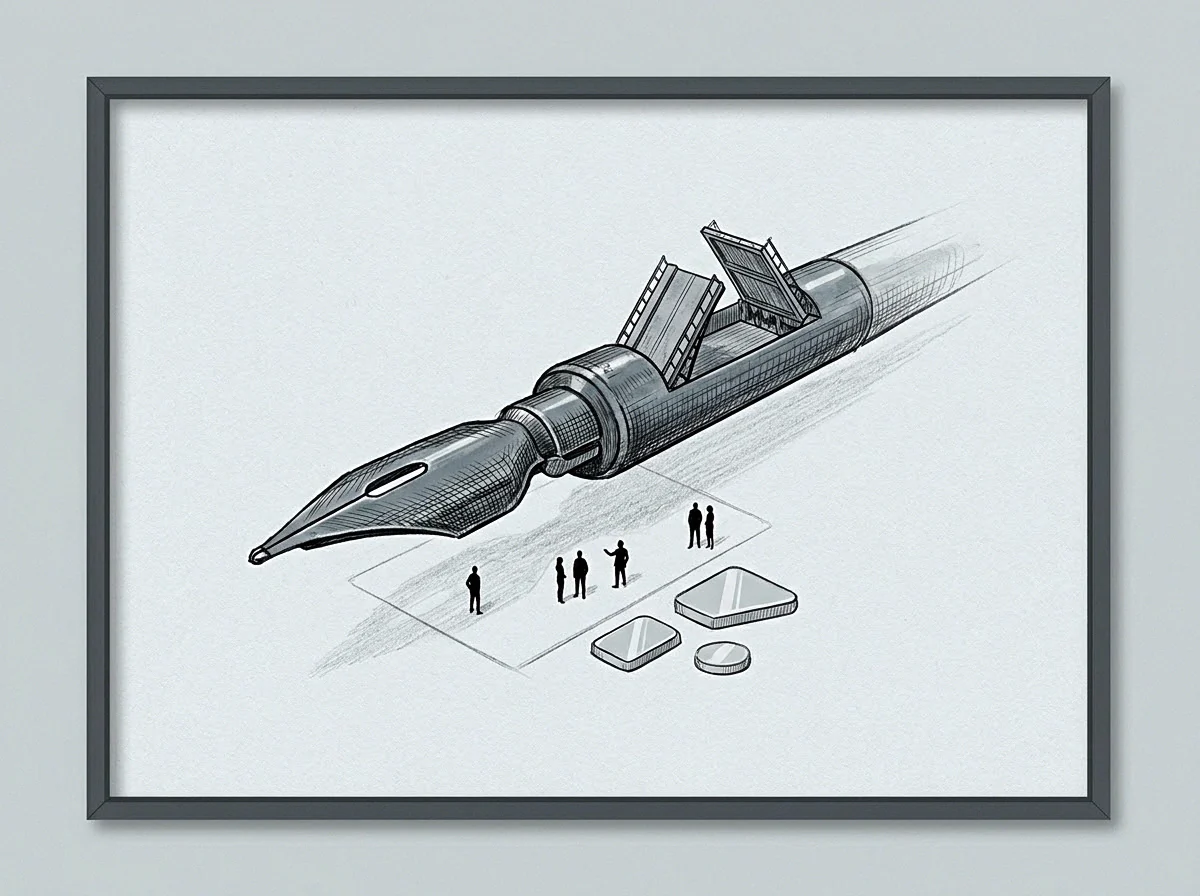
Establishing Reference Classes for Window Calibration
Building a robust reference class involves documenting baseline performance metrics across multiple product launch cycles and market environments. Comparing internal execution vectors against established reference class data enables teams to distinguish normal operational friction from structural performance decay. Calibration improves as operators record baseline figures over extended windows, creating reliable benchmarks for future resource allocation decisions.
Under explicit market uncertainty, where live execution signals contradict trailing financial records and reference class data remains limited, a careful operator implements bounded capital allocation limits. Rather than committing multi-year budgets based on lagging revenue receipts or volatile short-term telemetry, leadership conditions funding releases on verified directional alignment between operational usage vectors and financial margins. Setting strict observation windows prevents uncalibrated operational expansion while preserving necessary capital reserves.
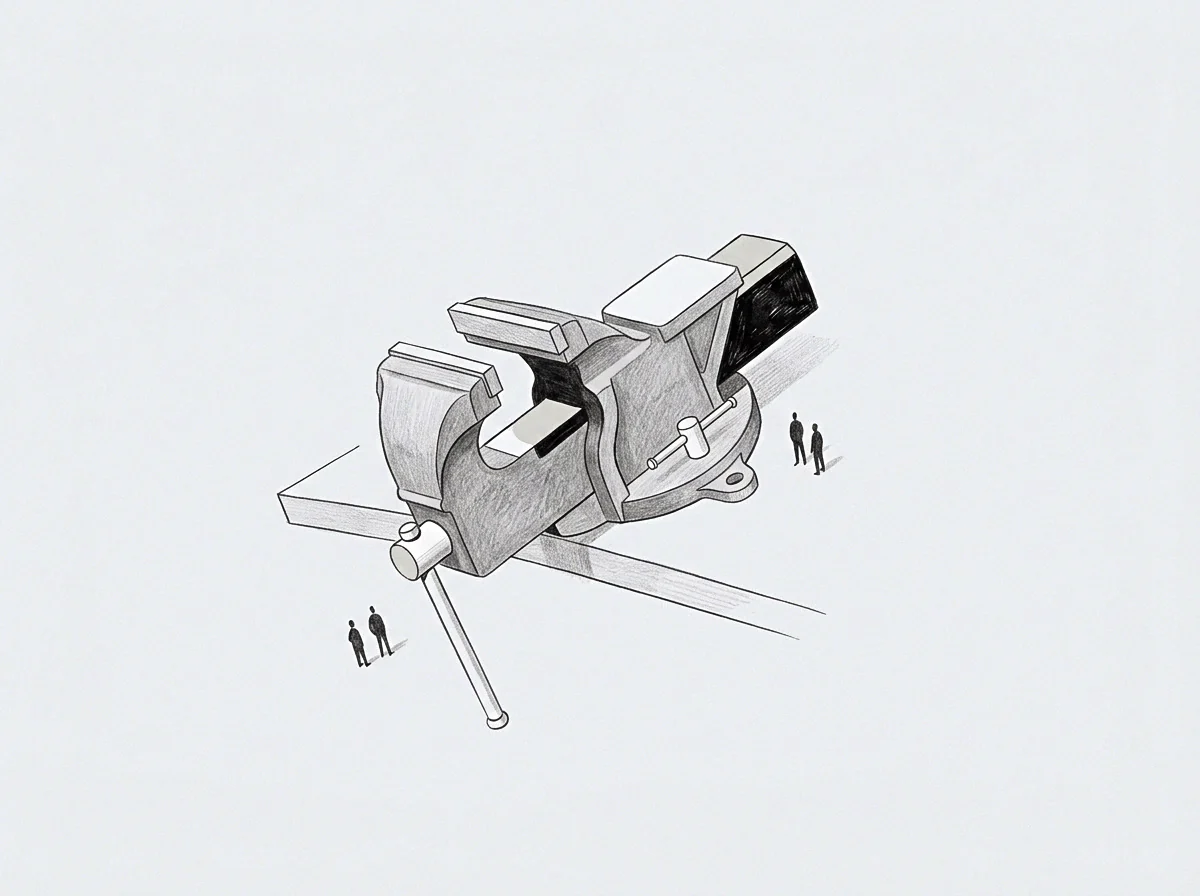
Reconciling Lagging Audit Metrics with Active Direction
Reconciling trailing financial baselines with active execution vectors transforms enterprise planning from a reactive review into a proactive control system. Continuous tracking of operational gradients provides clear visibility into emerging efficiency trends, allowing management to make timely adjustments to staffing, product development, and customer engagement models. Integrating live execution data with standard financial reporting bridges the gap between historical accounting and present operational reality.
Maintaining long-term commercial viability depends on an enterprise’s structural capacity to detect and correct operational drift before trailing financial balance sheets reflect irreversible decay. Organizations that continuously measure execution vectors against trailing economic baselines maintain tighter operational discipline, allocate capital more effectively, and adapt rapidly to shifting market demands.
What structural measurement criteria should an enterprise establish when live execution vectors indicate rapid operational expansion while trailing economic baselines record persistent financial cash burn?