
Calculating Ascent Gradients From Observed System Least Resistance Trajectories
Ascent gradients are calculated by identifying observed paths of least resistance, quantifying the unspent volume of avoidance, and inverting the directional vector.
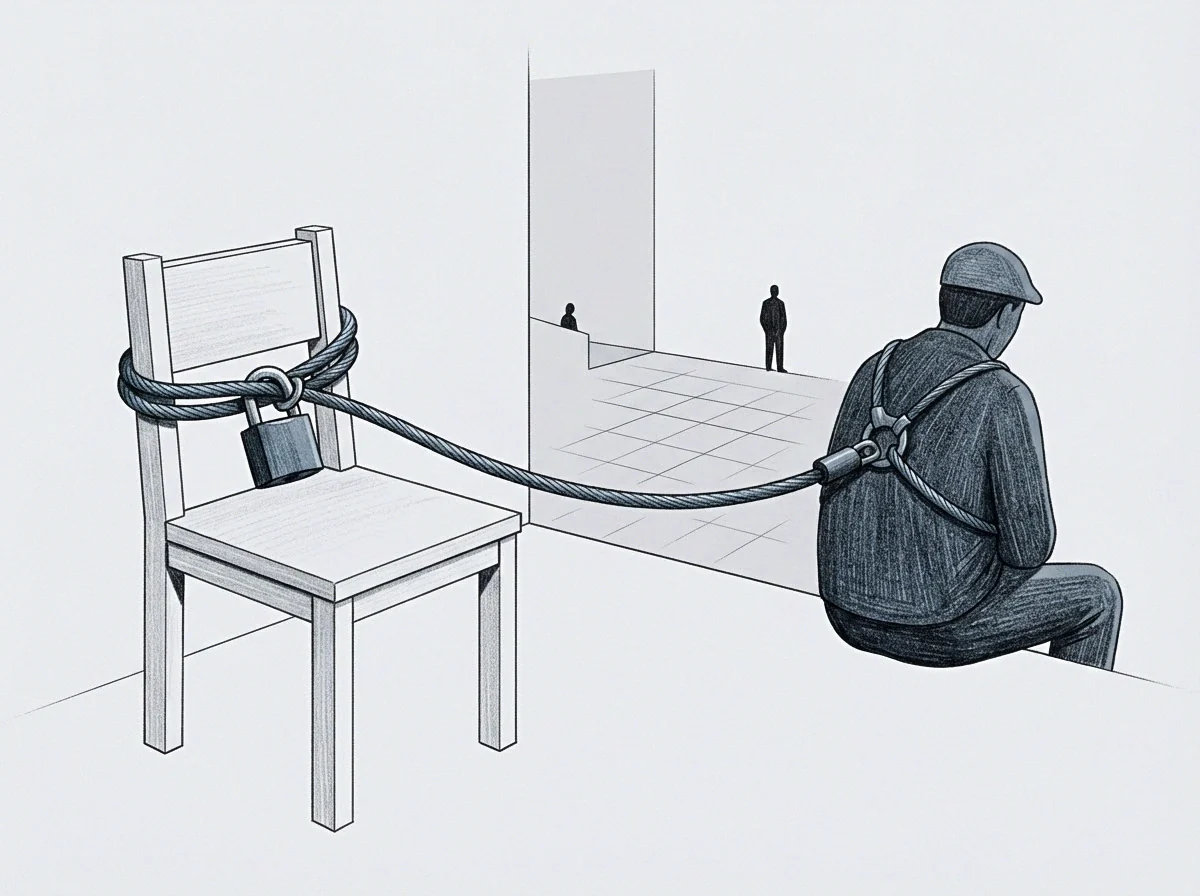
Weight
An operator logs eighty hours of engineering time spent patching an obsolete database wrapper while the schema specification sits untouched on the desk. Backlog tickets clear, sprint velocity looks steady, and the team moves down an easier slope. Every custom script, manual reconciliation, and local patch traces that line of least resistance.
Immediate operational effort stays low because the organization runs on familiar habits rather than absorbing the disruption of a structural rebuild. Adding up those bypasses shows the exact slope of the debt to be cleared.
Gradient descent describes how an operating structure bleeds potential energy by dropping down whatever local slope offers the least resistance. In numerical optimization, this behavior minimizes a loss function efficiently. In production teams, that descent trades immediate friction for accumulating deferred liability.
An operator who watches what staff systematically route around gets an accurate map of the operating terrain. That vector carries a real magnitude: the total volume of avoided core work multiplied by the frequency of the detours built to bypass it.
A system operating along the line of least resistance reveals the exact geometry of the energetic barrier it refuses to climb.
Calculating an ascent path means taking the negative vector of that descent and projecting it back up from the baseline. The slope is not an evaluation of failure; it is an ordinal reading dictated by environmental constraints. When a team spends forty hours each month calming an erratic account instead of renegotiating the scope, it traces a measurable downward vector.
Inverting that vector specifies the precise friction, administrative effort, and operational rearrangement required to enforce formal terms.
Treating avoidance as random noise rather than an operational measurement produces arbitrary initiatives that collapse against the real contours of organizational fatigue.
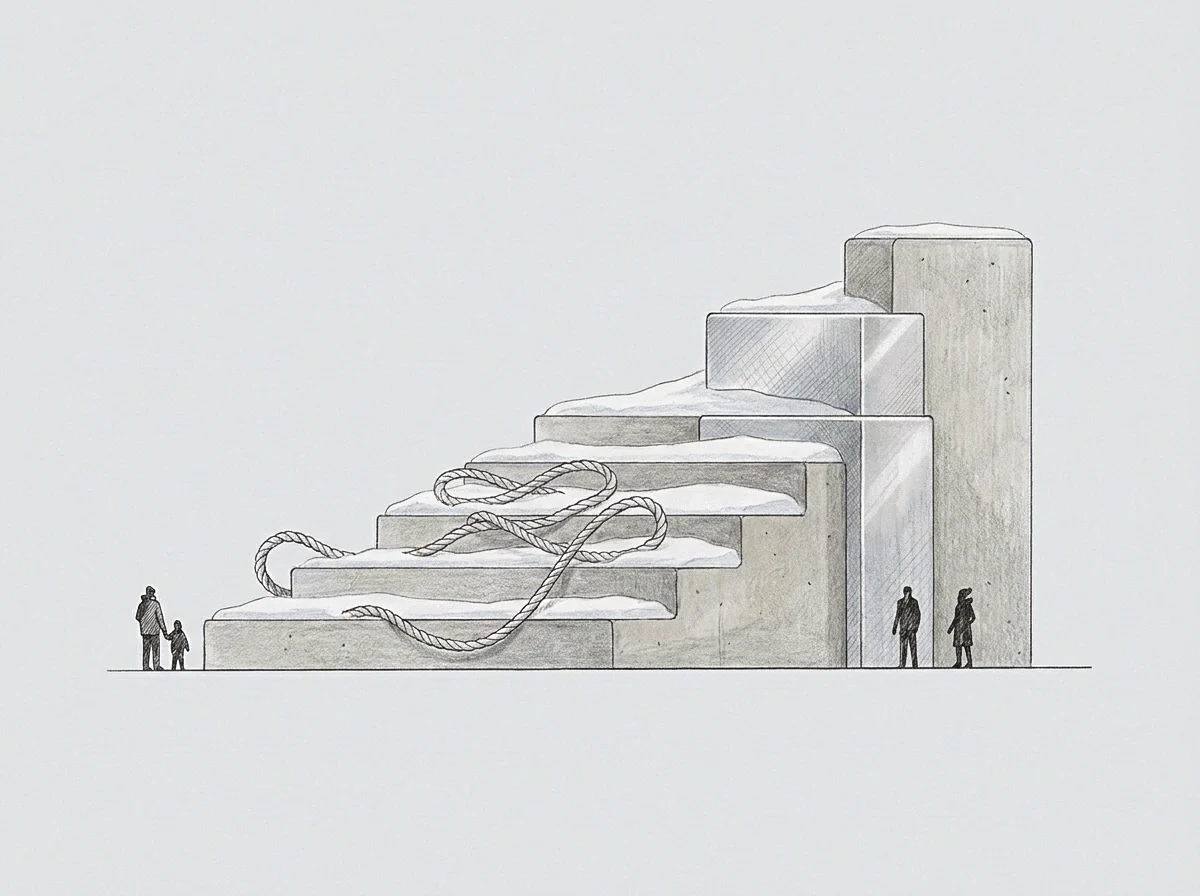
Seat
Observed Behavioral Baselines Across Stated Limits
The desk absorbs the posture of avoidance long before the quarterly figures show a deficit. When an executive steps in to rewrite drafts rather than holding contributors to editorial standards, that habit sets the baseline. The easiest local path is simply to do the work oneself.
The cost shows up in fragmented executive attention, lost working hours, and quiet permission for the team to submit incomplete drafts. That descent is visible in the calendar invites that multiply around simple approvals.
Tracking these detours over a twelve-week cycle shows the true baseline. This baseline is the steady-state operating cost required just to keep things where they are, without structural progress. Founders frequently mistake this motion for real output.
The difference is whether an action alters underlying operational parameters or merely absorbs the drag of an unchanged system. Servicing drag burns hours and attention while the ascent rate remains at zero.
A team calculating ascent vectors from unmeasured baselines expends capacity without changing its structural altitude.
Working out the upward gradient requires an accurate record of displaced capacity. If three senior contributors spend fifteen hours weekly managing internal scheduling friction, that forty-five-hour block represents forty-five units of latent capacity tied up in defensive maintenance. Calculating the ascent gradient means pairing those hours directly with the structural intervention that eliminates the scheduling interface altogether.
The difficulty of that overhaul reflects the scale of the original avoidance.
The terms governing client engagements required revision twelve months ago, before delivery commitments outpaced current capacity.
Offset

Whose Baseline Governs The Inversion?
Every operating structure carries a gap between its official org chart and its actual workflow. The chart shows high-priority work moving along milestones, but actual effort pools in defensive staging areas. The true gradient sits inside that divergence.
By noting where projects stall, slide into administrative busywork, or demand endless managerial check-ins, the operator locates the operational wall. That wall marks the boundary where progress becomes too expensive under current practices.
| Parameter | Observed Least Resistance Path | Calculated Ascent Gradient | Observed Delta Consequence |
|---|---|---|---|
| Client Scope Expansion | Absorbing unbilled feature requests to prevent interpersonal tension | Executing contract amendments with explicit price adjustments per addition | Eliminates unpaid delivery hours and restores unit gross margins |
| Codebase Modernization | Deploying local patch scripts around decaying central architecture | Refactoring the foundational data layer across two isolated sprint intervals | Removes continuous error triaging and stabilizes deployment cycles |
| Executive Succession | Centralizing routine purchase sign-offs within the founder schedule | Establishing formal expenditure thresholds with delegated authorization limits | Recovers fifteen managerial hours weekly for strategic market analysis |
| Vendor Renegotiation | Accepting annual price indexation on underutilized service contracts | Auditing seat utilization metrics and serving formal consolidation notices | Reduces recurring overhead expenditures by twenty-two percent annually |
Translating an observed descent into an ascent vector follows a consistent operational sequence:
- Coordinate logging records the points where work stalls in favor of familiar, low-friction administrative routines.
- Magnitude calculation tallies the operational hours and capital consumed by the bypass over a ninety-day assessment window.
- Vector inversion reverses the direction of the bypass to trace the route of maximum constructive friction.
- Capacity reallocation directs those maintenance hours toward the structural intervention until the new workflow stabilizes.
When an operating agreement assigns technical risk entirely to one partner, the working gradient shifts toward constant oversight and defensive documentation.
Volume
Quantifying Latent Capacity Across Structural Deficits
Behind every entrenched operational detour lies a measurable reserve of latent potential. This capacity is not theoretical; it is an unspent volume equal in magnitude and opposite in direction to the energy burned maintaining the detour. When an enterprise burns two hundred thousand dollars annually in manual QA reconciliation to avoid confronting an unstable codebase, that capital marks the financial boundary of the ascent vector.
The total volume equals the operational cost of the habit multiplied by the time it has run unchecked.
An operator measures this volume by isolating where staff experience sustained strain. Friction in status meetings, defensive responses, and chronic procrastination are indicators of systemic resistance rather than personal shortcomings. Discomfort signals that the system has hit a steep boundary where existing routines no longer resolve the load.
Treating that discomfort as an objective coordinate allows the operator to calculate the ascent gradient with detachment.
Climbing difficulty matches the cumulative depth of the historical descent.
Consider a professional services firm with twelve partners where billing rates have stayed flat for four consecutive years. The descent shows up as circular debates over utilization, rising partner fatigue, and creeping overhead. The partners avoid the direct client friction of raising rates.
Here, the derived ascent gradient calls for formal communication to all active accounts establishing an eighteen percent rate adjustment. The friction of that single campaign mirrors the four years of accumulated margin erosion.
An ascent path holds only when the operational energy applied matches the measured depth of the deficit.
Tension
Execution Dynamics Along The Upper Boundary
Moving upward along an ascent gradient generates immediate pushback across an organization. Habitual inertia pulls the system back toward comfortable routines. When leadership insists on addressing deferred structural work directly, the friction spikes.
This is the boundary where the operating model has to expand its computational capacity. The operator maintains the line through that resistance, taking the friction as verification that the ascent gradient is accurate.
Practitioners debate whether avoidance always signals unaddressed structural debt or sometimes reflects an economical refusal to engage in unproductive battles. When an engineering team consistently bypasses a third-party analytics integration, that avoidance may stem from recognizing technical unreliability rather than resisting effort. The distinction turns on whether skipping the task causes downstream systemic decay or preserves working capacity for core development.
If downstream maintenance costs compound over successive quarters, the avoidance represents an unpaid structural debt that requires an immediate ascent path.
The field lacks definitive empirical models to predict how long a team can sustain peak ascent tension before regression occurs, leaving operators to test whether structural transitions are better executed in short, concentrated pushes or through sustained incremental climbs.