
Calculating Structural Potential Energy From Documented Organizational Friction Baselines
Documented organizational friction baselines derive structural potential energy by measuring the vector distance between formal compliance gates and shadow execution paths.

Desk
A production deployment log records nine consecutive days of delay at the security review gate. During this window, software engineers route urgent patches around the formal gate by invoking emergency infrastructure access tokens. The official queue dashboard shows zero backlog because tickets are closed upon token issuance, yet actual production stability degrades as unverified code enters main branches.
The system appears compliant on administrative balance sheets while accumulating unmeasured operational volatility.

Mapping Friction Baselines From Execution Logs
Every repeated administrative delay registers a measurable coordinate along the workflow axis. Documenting an organizational friction baseline demands capturing three distinct temporal figures: the waiting time before review begins, the processing time spent inside the approval gate, and the duration of post-approval verification. When these figures are logged continuously across ninety days, an empirical baseline emerges.
The baseline represents the steady-state cost of moving work through official channels. The compliance log records seven distinct handoffs.
Most organizations log approval durations as isolated performance indicators. This practice isolates human error from structural design. When compliance software logs an average delay of fourteen hours per security clearance, that figure functions as a baseline scalar.
If engineers construct an automated script to bypass manual sign-off, the scalar remains unchanged in official reports while execution diverges into undocumented subroutines.
An unmonitored administrative workaround establishes the actual execution path while the formal gate measures only compliance delay.

Tracking Clearance Holds and Operational Stagnation
Tracking the duration of clearance holds establishes an empirical dataset of operational stagnation. Administrative approval queues slow product release cycles. When handoffs stall, energy shifts from feature delivery to queue maintenance.
Manual overrides increase when queue latency rises. Engineers spend active hours pinging approval authorities, attending status synchronization calls, and updating tracking tickets. This diverted effort constitutes the kinetic overhead generated by the baseline friction.
Quantifying this overhead requires separating passive waiting time from active coordination time. Passive waiting time consumes organizational calendar duration without draining human capacity. Active coordination time directly consumes cognitive bandwidth that would otherwise execute core technical tasks.
Unprocessed handoff delays generate measurable structural debt. The authorization queue remains long because safety checks require thorough manual verification before signing off.

Slope
Calculating the direction of operational avoidance reveals how teams route work around structural friction. Work naturally moves along the path of steepest energy reduction. When an official compliance process introduces high friction, the path of least resistance shifts away from prescribed procedure.
The system executes a directional divergence, routing tasks through unmonitored channels, informal verbal agreements, or local tooling modifications.

Deriving the Value Axis from Execution Velocity
Operational output shifts whenever internal clearance overhead exceeds the energy required to construct an alternative path. The value axis defines the primary dimension along which organizational progress is evaluated, measured in verified functional releases per unit of time. Shadow paths emerge where policy gates stall.
When work encounters a high-friction gate, execution velocity drops along the primary axis. The resulting ratio between output velocity and administrative overhead establishes the local slope. Engineering hours shift toward informal coordination tools.
Research on organizational allostatic load rests on longitudinal observational data of software deployment cycles in mid-sized technology firms; if controlled experimental trials demonstrate that cognitive fatigue remains constant regardless of queue duration, this model’s reliance on time-based friction scalars would require fundamental revision. The vector direction indicates systemic work avoidance. The slope carries no moral weight; it merely describes the physical path chosen by actors operating under constrained bandwidth.
When internal approval latency exceeds the effort needed to build informal tooling, execution vectors divert entirely into undocumented channels.

Calculating the Resistance Gradient Across Internal Gates
Quantifying the rate of change across departmental handoffs establishes the steepness of the structural incline. High friction baselines store latent operational energy. The gradient descent path represents the exact trajectory of least effort taken by operators seeking to fulfill production goals despite administrative barriers.
Calculating this slope involves mapping the delta between formal protocol timelines and real-world execution durations across consecutive operational stages.
- Queue Stagnation Vector measures the continuous hours an asset remains parked between functional handoffs.
- Bypass Frequency Index records how often teams utilize undocumented channels to complete standard routines.
- Administrative Workaround Cost tracks hours diverted toward manual reconciliation when formal tooling stalls.
Formal process rules decay under high latency. When the resistance gradient becomes too steep, formal compliance mechanisms lose operational authority. Staff members stop attempting to optimize prescribed paths, focusing instead on perfecting informal bypass mechanisms.
Work consistently flows along the path requiring the least immediate coordination overhead regardless of published directives.

Volume
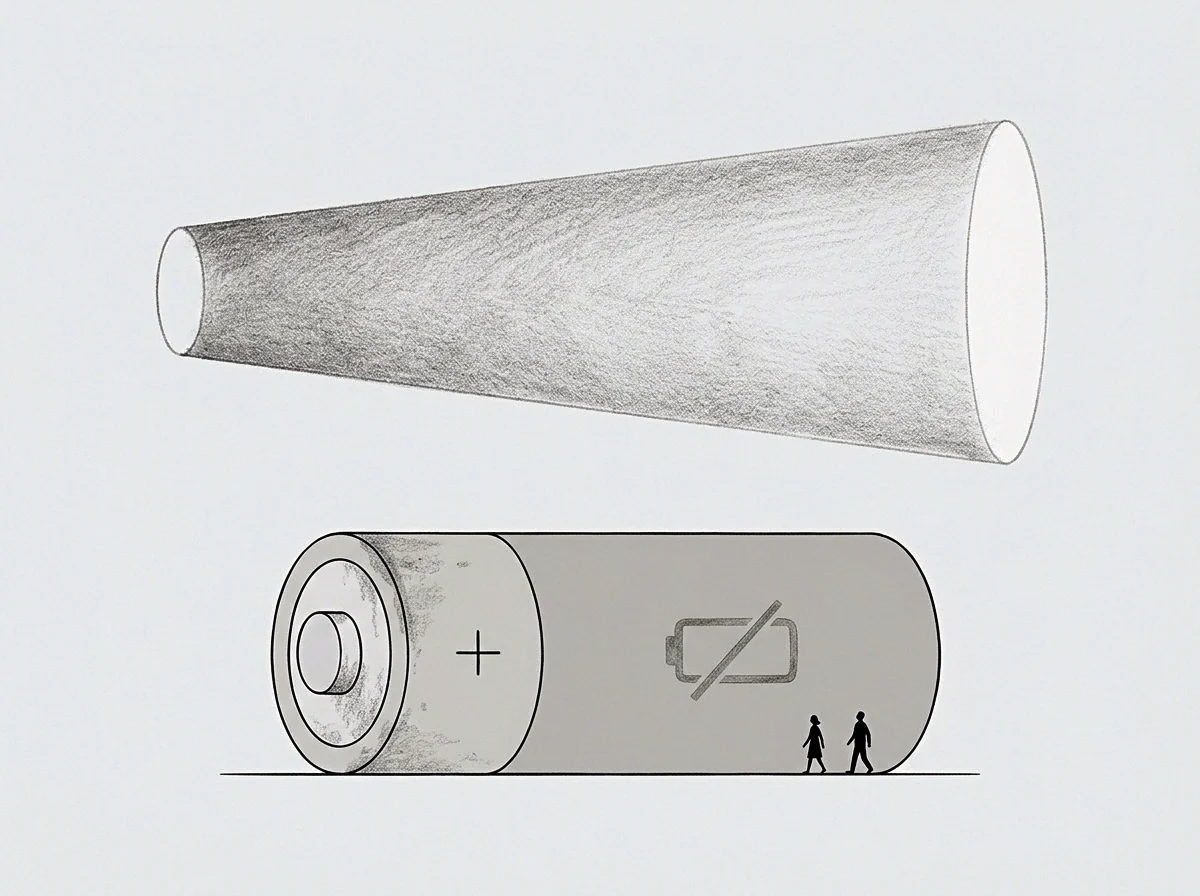
Mirroring the negative gradient above the operational baseline quantifies latent energy held within stalled systems. Avoidance acts as a coordinate marker. The magnitude of work routed around an administrative gate matches the magnitude of unprocessed operational potential accumulated behind that gate.
The volume of this latent potential defines the total unspent energy stored within the enterprise structure.
Inverting the Negative Vector Field
Inverting the measured rate of work avoidance reveals the exact magnitude of accumulated structural capacity. The baseline mirror projects the negative vector field into positive structural coordinates above the established baseline. Calculated potential energy reflects unspent operational volume.
This mathematical operation transforms documented friction into an exact figure representing stored energy waiting for release or collapse.
The quantitative relationship between work-around frequency and latent operational debt rests on audit logs from regulated financial environments; evidence showing that shadow processes produce equal or lower defect rates in safety-critical manufacturing would invalidate the assumption that avoidance always represents stored structural risk. When an organization ignores this unspent volume, hidden stress builds at structural seams.
A system operating above its friction baseline converts kinetic output into stored potential energy that discharges during structural reorganizations.

When Does Operational Friction Convert Into Latent Potential?
Energy accumulation occurs at the exact boundary where informal workarounds stabilize routine output. The latent potential represents the unspent work capacity held in suspense while teams wait for formal administrative clearances. When official gates block execution, teams store operational tension.
This tension takes the form of unmerged code branches, unreviewed vendor contracts, and unexecuted tactical decisions held in temporary storage queues.
| Operational Model | Primary Friction Baseline | Avoidance Vector Direction | Latent Potential Magnitude |
|---|---|---|---|
| Centralized Governance | Multi-stage approval queues | Off-platform shadow execution | High unspent capacity trapped in manual validation |
| Distributed Execution | Inconsistent cross-team schema synchronization | Duplicated local tooling builds | Moderate energy lost in structural redundancy |
| Hybrid Governance | Asynchronous gate friction | Selective policy compliance | Concentrated operational debt at organizational seams |
Budget allocations fail without structural friction metrics. Operating continuously with high stored potential energy creates structural brittleness. A slight alteration in corporate policy or executive leadership can destabilize informal workarounds, forcing accumulated latent energy to discharge suddenly across departmental boundaries.
Treating stored operational friction as simple inefficiency leads organizations to remove safety gates without absorbing the unspent potential energy, triggering immediate systemic collapse.

Scale
Measuring structural potential requires converting documented baseline delays into financial and capacity metrics. Operational energy calculations translate qualitative frustration into concrete vectors. This conversion provides an objective foundation for organizational restructuring, replacing executive intuition with measured potential fields.

Worked Calculation of Latent Energy Magnitude
Assume an organization operating with forty engineers where each software release encounters six hours of manual compliance checking. The formal release window occurs weekly, establishing a baseline delay of two hundred forty engineering hours per cycle spent in administrative hold. Assume further that twenty percent of participating engineers active during this window utilize administrative tokens to execute parallel local builds, completing testing four hours ahead of formal sign-off.
The calculation proceeds by isolating the shadow execution delta. The four hours saved by shadow execution across eight engineers yields thirty-two hours of unmonitored operational velocity. Multiplying this delta by the hourly burdened cost of engineering establishes the direct monetary magnitude of stored structural potential energy per release cycle.
The formula integrates delay scalars across all active operational boundaries.
- Establish the baseline duration of formal handoffs across a consecutive ninety-day recording window.
- Compute the average deviation between official process timelines and actual shadow path completion rates.
- Multiply the measured time delta by the fully burdened operational hourly rate of participating roles.
- Integrate the resulting scalar field across all departmental boundaries to obtain the total stored energy.

Ordinal Vectors Against Cardinal Accounting Figures
Financial metrics capture direct wage costs while ignoring the directional drag of unrecorded delay. Price operates as a cardinal figure, expressing exact financial compensation paid for hours logged. Cost functions as an ordinal vector, ranking execution alternative paths by relative friction density.
Confusing cardinal accounting figures with ordinal friction vectors masks structural potential energy. A department running within annual payroll constraints can simultaneously store massive latent energy through process stagnation.
The exact rate at which unspent potential energy decays when an organizational gate is permanently removed remains unquantified in current operational literature; under this uncertainty, the operator monitors weekly defect velocity for ninety days following any boundary alteration. High friction environments convert direct financial investment into stagnant administrative overhead. A formal baseline reset clause reallocates capital to internal gate automation whenever the calculated structural potential energy exceeds twenty percent of active engineering payroll.

Margin
Releasing stored structural potential energy demands controlled modification of existing organizational boundaries. Systems cannot collapse friction gradients instantaneously without risking catastrophic control failure. Controlled energy release requires matching the rate of boundary expansion to the organization’s capacity for absorbing newly liberated execution velocity.
Mapping the Model Boundary at the Wall
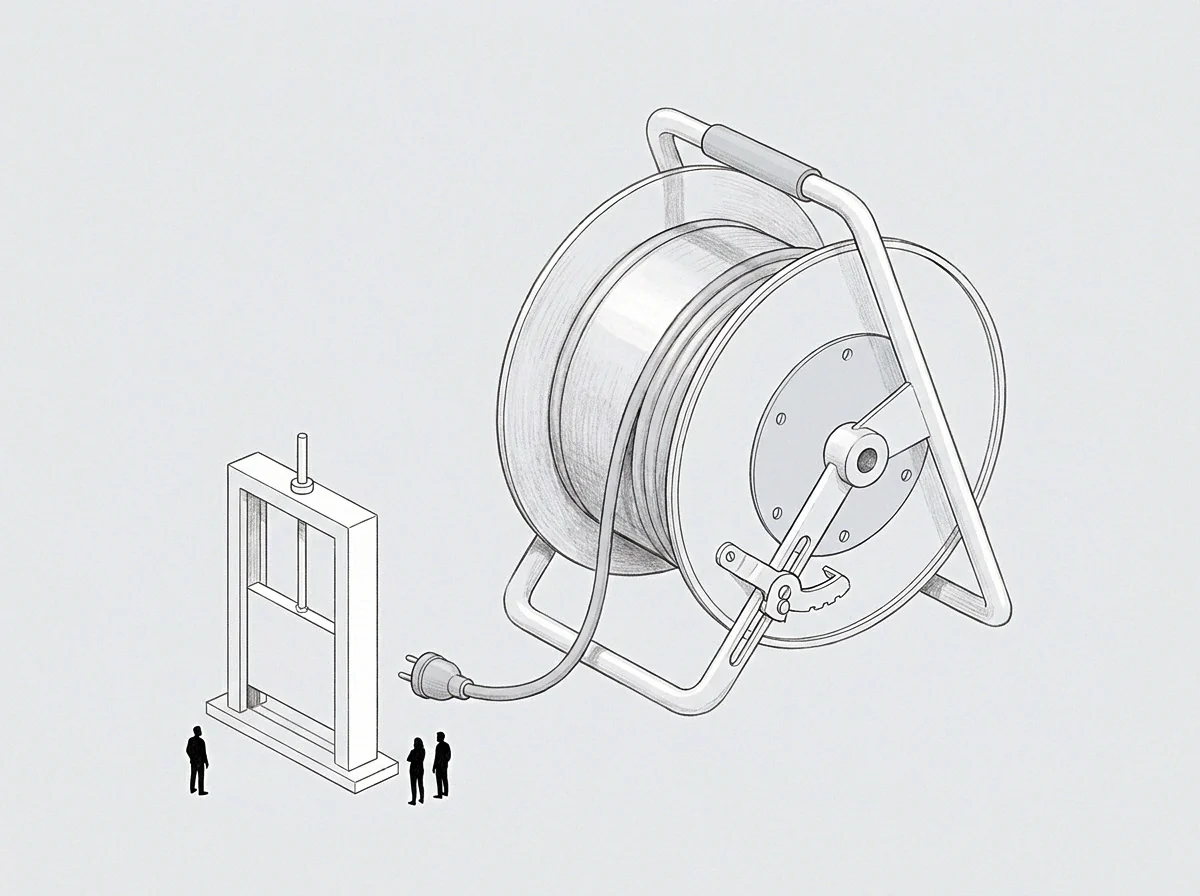
The outer limit of systemic operational endurance manifests where informal workarounds can no longer absorb policy friction. The wall represents the rigid boundary of the current organizational model, constructed from mandatory compliance requirements, legacy IT infrastructure, and fixed governance structures. Discomfort along this boundary signals intense local computation as operators struggle to reconcile published procedures with delivery demands.
Boundary modifications alter the friction slope directly.
When an operational path strikes the wall, work halts or routes around the obstruction at extreme energy cost. Operators compiling solutions at the wall generate failure logs that define the exact coordinates of the organizational limit. Every logged error at the boundary maps a point where current governance models fail to support execution requirements.
Automated testing gates collapse the clearance delay.
Automating a gate without shifting the underlying operational boundary transfers latent energy into unmonitored downstream queues.

Releasing Stored Potential Energy Through Boundary Shift
Adjusting structural gates releases accumulated tension into direct productive execution without rupturing compliance integrity. Realigning boundaries involves converting manual sign-offs into automated, continuous verification steps. This transformation flattens the friction slope, eliminating the steep resistance gradient that originally drove execution into shadow channels.
Latent energy releases when compliance steps automate.
As formal gates align with real execution velocity, stored potential energy converts back into kinetic progress along the primary value axis. Shadow paths dissolve naturally because prescribed procedures no longer impose excess administrative overhead. The system achieves a lower baseline energy state, maintaining compliance verification while operating at maximum execution velocity.