
Calculating Unspent Asset Volume Behind Capital Preservation Walls In Distress
Capital preservation walls lock liquid cash during distress, trapping unspent asset volume that is calculated by mirroring operational descent gradients.

Vault
Bank accounts freeze under covenant restrictions, board resolutions limit operational outlays, and payment approvals require dual-signatory consensus across conflicting creditor factions. In the opening weeks of financial distress, corporate leadership institutes capital preservation walls designed to minimize immediate cash burn and satisfy debt covenants. These defensive barriers ring-fence liquid capital, preventing unauthorized disbursements and halting non-essential projects.
While defensive freezes protect remaining cash reserves, they simultaneously isolate unspent operational assets behind rigid administrative controls. Engineering teams pause software feature developments midway through completion cycles. Procurement contracts hold non-refundable volume discounts that lapse unexercised.
Vendor credit notes sit unapplied in receivables ledgers while managers focus strictly on meeting weekly payroll runs.
The administrative wall built to preserve cash becomes an unplanned holding area for immobilized capacity. Unprocessed operational material, unbilled intellectual property, pre-paid services, and uncollected rebates remain trapped on corporate balance sheets. Traditional accounting systems record these items at historical acquisition prices or impair them entirely under standard conservatism principles.
Such treatments fail to capture the actual volume of unspent assets sitting behind defensive barriers; establishing the real figure requires tracking the distance between active operational output and the path of least resistance enforced by preservation rules.
When capital preservation controls freeze liquid balances, operational teams construct workarounds to bypass restricted accounts. Engineers write custom code to keep deprecated servers running rather than requesting capital expenditure approvals for hardware replacements. Account managers defer customer concessions that would alter recognized revenue, accumulating silent service obligations instead.
These procedural workarounds indicate where internal operational velocity diverts around administrative barriers. That avoidance marks the coordinates: the friction generated by routing around a preserved account points directly to the unspent asset capacity held behind the barrier.
A firm that restricts expenditure to emergency operations forces all non-critical development into latent storage. Calculating this unspent volume requires reading the boundary conditions of the preservation wall itself, comparing the potential output of existing resources against the actual output permitted under distress constraints. Where preservation rules mandate complete spend freezes, unspent operational assets accumulate in direct proportion to the duration of the restriction.
Misjudging the structural difference between liquid cash preservation and total asset volume leads directly to premature liquidation. When managers mistake a temporary cash freeze for complete asset exhaustion, they surrender valuable latent reserves to creditors at steep distressed discounts.
Preservation rules lock liquid balances while operational friction consumes unscheduled working hours.

Gradient

Mapping defensive boundaries against operational expenditure
Mathematical optimization models describe system behavior through descent along the path of least resistance. In stable operating environments, corporate asset deployment follows positive return gradients toward highest-yielding projects. Financial distress alters this topology entirely.
Capital preservation walls create artificial cliffs in the optimization landscape, turning direct asset deployment into an expensive proposition. The system defaults to gradient descent, moving along the steepest path of expenditure reduction to minimize immediate cash loss.
As expenditure drops toward baseline survival levels, the gradient computed from asset potential becomes strongly negative. The system routes around every operational path that demands immediate cash outlays, regardless of long-term value creation. The latent asset volume behind the preservation wall equals the integral of this negative gradient over the duration of the distress event.
Mirroring this negative slope above the baseline potential produces the absolute unspent asset volume available for recovery during restructuring.

Comparative structures of capital preservation constraints
Capital preservation controls vary by institutional trigger and operational severity. Comparing these control structures clarifies how different preservation walls influence unspent asset storage and recovery potential.
| Preservation Model | Defensive Mechanism | Avoidance Marker | Latent Asset Volume Impact |
|---|---|---|---|
| Mandatory Cash Lock | Debt covenant cash sweeps and restricted account blocks | Manual invoice deferrals and unauthorized supplier credit extensions | High accumulation of uncollected vendor rebates and unbilled receivables |
| Discretionary Expenditure Gate | Executive committee sign-off required for outlays above threshold | Fragmented order splitting below sign-off limits and scope delays | Moderate volume of incomplete software features and paused product lines |
| Board Consent Freeze | Total operational halt pending restructuring or asset sale | Complete reliance on legacy infrastructure without maintenance outlays | Maximum build-up of unexercised contractual rights and unused licenses |
Each preservation model imposes distinct constraints on operational teams. Mandatory cash locks force complete administrative isolation, driving operational capacity into hidden inventory and unbilled service hours. Discretionary gates introduce decision friction, encouraging project teams to split orders into smaller increments to bypass sign-off thresholds.
Board consent freezes suspend formal capital allocation entirely, turning operational units into static repositories of unspent potential.
Measuring the structural depth of these preservation walls involves mapping the exact points where operational flow halts. A project team that halts a proprietary software migration four weeks before launch stores four weeks of high-value engineering labor behind the preservation gate. That labor holds no current cash value on a distressed balance sheet, yet its structural value remains intact if preservation constraints lift.
When cash preservation gates block direct asset deployment, unprocessed working inventory shifts into latent operational reserves.
How far can an operational system descend along least-resistance paths before the latent volume behind preservation walls degrades beyond economic recovery?

Axis
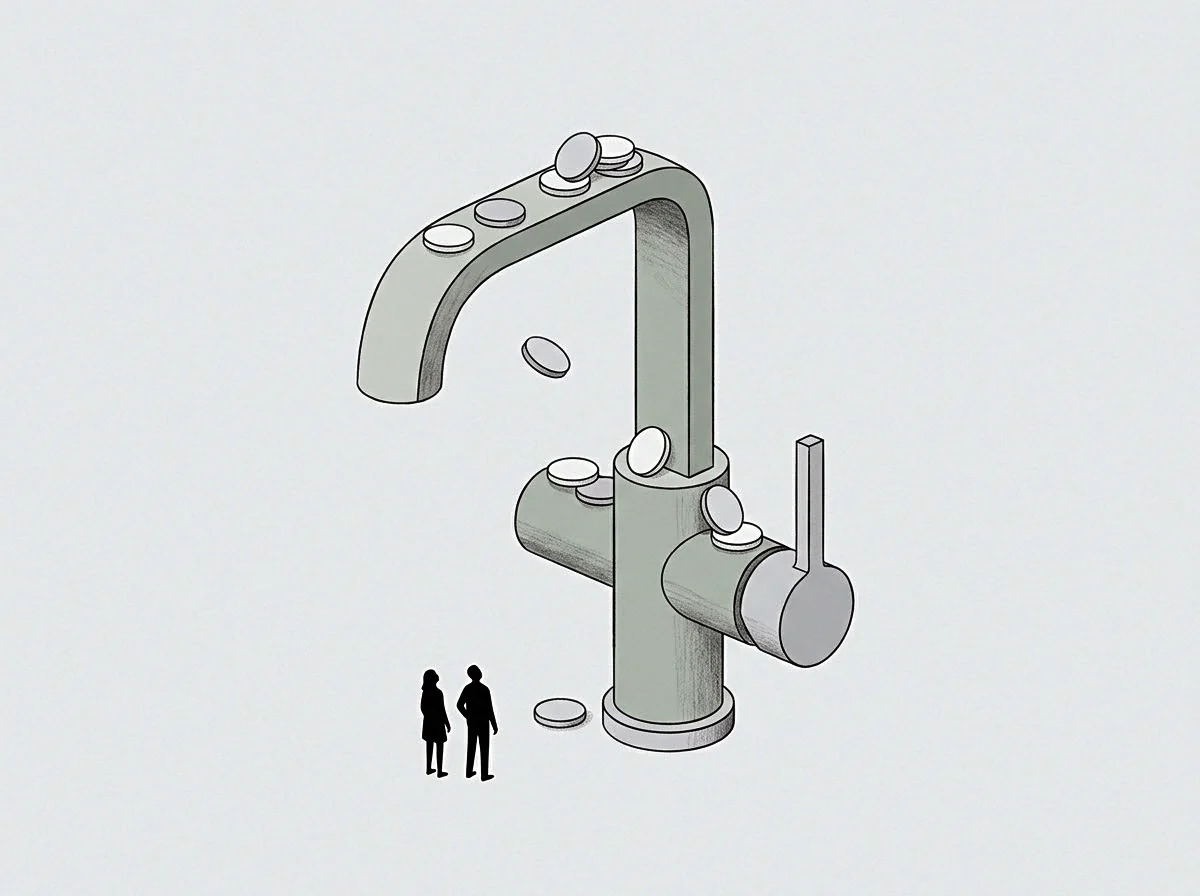
What changes when defensive covenants freeze cash deployment?
Calculating unspent asset volume requires separating two distinct measurement scales that distressed corporate finance routinely confuses. Standard balance sheet accounting relies on cardinal figures, expressing asset values in exact monetary units based on historical cost or mark-to-market estimates. Value behaves along an ordinal value vector, where operational components hold relative priority based on their functional sequence within the production process.
A proprietary manufacturing dye holds minimal cardinal balance sheet price during a liquidation, yet its ordinal position on the production axis determines whether $10M of inventory can ship.
Evaluating distressed entities through cardinal price figures distorts the assessment of unspent volume. When preservation walls freeze liquidity, accounting audits write down uncompleted work-in-progress to scrap value. This accounting haircut measures immediate liquidation price rather than unspent asset volume.
The true volume calculation operates along the functional axis, measuring how many sequential operational steps remain stored inside the preserved work-in-progress.
Evaluating errors during distressed asset calculation reveals consistent operational missteps:
- Cardinal price confusion leads managers to value incomplete operational assets at immediate liquidation scrap prices rather than functional recovery value.
- Baseline miscalibration occurs when leadership measures unspent volume against peak historical budgets instead of current distressed operational minimums.
- Avoidance coordinate neglect happens when restructuring advisors ignore informal operational workarounds that signal high latent asset concentration.
- Temporal decay underestimation results in overestimating the lifespan of unspent intellectual property stored behind prolonged preservation freezes.
Evaluating the state of an asset portfolio along the ordinal axis requires tracing how individual operational units withstand preservation constraints. A chemical facility under debt distress may pause capital expenditure on safety retrofits while maintaining processing equipment at nominal capacity. The safety deferred represents a negative operational gradient, while the functional machinery represents stored asset volume waiting for covenant relief.
Evaluating distress through cardinal accounting metrics hides the ordinal expansion of trapped operational velocity.
The definitive test of unspent volume behind capital preservation walls occurs when a formal debt restructuring agreement specifies exact conversion ratios between frozen operational claims and fresh capital equity infusions.

Slope

Calculating descent rates and latent potential recovery
Consider a distressed industrial firm operating under strict creditor oversight. Assume two parties build an operational agreement over three years without stating formal terms for latent asset recovery. Assume an operator holds forty percent equity while senior lenders enforce a $2M cash lock wall backed by $10M in face-value debt covenants.
The company holds $5M in nominal accounts receivable, but liquidity preservation rules forbid spending cash to execute collection lawsuits against delinquent debtors. The path of least resistance forces management to abandon collection efforts, causing receivables to appear bad on cardinal financial statements.
The negative gradient in this worked situation reflects the rate at which cash collection effort drops due to preservation walls. To calculate the true unspent asset volume, an analyst maps the descent trajectory. The uncollected receivables portfolio contains $3.5M in high-probability recoveries that require merely $200,000 in dedicated legal expenditure to execute.
Because the preservation wall blocks the $200,000 outlay, the $3.5M volume sits dormant.
Mirroring this $3.5M negative gradient above the operational baseline reveals an unspent asset volume equal to $3.3M net recoverable value. Traditional liquidation metrics price the uncollected portfolio at zero. The gradient calculation reveals $3.3M in latent potential waiting for targeted liquidity injection.
The operator can present this precise vector calculation to secondary distress funds to secure junior debtor-in-possession financing specifically earmarked for collection outlays.
Senior lenders often oppose targeted outlays because their incentives prioritize immediate cash preservation over maximal long-term recovery. Their risk profile penalizes any cash outlay that carries non-zero execution uncertainty. The operator demonstrates that the expenditure yields a seventeen-to-one recovery ratio on the ordinal value axis, forcing a structured renegotiation of the preservation terms.
Mirroring negative gradient vectors reveals the hidden volume of unspent operational capital.
Senior lenders will release preserved accounts only when fresh capital provisions cover senior principal recovery before any allocation to operational restarts.

Volume
Recovering latent value behind distress barriers
Releasing unspent asset volume locked behind capital preservation walls requires systematic operational steps rather than blanket capital infusions. Restructuring teams execute recovery procedures in strict sequential order to preserve latent potential during covenant negotiation phases.
- Quantify the exact administrative boundaries created by current preservation walls across all banking and operational agreements.
- Identify all operational workarounds to map avoidance coordinates where latent asset volume accumulates quietly.
- Separate cardinal liquidation price metrics from ordinal functional value positions across all uncompleted projects.
- Calculate negative expenditure gradients across departments to model total unspent operational potential.
- Structure targeted covenant releases that unlock specific asset volumes without compromising core liquidity preservation floors.
Executing these steps transforms vague operational potential into structured recovery plans. When restructuring management presents capital providers with calculated unspent volume metrics, negotiations shift from liquidation bargaining to structured recapitalization.
Asset volume recovered from behind preservation walls provides the operational buffer needed to stabilize cash flows during corporate turnarounds. Capital preservation walls represent temporary boundaries constructed under distress; calculating the unspent volume behind them defines the exact horizon of post-restructuring solvency.
Preservation controls preserve liquid balances, but calculated asset volume provides the actual leverage for long-term survival.