
Determining Energy Dissipation Vectors Across Saturated Latent Manifolds During Trajectory Collapse
Trajectory collapse forces unspent energy into secondary dissipation vectors, requiring operators to map friction boundaries and mirror latent volume.

Shelf
An enterprise architecture team spent forty months building an automated transaction engine while primary platform volume stalled at nine thousand daily executions. Monthly operational expenditure held steady at two hundred thousand dollars, engineering headcount remained fixed, and board reporting tracked feature deployments rather than transactional momentum. The primary directional vector lost velocity six quarters prior.
Resource expenditure continued along auxiliary channels, funding secondary refactoring efforts and tangential feature sets that consumed compute and attention without altering the flatline on the core execution path.
This state defines trajectory collapse within a saturated latent manifold. When a system reaches the edge of its operational model, the directional vector representing primary growth flattens. The capacity committed to the system does not vanish.
Energy redistributes into secondary degrees of freedom across the state space. In engineering organizations, financial ventures, and algorithmic search models, this redistribution follows paths of lowest structural friction. Measuring where that volume drains provides the explicit coordinate map of what the organization avoids computing.
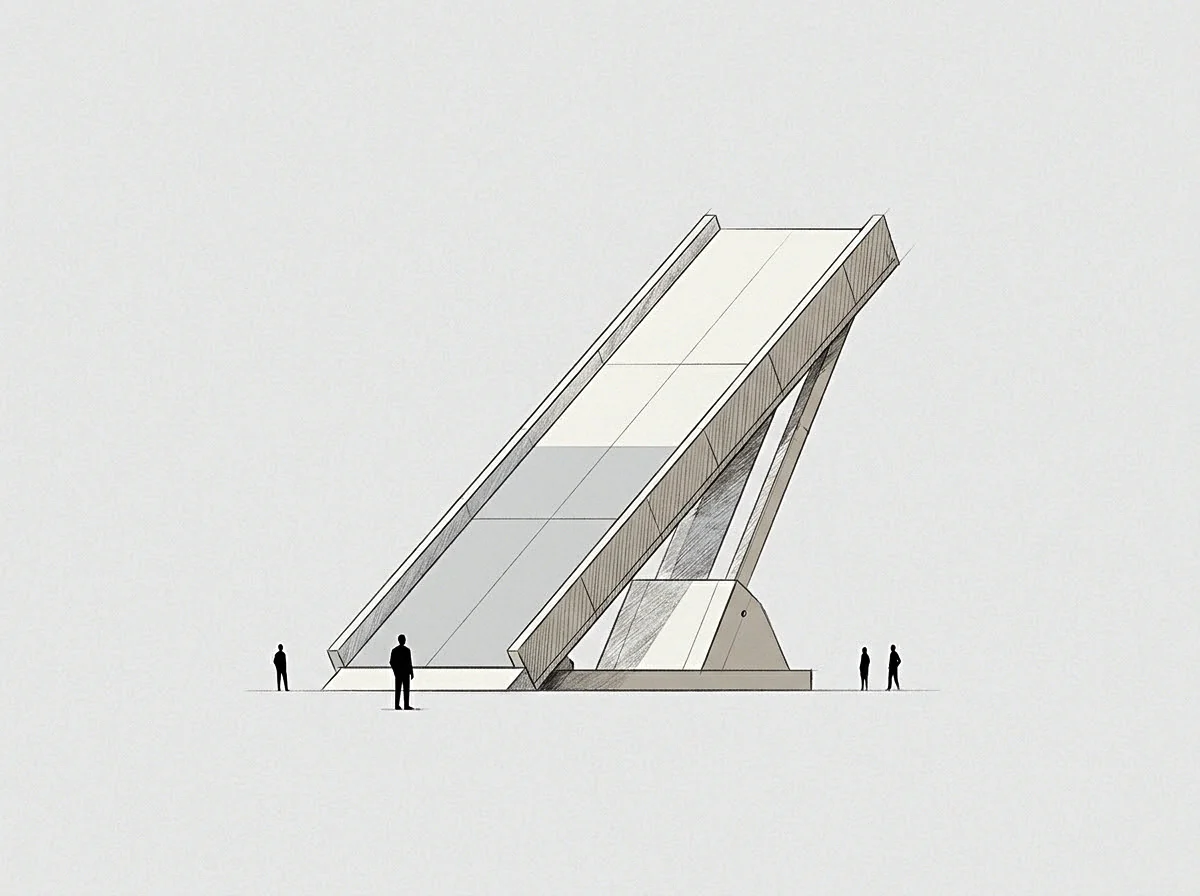
Latent Capacity and Directional Arrest
System saturation occurs when further inputs along an established axis produce diminished marginal output. In an optimization context, the gradient calculated from value approaches zero. The surface flattens.
Capital, compute hours, and human labor continue to enter the boundary. Because energy conservation applies to organizational systems, input volume must exit through dissipation channels. The saturated manifold represents the accumulated potential of unspent operational options that the model refuses to activate due to cost constraints.
A fundamental distinction separates trajectory deceleration from complete directional arrest. Deceleration permits recovery along the original directional line through increased input pressure. Directional arrest indicates that the primary axis has hit a rigid structural limit.
Continuing to apply resource velocity along an arrested vector generates operational heat. Heat manifests as internal friction, repeated administrative revisions, and escalating spend on low-yield governance tasks.
A system operating along a flattened trajectory converts excess input into structural friction rather than forward displacement.
When primary directional momentum ceases, energy routes instantly into adjacent low-friction corridors. Operators observe high activity metrics alongside zero movement on core output variables. Engineering velocity logs display high commit counts, infrastructure bills rise, and calendar availability shrinks to zero.
The underlying performance curve remains strictly horizontal. The primary metric sits immobile while internal state space churns rapidly.
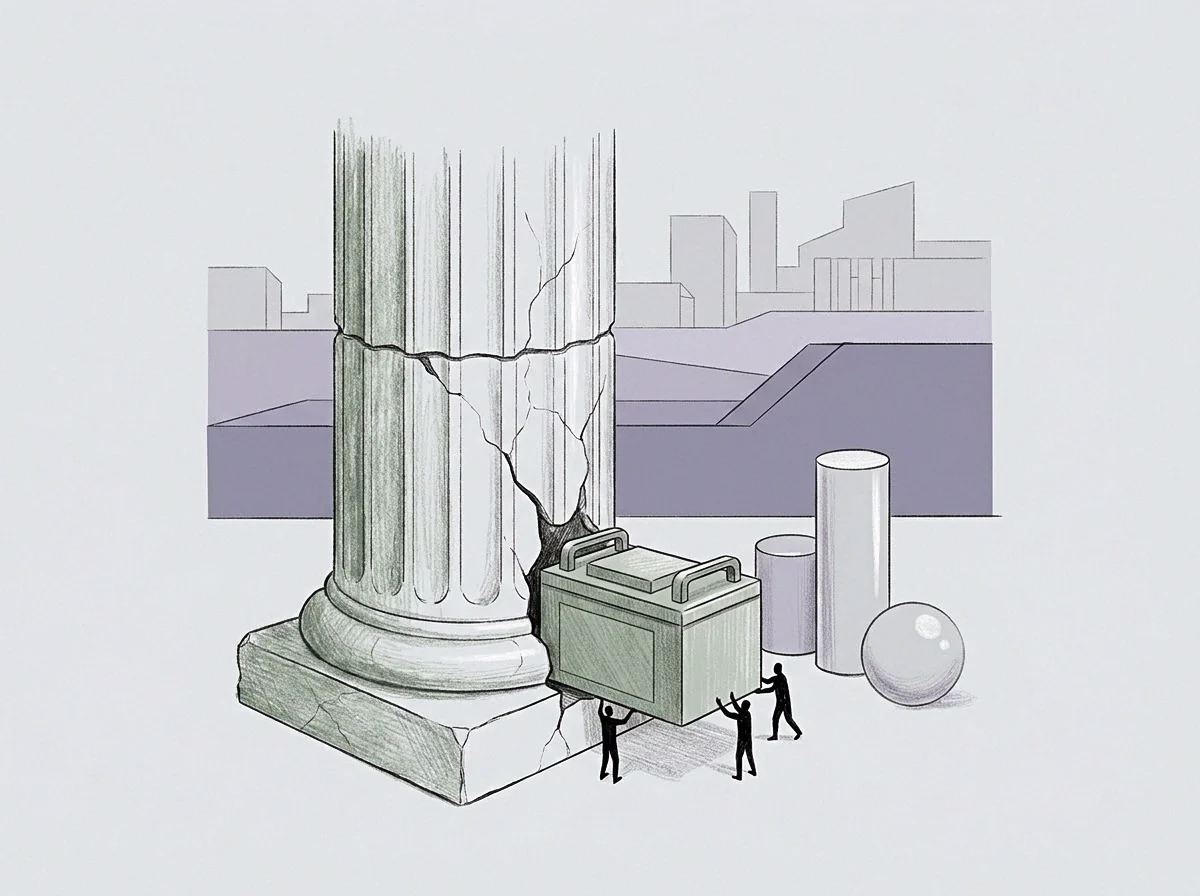
Volumetric Friction Along Flattened Slopes
Friction within a saturated system is a derived vector, calculated by comparing total resource intake against measurable movement along the primary value axis. The difference between gross energy input and useful work represents dissipated energy. Dissipation vectors are directional.
They point directly toward the tasks, decisions, and structural reconfigurations that the organization systematically avoids executing.
The path of least resistance governs where this energy accumulates. If altering a commercial contract incurs high political cost, energy flows into product redesigns. If sunsetting an unprofitable product line triggers client litigation, energy dissipates into minor UI refinements.
The system routes around high-cost decisions, building complex internal mechanisms to absorb incoming capital without disturbing the boundary of the existing model.
Friction metrics provide clear mathematical signals long before financial statements reflect structural failure. Tracking compute cycles spent on secondary processing, hours committed to non-binding governance forums, and capital allocated to non-core pilots reveals the precise slope of system decay. Ignoring these dissipation coordinates leads directly to complete capital exhaustion on a static operational plane.
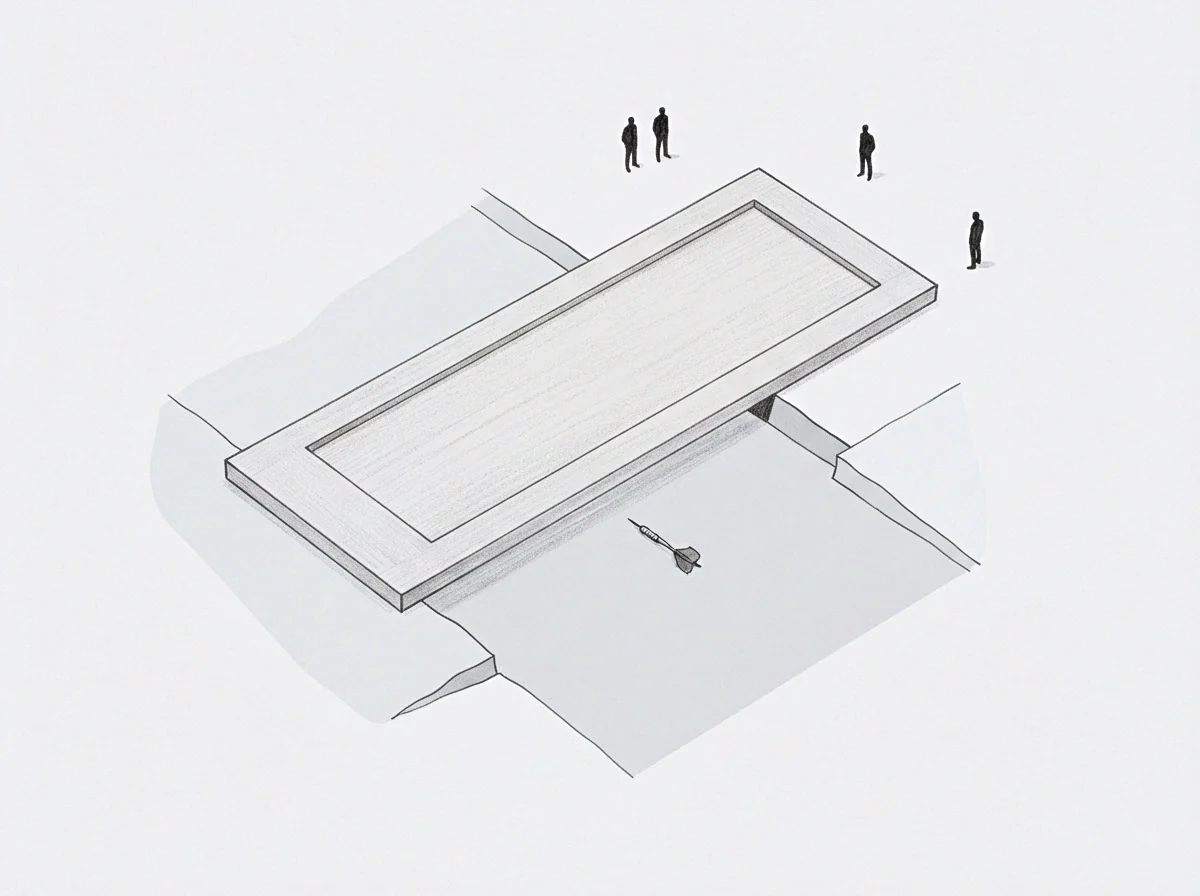
Decay
Energy dissipation vectors follow specific geometric patterns once the main trajectory breaks. Instead of dispersing uniformly across all available coordinates, energy gathers along discrete sub-spaces within the organization. These sub-spaces act as sink nodes.
Mapping these nodes requires isolating resource flows from stated strategic objectives and measuring pure directional volume.
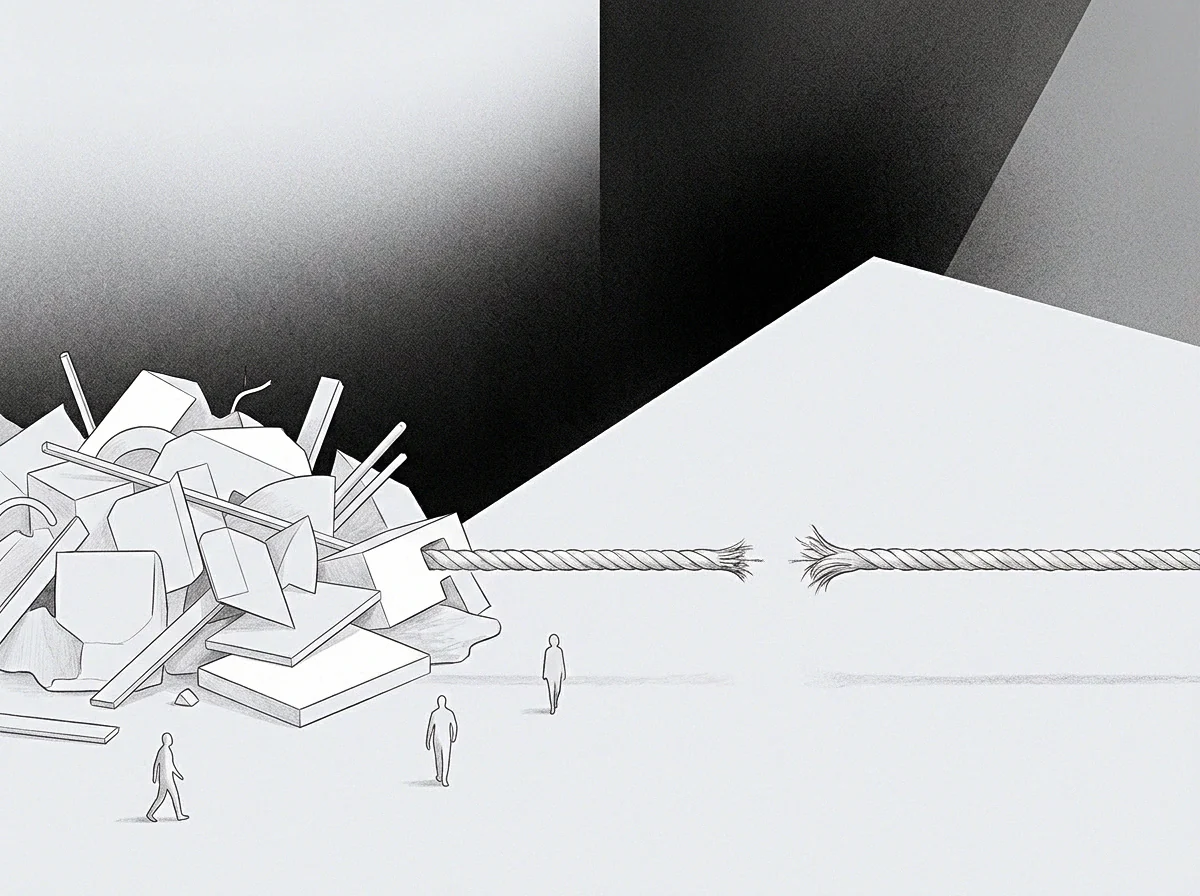
Sink Node Dynamics and Internal Circulation
A sink node is an operational unit or activity that consumes resource gradient without generating external work. Internal documentation projects, endless API wrapping iterations, and redundant audit cycles frequently function as sink nodes. Input enters the node continuously, yet the exit vector points inward, creating a closed circulation loop.
Consider a venture-backed infrastructure provider with twenty million dollars in remaining reserves. The core storage API exhibits a sixty percent churn rate due to pricing friction relative to commodity competitors. Rather than adjusting pricing structures or renegotiating vendor agreements, the engineering organization spends three quarters migrating the underlying orchestration layer between two identical cloud environments.
Capital drains at eight hundred thousand dollars per month. The exit velocity of the storage service stays negative.
The migration work consumes total operational capacity, shielding the team from addressing the pricing wall. Avoidance acts as the primary coordinate marker. The magnitude of resources absorbed by the migration measures the precise magnitude of the unresolved pricing issue.
The work feels essential to the engineering group, yet it represents pure energy dissipation within a saturated system state.
| Dissipation Mode | Primary Mechanism | Observable Coordinate Marker | Structural Energy Cost |
|---|---|---|---|
| Auxiliary Refactoring | Routing capital into sub-system rebuilds to defer core market validation. | Escalating code commits on non-revenue components alongside zero platform growth. | High compute and engineering hour expenditure with zero slope change on value axis. |
| Governance Proliferation | Creating internal review gates to absorb unspent management energy. | Calendar congestion, multi-signature approval chains, expanding committee seats. | Direct loss of organizational response velocity and high administrative burn. |
| Parallel Exploration | Launching secondary experiments to mask directional arrest of core asset. | Multiple simultaneous proof-of-concept projects without operational sunset rules. | Capital fragmentation across low-conviction vectors, thinning primary reserves. |
| Procedural Archiving | Documenting existing static processes rather than resolving structural bottlenecks. | High volume of internal wiki updates and process mapping deliverables. | Absorption of operational focus into reflective overhead rather than output generation. |
Quantifying Dissipation Vectors Across Sub-Systems
Isolating a dissipation vector requires calculating the delta between gross operational expenditure and net trajectory progress over a fixed baseline window. The baseline window must span at least two full reporting cycles to distinguish temporary bottlenecks from permanent trajectory collapse. When net trajectory progress remains within a two-sigma band around zero while expenditure exceeds baseline projections, dissipation occurs.
Quantification proceeds across three specific operational dimensions:
- Compute overhead ratio measures the ratio of background processing tasks to primary transaction processing volume over ninety days.
- Allocation variance delta calculates the difference between budgeted primary growth expenditure and actual spend diverted into secondary operational maintenance.
- Decision latency index measures the average hours elapsed between identifying a boundary limit and executing a structural path change.
Calculating these values yields a scalar field indicating where energy leaves the system. High compute overhead paired with escalating allocation variance signals that the system is spending heavily to maintain an untenable setpoint. The organizational model burns fuel to hold its current position on the slope, mistaking station-keeping for upward trajectory.
Energy diverted to maintain a static setpoint subtracts directly from the volume available to cross operational boundaries.
The partner sitting across the table observes the operational burn rate, reviews the flat metrics, and notes that the team has built an exceptionally complex engine to execute an operation nobody requested.
Descent
Descent represents the path of least resistance during trajectory collapse. When an operational model breaks, system trajectory moves downhill along the steepest available negative slope. Operators frequently misinterpret this descent as an uncontrolled failure.
It is an automated mathematical convergence toward a lower energy state. The system naturally sheds complexity it can no longer support at its current intake levels.
Slope Mechanics and Least Resistance
A system descending a value gradient moves toward local minima where operational pressure drops to zero. These minima represent stable, low-output equilibrium states. An enterprise software firm reduced to servicing three legacy contracts with zero active product development sits in a classic local minimum.
Operational burn drops to match recurring maintenance revenues. Discomfort vanishes because the system no longer attempts to climb steep value gradients.
The cost of climbing is high; the cost of descent is zero. Moving uphill against market resistance demands continuous energy injection, explicit strategic clarity, and willingness to press against structural walls. Sliding downhill requires only that the organization continue its present operational routine while ignoring the flattening output vector.
The system optimizes for immediate comfort, converting stored capital reserves into a prolonged, slow decline.
- Primary vector momentum falls below the baseline threshold needed to maintain operational fixed costs.
- Internal resource allocation shifts from prospective growth channels to defensive process protection.
- Auxiliary projects drain remaining unspent capital reserves to preserve the appearance of high organizational throughput.
- The organization reaches a low-velocity local minimum where revenues cover minimal baseline costs but growth potential remains zero.
Recognizing the slope requires separating cardinal pricing figures from ordinal energy costs. A project may show positive gross margins on a financial spreadsheet while consuming an ordinal cost in engineering focus that destroys the firm’s ability to launch its primary platform. The cardinal figure disguises the descent; the ordinal energy reading exposes it immediately.

Can Unprocessed Volumetric Friction Predict Residual Gradient Direction?
Volumetric friction within an organization accumulates directly at the boundary of unprocessed decisions. When an enterprise team avoids renegotiating a core distribution agreement, the friction surrounding partner calls, legal reviews, and financial forecasting increases exponentially. The accumulated friction forms a dense coordinate cluster within the system state space.
That cluster marks the exact boundary where the current operational model terminates.
Predicting the residual gradient requires measuring the unspent potential mirrored directly above that friction wall. The negative gradient points down the path of avoidance; the positive gradient points directly through the wall itself. Mirroring the negative gradient above the baseline reveals the latent potential of the system.
The volume of unspent potential equals the volume of energy currently being wasted on avoidance tactics.
If an organization spends three million dollars and twelve months building complex workarounds to avoid facing a single regulatory clarification, that three-million-dollar figure represents the exact energy magnitude available for real structural adaptation. The friction coordinate is the guidepost. The path forward runs directly through the point of highest operational discomfort.
The stated condition of structural friction changes entirely once operators stop viewing discomfort as a risk indicator and begin treating it as a precise directional vector.

Boundary
The wall marks the physical perimeter of the current operational model. Beyond the wall sits the domain of actions the system currently refuses to perform because the short-term compute or organizational cost is high. When trajectory collapse occurs, the system collides with this boundary repeatedly, recoiling into secondary dissipation channels rather than breaking through.
Surveying the Wall
A wall is not an abstract concept. It consists of explicit, unexecuted decisions: terminating a legacy product line, releasing half the engineering team, replacing a founding partner, or discarding an internal tech stack built over half a decade. These choices carry immediate structural costs.
To avoid paying those costs, the system chooses the continuous, incremental cost of energy dissipation.
Surveying the boundary requires inspecting the failure logs of the organization. System errors, missed product milestones, failed client integrations, and employee turnover events are not random missteps. They are explicit coordinate markers defining the perimeter of the existing model.
Each failure highlights a point where the model attempted to interact with reality and reached its capacity limits.
An organization compiling its strategy from past errors builds an accurate boundary map. A firm that reinterprets failures as temporary execution lapses erases those coordinate markers, ensuring that its next allocation cycle will hit the exact same wall. The boundary remains rigid whether or not management acknowledges its presence.
The boundary of an operational model consists of every choice the organization labels as impossible to avoid paying the immediate structural price.

Discomfort as a Measurement Tool
Discomfort provides real-time telemetry on computational depth. When an executive team discusses routine status updates, internal processing costs remain low. The conversation draws from cached memory, retrieving pre-existing mental models and established operational patterns.
Computation does not occur; retrieval occurs.
When the conversation shifts to liquidating an core business unit to fund a high-conviction growth vector, processing costs spike immediately. Discomfort rises, administrative friction increases, and team members attempt to steer the discussion back toward comfortable, retrieval-based topics. That spike in discomfort measures active computation.
It indicates that the system has reached its boundary edge and is attempting to calculate a new structural path.
Treating discomfort as telemetry allows operators to locate the boundary precisely. High friction during strategic reviews indicates proximity to the wall. Low friction indicates that the organization is idling comfortably within its established, saturated manifold.
Progress occurs exclusively at the wall.
Continuous trajectory alignment across high-friction boundaries requires maintaining raw operational velocity directly against the points of maximum internal friction.

Margin
Rebuilding trajectory momentum after collapse demands a complete recalibration of baseline metrics. The system cannot return to its previous growth vector using the old operational model; that path led directly to saturation and collapse. Re-establishing upward motion requires extracting residual capacity from the saturated manifold and applying it toward a fresh, unencumbered axis.
Extracting Latent Potential
Latent potential is not a speculative metric. It is an unspent volume of operational capacity, mathematically equal to the energy currently being wasted on secondary dissipation channels. When an organization shuts down its sink nodes, it frees up capital, compute, and attention.
That freed volume constitutes the initial reserve for the next operational cycle.
Consider an enterprise team that sunsets four secondary pilot projects, cancels six internal governance committees, and freezes non-essential refactoring efforts. The immediate effect is a forty percent reduction in weekly operational burn alongside the recovery of two thousand engineering hours per month. That recovered capacity is the residual volume.
It exists immediately, fully funded, ready for deployment along a new trajectory line.
The extraction process requires absolute discipline. If recovered capacity is allowed to sit unallocated, the system will naturally route it back into legacy dissipation channels within two operational cycles. Decentralized energy always follows established paths of least resistance.
The new directional vector must be defined, bounded, and funded simultaneously with the shutdown of old sink nodes.
Establishing the New Directional Vector
A new directional vector requires three clear parameters: an explicit primary value axis, a strictly enforced budget ceiling on auxiliary activities, and a short baseline window for validation. The primary value axis must measure pure external work: active customer volume, platform transactional throughput, or direct net revenue. Internal milestones, code metrics, and process completions are explicitly excluded from baseline evaluations.
The baseline window must be short, typically sixty to ninety days. If the new vector fails to produce measurable slope changes on the primary value axis within that window, the system is sliding into a new saturation state. Long validation windows encourage the re-emergence of sink nodes, allowing teams to build complex operational justification layers around non-performing vectors.
The boundary surveyor maps the new terrain, marks the location of the old walls, and tracks the fresh slope. The operator holds the seat, enforces the stated limits, and refuses to fund process overhead that does not alter the primary value gradient.
What remains uncalculated is how long the organization can sustain direct pressure against its new boundary before the next saturation plateau forms across the expanded state space.