
Gradient Variance Calculation When Scaling Resource Output Across Operational Boundaries
Gradient variance measures capacity dissipation across domain seams by comparing expected output rate against actual performance delta.

Floor
Resource throughput across operational boundaries follows a derivative model. When output scaling occurs within a single functional unit, rate changes remain tightly coupled to input volume. Transferring output across operational seams introduces localized impedance that alters the output rate relative to resource deployment.
Calculating this rate change requires establishing a baseline setpoint for expected capacity prior to scaling across domain borders.
Baseline Output Tracking Across System Seams
Systemic baselines establish the zero-state measurement for output performance. Operators compute expected output by taking historical output values within a unified domain and projecting those values against added capital or labor allocation. When resource scaling pushes output across an organizational or technical seam, the baseline becomes vulnerable to measurement degradation.
The vector turns. Output drops.
Calculated gradients retain numerical stability only when resource allocations match domain setpoints.
Performance tracking at the seam level demands measuring the differential between internal unit capacity and cross-boundary transfer speed. Friction consumes capacity. If an engineering group increases code output by fifty percent, but the deployment pipeline crossing into operations can only absorb a ten percent increase, the calculated rate gradient breaks down.
The observed variance reflects structural seam friction rather than team capability.
Capacity Scaling and Signal Loss
Signal attenuation occurs whenever output metrics travel through multiple operational layers. Internal reporting systems smooth local output numbers, hiding micro-stoppages and buffering delays. When additional capital is applied to expand production capacity, these hidden delays generate non-linear variance spikes at the boundary interfaces.
A formal transfer protocol specifies baseline expectations and shifts the variance attribution from personal error to structural interface friction.

Shear
Operational seams experience structural tension when resource output scales unevenly on opposing sides of a boundary line. Consider an enterprise deployment situation involving two distinct operational units. Assume the software development group expands output capacity by seventy percent over two quarters following a capital injection, while the client integration unit remains capped at fixed staffing levels.
The rate of feature output increases rapidly within the development domain, yet the deployment rate across the client boundary stays flat.
Boundary Transitions in Multi Unit Operations
Differential scaling velocity creates severe gradient divergence at the operational interface. Work units accumulate in the handover queue, inflating inventory costs and extending cycle times. Seams store structural tension.
Friction at the transition point converts productive capacity into administrative tracking waste.
| Boundary Parameter | Intradomain Seam | Interdomain Seam |
|---|---|---|
| Gradient Stability | High linear consistency | High non-linear variance |
| Variance Accumulation Rate | Low deterministic drift | Rapid stochastic divergence |
| Primary Dissipation Mechanism | Internal task reprioritization | Buffer expansion and backlog growth |
| Observability Horizon | Immediate metric propagation | Delayed aggregated reporting |
Tension turns into decay. As the backlog expands, developers stall pending integration feedback, causing the measured value gradient of the development domain to fall while inputs remain high. The calculated variance reaches maximum amplitude precisely at the boundary line between the two groups.
Signals decay fast.
Unstated operational terms force internal capacity allocations into unmonitored structural buffers.
Ignoring structural gradient divergence results in misallocating capital toward individual retraining when operational boundaries cause performance degradation.
Noise
Measuring variance across scaling operational boundaries requires separating stochastic signal noise from permanent structural decay. When resource output increases, performance data gathered near operational borders displays increased standard deviation. The metric fails.

Stochastic Drift in Output Measurements
Data streams collected from distributed operational units carry inherent variance driven by environmental fluctuations and local execution habits. Distinguishing temporary operational instability from systematic boundary friction demands evaluating variance trends over defined temporal windows.
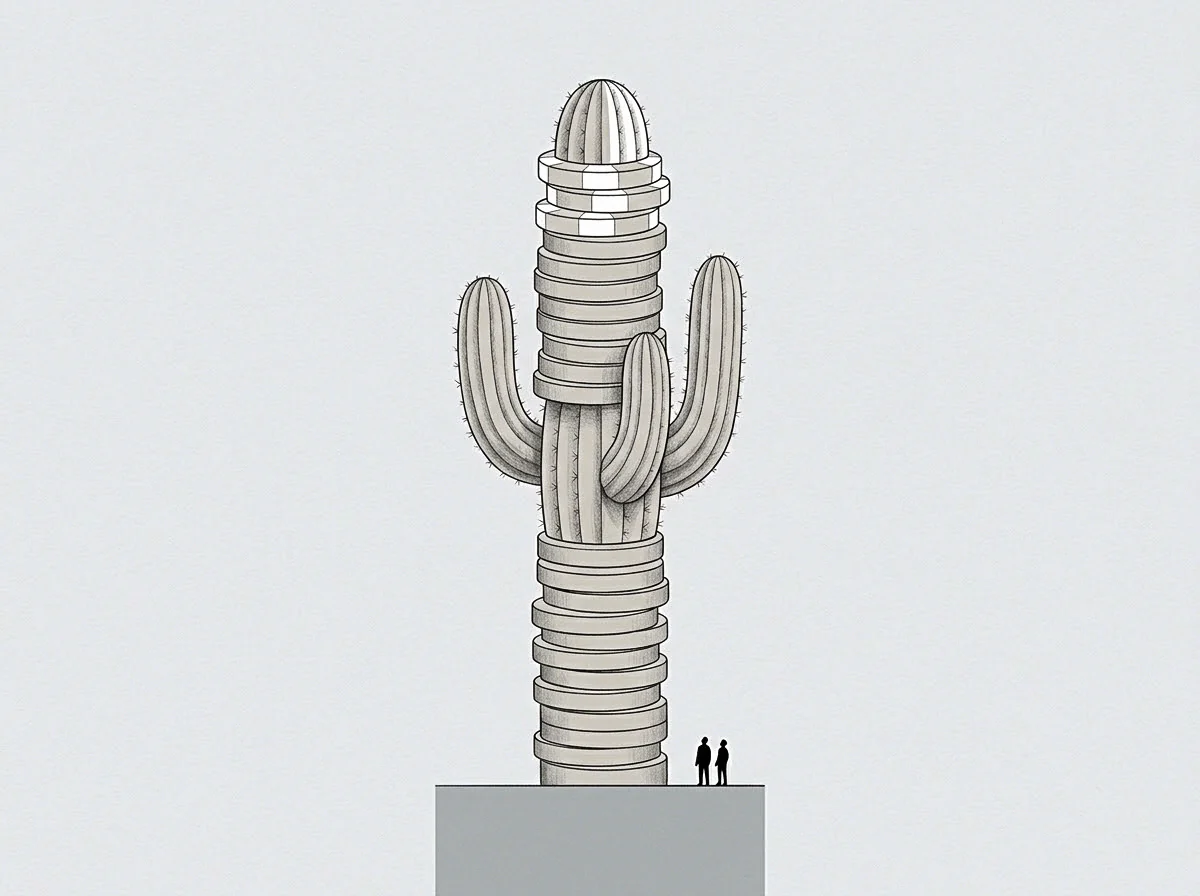
What Causes Variance Explosion Across Operational Boundaries?
Multiple structural factors compound output uncertainty when scaling across domain limits:
- Information Asymmetry creates delayed error signal transmission across distinct management layers.
- Taxonomic Mismatch forces teams to convert operational units into incompatible local metrics.
- Resource Hoarding expands local safety margins and inflates systemic variance.
Variance marks seam location. When operational inputs double, the error term inside the gradient calculation often expands cubically if domain interfaces remain unaligned. The calculation stops.
Operational variance increases whenever resource flows step across unmapped domain seams.
Whether cross boundary variance can ever be reduced to baseline levels without consolidating operational ownership remains unresolved.
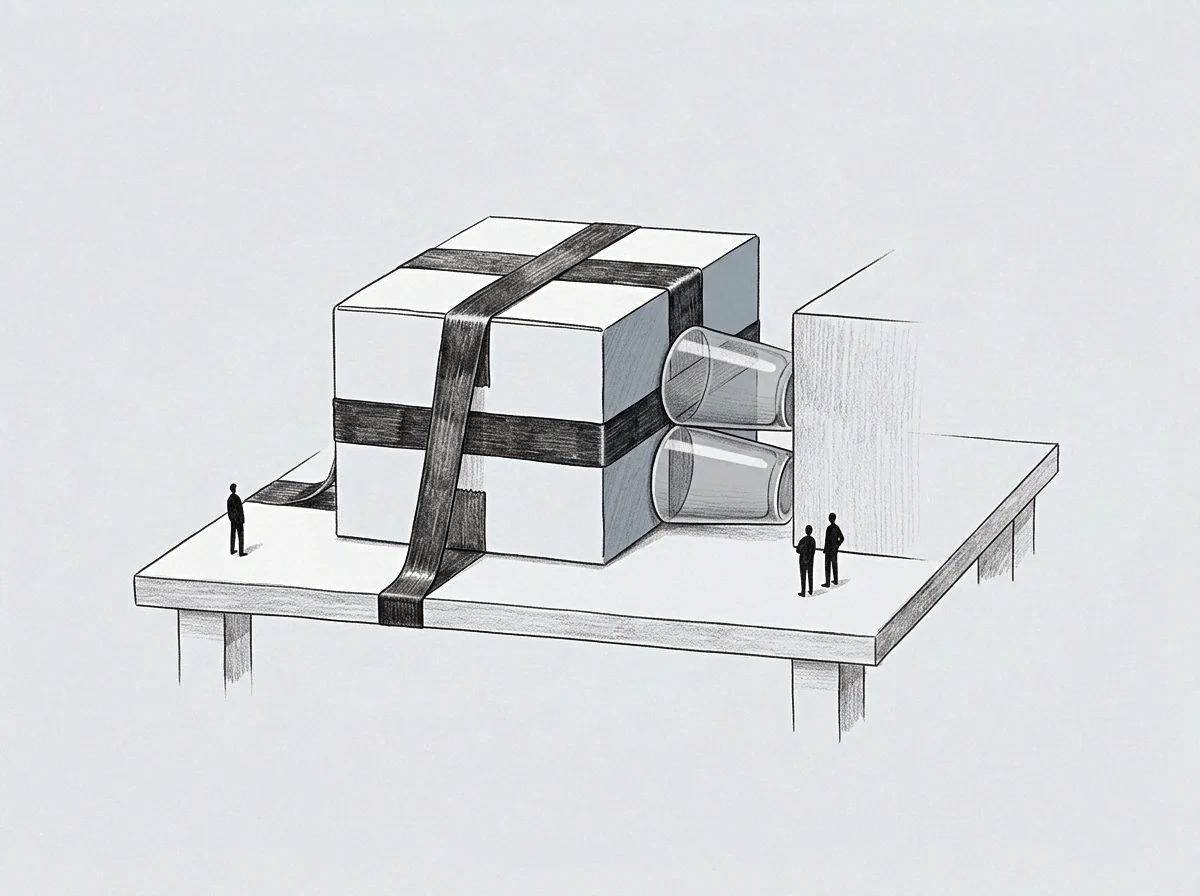
Drain
Unspent volume accumulates behind operational barriers whenever cross boundary throughput falls below internal production rates. Capacity leaks out. When an operational unit generates output faster than the adjacent unit can process it, the excess volume redirects into informal buffer mechanisms, creating latent operational debt.
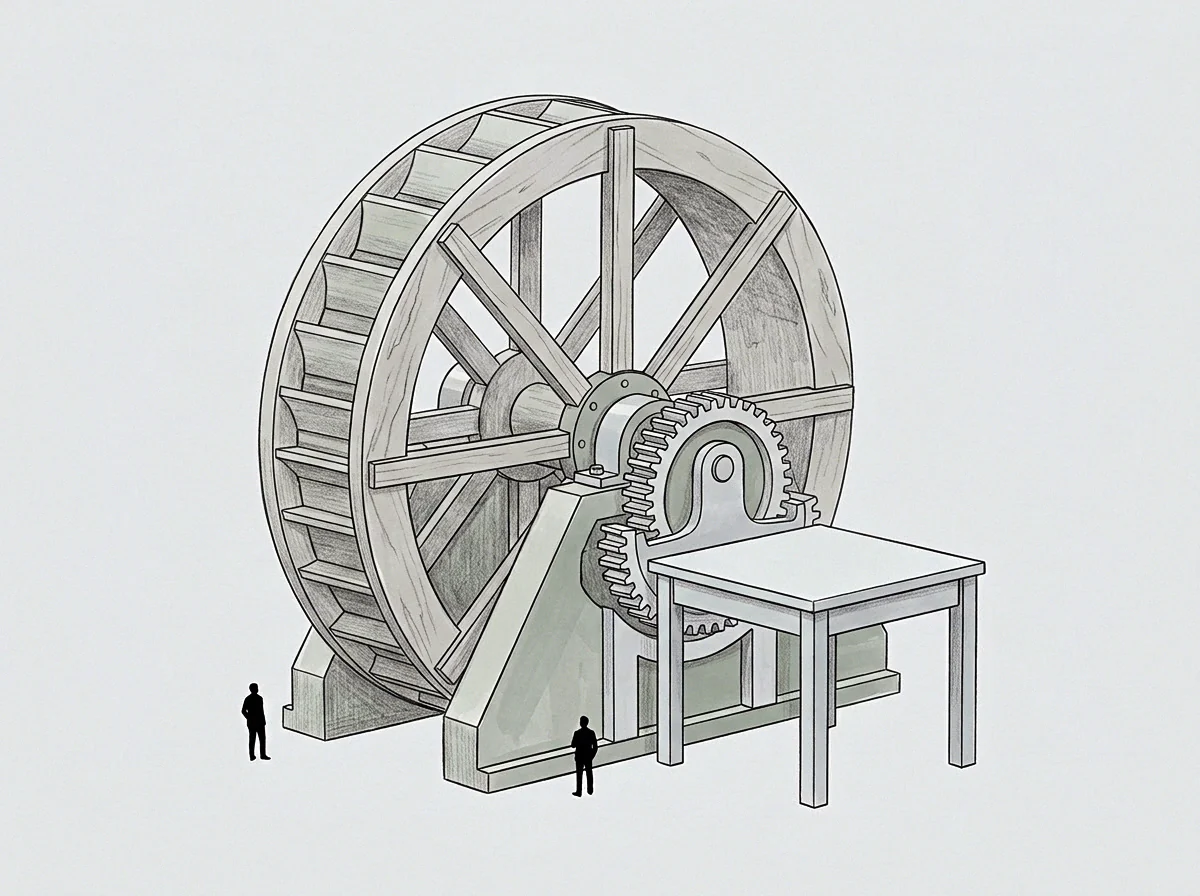
Unspent Capacity and Systemic Avoidance
Work units routinely route around operational seams that present high friction, seeking paths of least organizational resistance. Avoidance serves as a coordinate marker for structural bottlenecks. The process follows a predictable sequence of degradation steps when resource output expands without corresponding boundary adjustments:
- Resource output enters the domain seam.
- Local protocols recalculate input priorities.
- Friction consumes initial momentum.
- Unprocessed work accumulates at the wall.
Pressure moves sideways. When work accumulates at the interface wall, internal teams deploy manual workarounds to maintain visible output metrics. These workarounds consume secondary capacity, diverting attention from primary output targets and further distorting gradient calculations.
Output metrics drop when work passes through unaligned operational units.
The delivery fell behind because the handover requirements were never clarified.
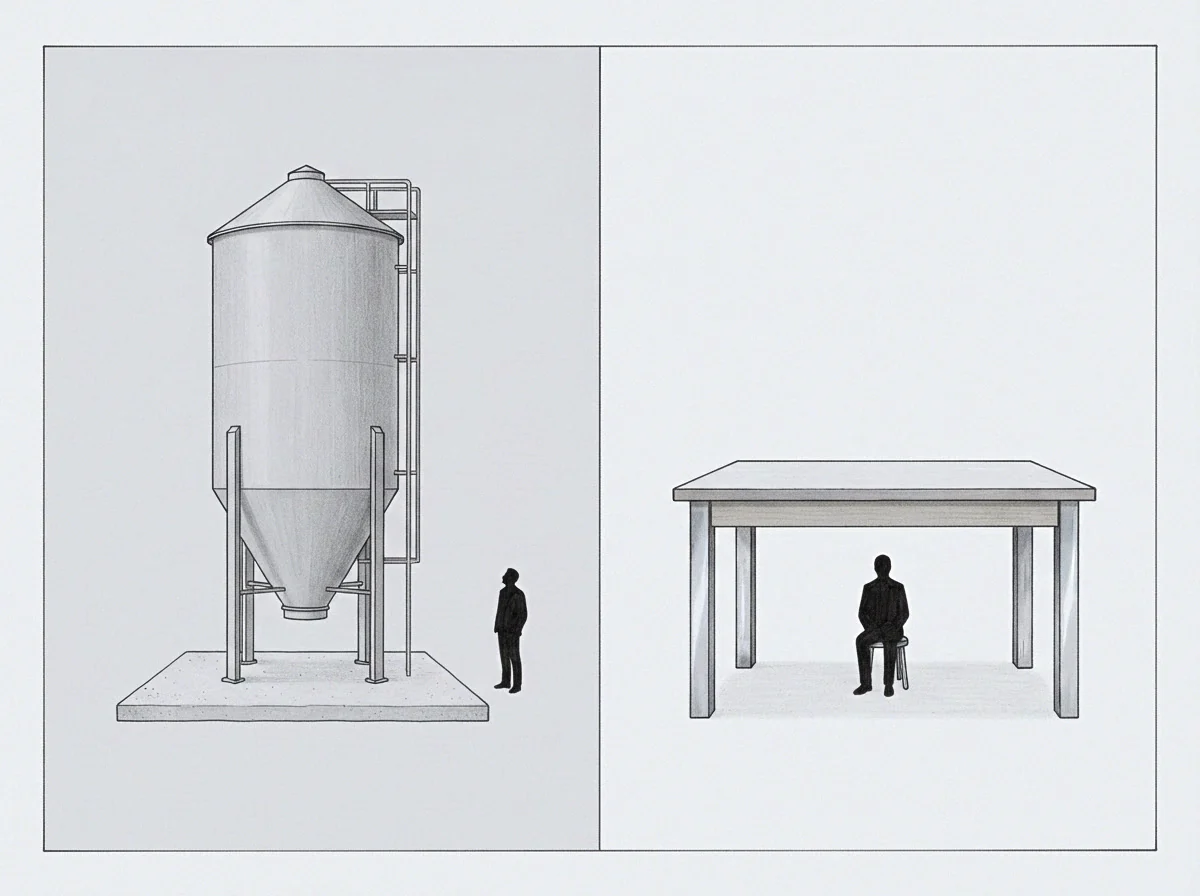
Margin
Operational models hit explicit limits at domain boundaries where systems refuse further output scaling. The wall defines the current limit of operational capability. The model ends here.

Operational Limits at the Boundary Wall
Attempts to push resource output past boundary limits without recalculating interface capacity cause operational failure. Discomfort at the boundary wall signals active computation and structural recalibration. Systemic limits reveal themselves where performance metrics fluctuate wildly under steady inputs.