
Mapping Hidden Mechanical Friction Across Compressed Operational Workflows
Compressed workflows conceal mechanical friction by shifting latency into unmonitored cognitive micro-retries and shadow channels at interface boundaries.
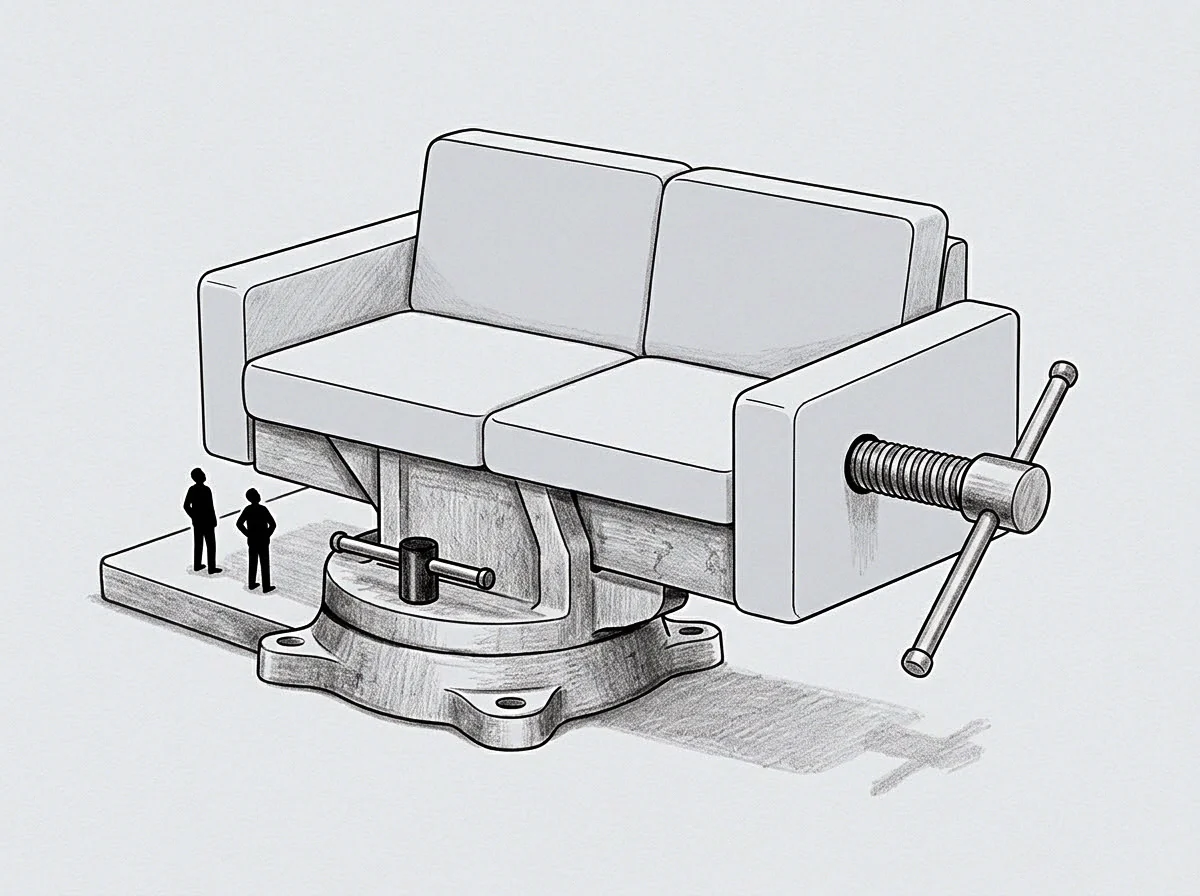
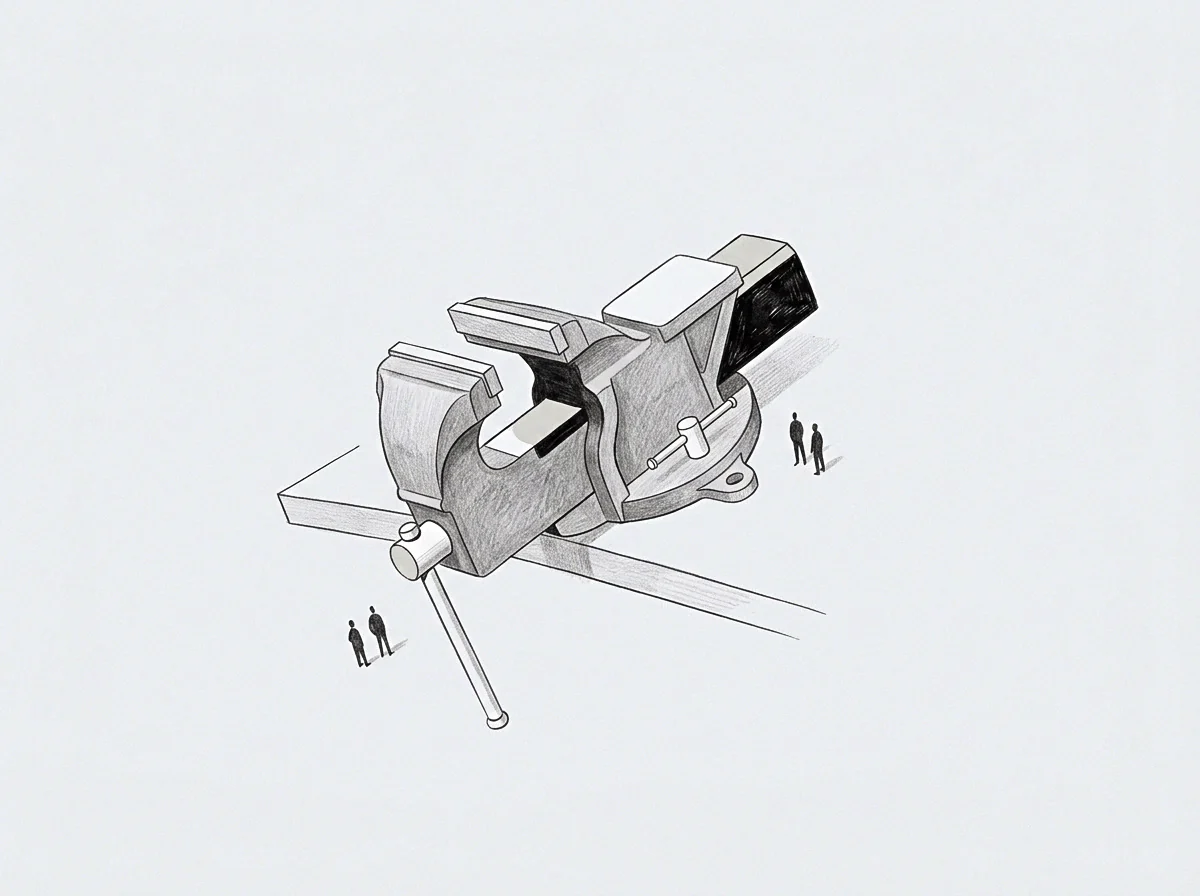
Joint
Operational compression occurs when organizations shorten execution cycles without reducing the underlying dependency count. A delivery team moves from biweekly iterations to continuous daily deployments while keeping the traditional five-stage approval chain intact. Dashboard status indicators update within minutes, giving the appearance of fluid acceleration.
Behind the interface, engineering hours dissolve into informal messaging threads to resolve unstated requirements. Operational drag accumulates silently.
Accelerating throughput without altering process geometry forces friction into the handoffs between teams. These connection points, or operational joints, absorb the structural strain of mismatched cadences. When temporal windows shrink, formal documentation protocols break down first.
Operators rely on implicit context to maintain speed, shifting the cost of clarity onto the receiving party. Throughput metrics mask structural friction. The interface absorbs the strain.
Operational drag expands when cycle times shorten without reducing interface dependency count.
When system processing speeds double, the time available to translate context between operational boundaries drops toward zero. The receiving operator must infer missing parameter specifications while maintaining execution velocity. This continuous real-time computation generates cognitive strain that never appears on workflow tracking boards.
Unstated assumptions create operational debt. Ignoring interface resistance under high throughput causes downstream defect rates to double while engineering teams exhaust their reserve capacity on unlogged translation work.
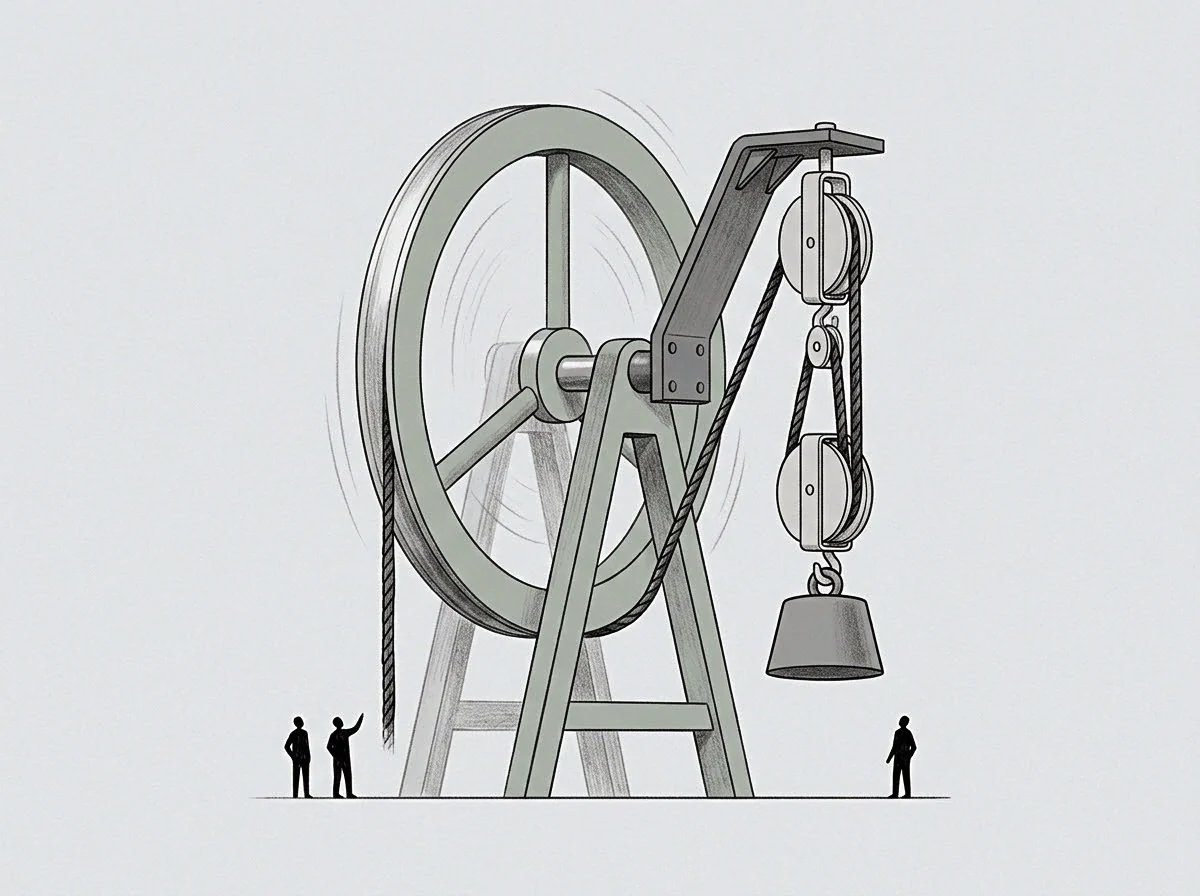
Drain
Mechanical friction in an accelerated operational workflow behaves like fluid parasitic drag within a hydraulic line. As flow velocity rises, resistance increases non-linearly at every internal bend and diameter change. In human workflows, these micro-resistances take the form of minor clarification loops, re-entered data fields, and manual verification steps.
Speed obscures local minimum traps. Systems converge on paths of least resistance.
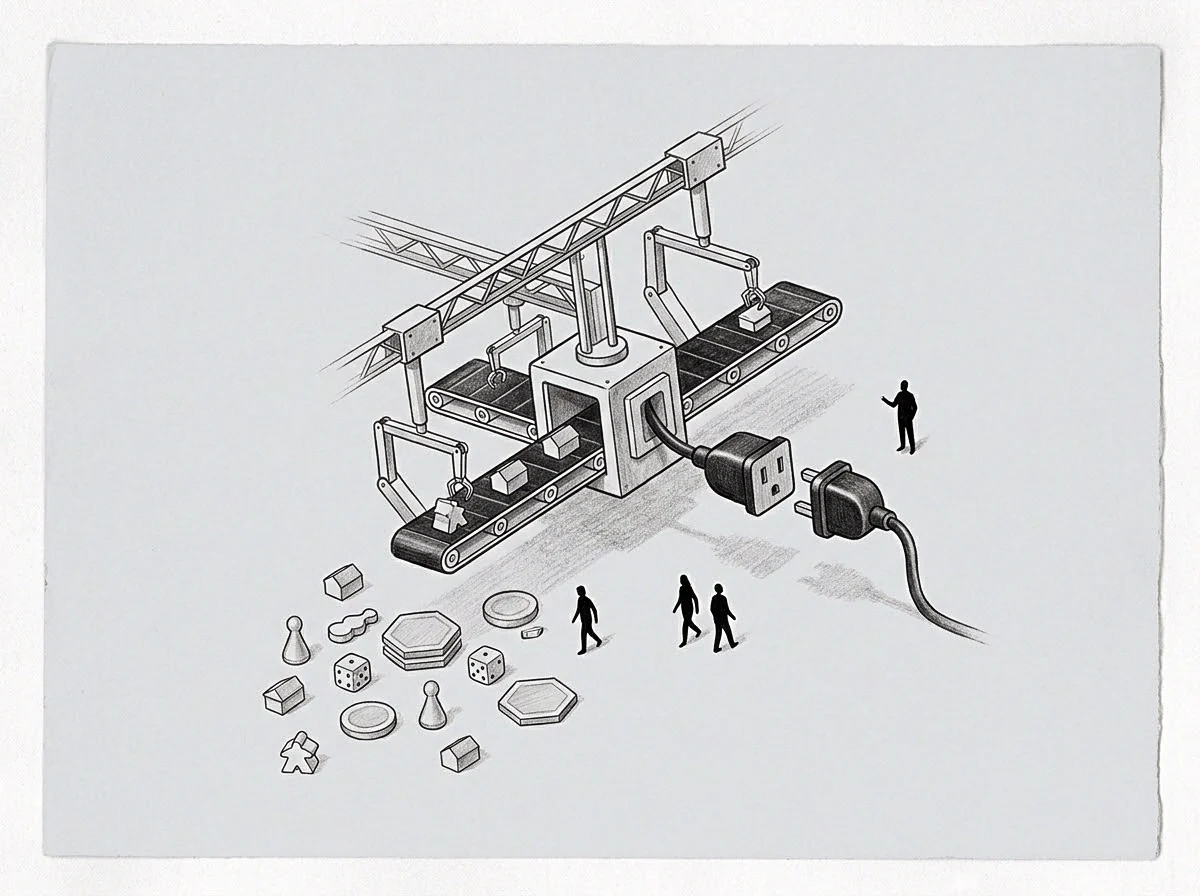
The Velocity Masking Effect
High execution speeds generate an illusion of efficiency by hiding energy loss inside rapid micro-cycles. An operator spending ninety seconds re-checking a build configuration twenty times a day loses thirty minutes of productive capacity, yet the individual incident is too small to register as an operational block. Friction changes energy into heat.
Compressed operational schedules force teams to route around formal mechanisms that introduce latency. Avoidance serves as a precise coordinate marker for system friction. Where workers bypass formal tools to use direct chat, unprocessed operational ambiguity is accumulating.
Shadows form around rigid handoffs.
Quantifying Latent Energy Offsets
Structural friction manifests across three distinct operational failure modes when timelines compress:
- Implicit Context Carryover Information omitted from abbreviated handoff artifacts forces receiving operators to infer intent, generating silent clarification delays.
- Shadow Exception Handling Unscripted manual interventions resolve system edge cases quickly without logging the underlying process defect in the primary repository.
- Interface Schema Skew Mismatched structural definitions between adjacent teams create recurring validation friction during final system integration steps.
The accumulation of these unlogged micro-retry cycles creates a wide gap between nominal velocity and true operational yield. Teams report high completed task counts while total output value stagnates. Latency expands behind green metrics.
When operational compressed processing windows shrink below context transfer limits, systems dissipate energy into informal communication channels.
The queue appears empty from the management console because work moves into unmonitored chat threads before reaching the review stage.
Grid
Evaluating operational structures requires mapping handoff friction against execution velocity. Standard workflow topologies display distinct friction profiles when subjected to temporal compression.
| Compression Model | Primary Friction Vector | Micro-retry Frequency | Structural Friction Index |
|---|---|---|---|
| Batch Size Reduction | Context Transfer Latency | Moderate | Low |
| Concurrent Pipeline Execution | Interface Boundary Collision | High | Severe |
| Continuous Push Cadence | Validation Schema Drift | Very High | Critical |
Consider a continuous delivery baseline where batch sizes were reduced by seventy percent while sign-off dependencies remained unchanged. Assume a team of six engineers pushing code to production four times daily. Under the original monthly deployment model, sign-off reviews consumed twelve hours per release cycle.
Under the compressed schedule, engineers perform twenty sign-off requests per day, consuming three minutes per interaction in context switching alone. The total time spent on verification increases from twelve hours per month to sixty hours per month. The process looks faster on a per-commit basis, but total operational overhead expands fivefold.

How Does Compression Convert Latency into Cognitive Friction?
Compression reduces the temporal cushion available to absorb unexpected variance. When a step in a sequential workflow encounters an anomaly under compressed conditions, the delay ripples backward immediately. Operators perform micro-retries to clear the pipeline before the blockage becomes visible on operational dashboards.
Silent retries consume actual capacity.
A process compressed beyond its physical dependency threshold transforms operational latency into human intervention debt.
Operational compression accelerates context decay. System efficiency degrades when the frequency of micro-retries surpasses the capacity of operators to process background exceptions. Enforcing an explicit asynchronous review boundary converts informal messaging traffic back into tracked ticket latency.

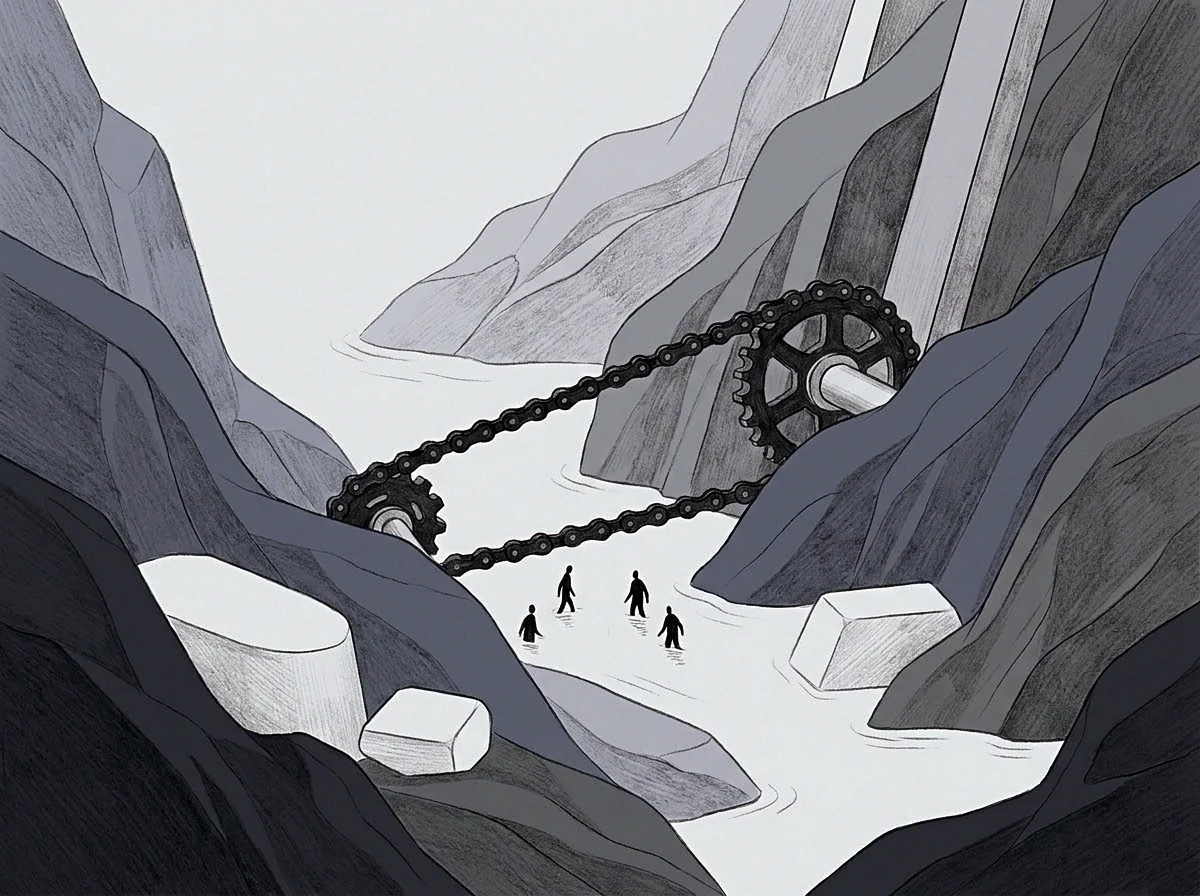
Channel
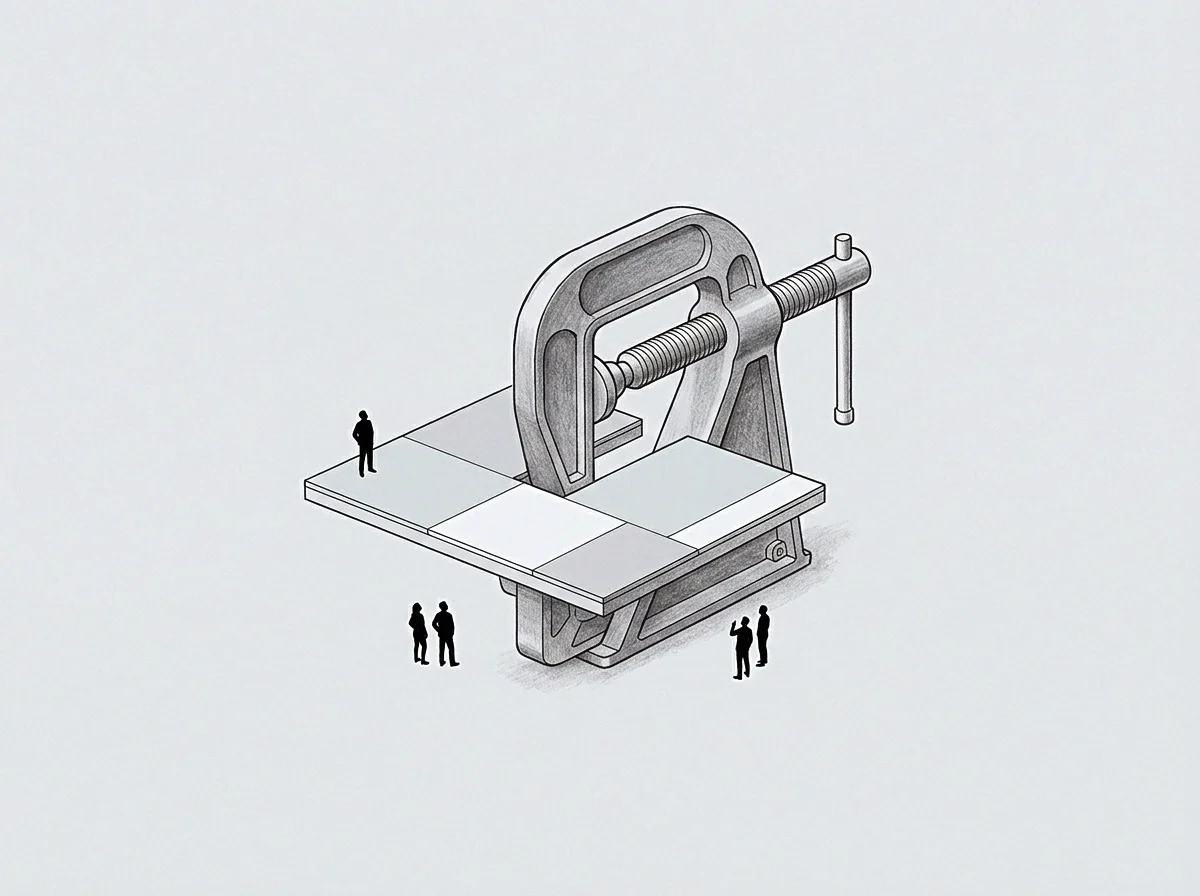
When formal process channels become restrictive during operational acceleration, work naturally routes around the barrier. The wall represents the maximum processing capability of the formal system model. Discomfort at the boundary signals that computational effort is replacing simple retrieval.
Work routes around rigid boundaries.
Surveying System Boundaries and Workarounds
Informal operational workarounds develop in predictable sequential phases when formal systems fail to adapt to compressed timelines:
- Operators encounter formal approval walls during accelerated execution phases.
- Teams construct parallel informal communication routes to bypass latency points.
- Operational memory shifts from documented schemas into tacit personal habits.
- System metrics record zero friction while actual operational capacity degrades continuously.
The volume of work moving through informal channels measures the discrepancy between formal workflow assumptions and actual execution demands. Unprocessed state builds latent tension. When shadow channels carry more than twenty percent of total workflow traffic, formal system dashboards cease to reflect operational reality.
Structural workarounds signal the precise location where automated workflow models collide with unmodeled operational realities.
Whether organizational systems can reincorporate shadow pathways back into formal architecture without introducing the original mechanical latency remains unresolved.
Margin
The true boundary of an operational model is established by the volume of friction it can absorb before execution stalls. Computing the value gradient requires measuring nominal execution speed against effective operational yield. Measurements reflect active gradient slopes.
The distance between these two vectors reveals the magnitude of hidden friction.
Computing the Value Gradient Above Baseline
Mirroring the friction vector above the baseline uncovers the latent operational potential trapped in structural workarounds. Systems operating under heavy compression routinely operate far below their theoretical maximum because energy dissipates into manual coordination work. Removing mechanical drag unlocks this unspent volume without increasing operator strain.
The boundary marks system limits. Mapping hidden mechanical friction requires inspecting the exact interfaces where operators override automated steps or initiate informal verification loops. Tracking these coordinates yields a true structural diagnostic.
The operational gradient carries no inherent moral value; it simply records where energy moves and where resistance sits.
The true measure of process throughput resides in the total volume of work completed without unrecorded intervention.