
Quantifying Residual Capacity Boundary Limits Where Operational Models Resist Structural Computation
Residual capacity boundary limits are quantified by measuring secondary communication friction and error recovery costs when operational models obscure limits.
Frontier
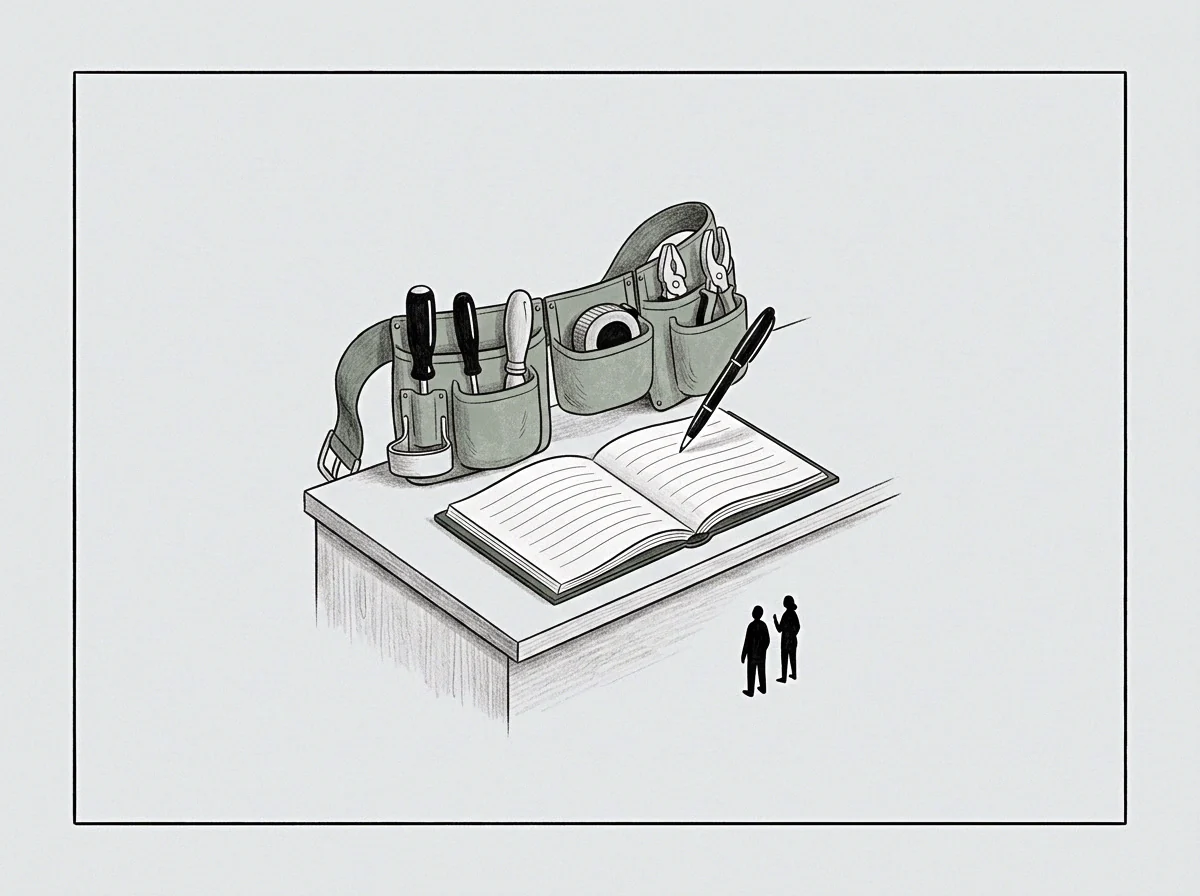
A production pipeline runs twenty percent over rated volume for three quarters while the spreadsheet tracking it records stable performance. The spreadsheet measures headcounts, gross logged hours, and ticket resolution speed. Beneath those variables, senior engineers take on undocumented handoffs late into the evening, turning sleep into hidden operating slack.
Where the formal model treats throughput as linear arithmetic, the physical operation behaves like an elastic membrane nearing plastic deformation.
Structural computation fails here because organizational routines protect their internal ambiguity. When leadership requests a definitive mathematical boundary for system throughput, the stressed departments resist formalization. Standard capacity equations demand fixed values for task duration, inter-arrival variance, and rework probability.
Daily execution relies instead on informal trades between teams, ad hoc reprioritization, and discretionary effort that evaporates when directly observed. The working boundary stays invisible because making it legible would strip away the unmonitored latitude workers rely on to prevent collapse.
Unaccounted manual interventions multiply exponentially as operating velocity approaches the true ceiling of an informal buffer.
Residual capacity defines the uncommitted energetic margin remaining in an operating structure before service quality degrades permanently. Standard balance sheets and task trackers fail to register this reserve because they observe activity rather than elasticity. When an operational model resists structural computation, an analyst reads the slope of secondary friction indicators instead of waiting for explicit capacity coefficients.
Deformation Signs in Administrative Flow
Stress registers first in transmission intervals. When an operational unit approaches its limit, processing times inside sub-assemblies remain steady while queues between them lengthen. Department heads defend their nominal velocity by narrowing intake gates.
They reject ambiguous specifications, defer scheduled maintenance, and demand pre-cleared tickets. These screening protocols protect local team metrics at the expense of systemic throughput.
The resulting diversion creates shadow backlogs. Work orders accumulate in unindexed mailboxes, draft documents, and verbal agreements. Conventional enterprise resource tools show green status bars across every monitored department while actual delivery times quadruple.
The business consumes capital reserves to finance the latency.
Relying on untracked effort to bridge model deficiencies converts calculated operating margins into severe tail exposures during demand spikes.

Friction
Friction generates heat before it causes structural shearing. In administrative and industrial workflows, this heat takes the form of communication churn. When an operational structure cannot model its own physical limits, employees spend increasing fractions of their shifts coordinating work rather than executing it.
Status meetings replace functional output, and re-planning sessions crowd out line execution.
This dynamic follows an inverse square dissipation curve. As unspent capacity drops toward zero, the communication overhead required to triage each marginal unit of production escalates toward infinity. A line supervisor balancing three concurrent projects requires negligible cross-checking; that same supervisor balancing eight overloaded work streams spends thirty-two hours a week establishing priority sequences among competing stakeholders.
The queue absorbs the labor force. The model notes high employee utilization and infers operational vigor, but what it actually records is the capacity cost of institutional panic.
Diagnostic Variance in Latent Buffers
Testing for real boundary limits requires isolating variables that operational management cannot easily alter for performative reviews. Output volume is easily manipulated through quality compromises, but unscheduled triage frequency resists concealment.
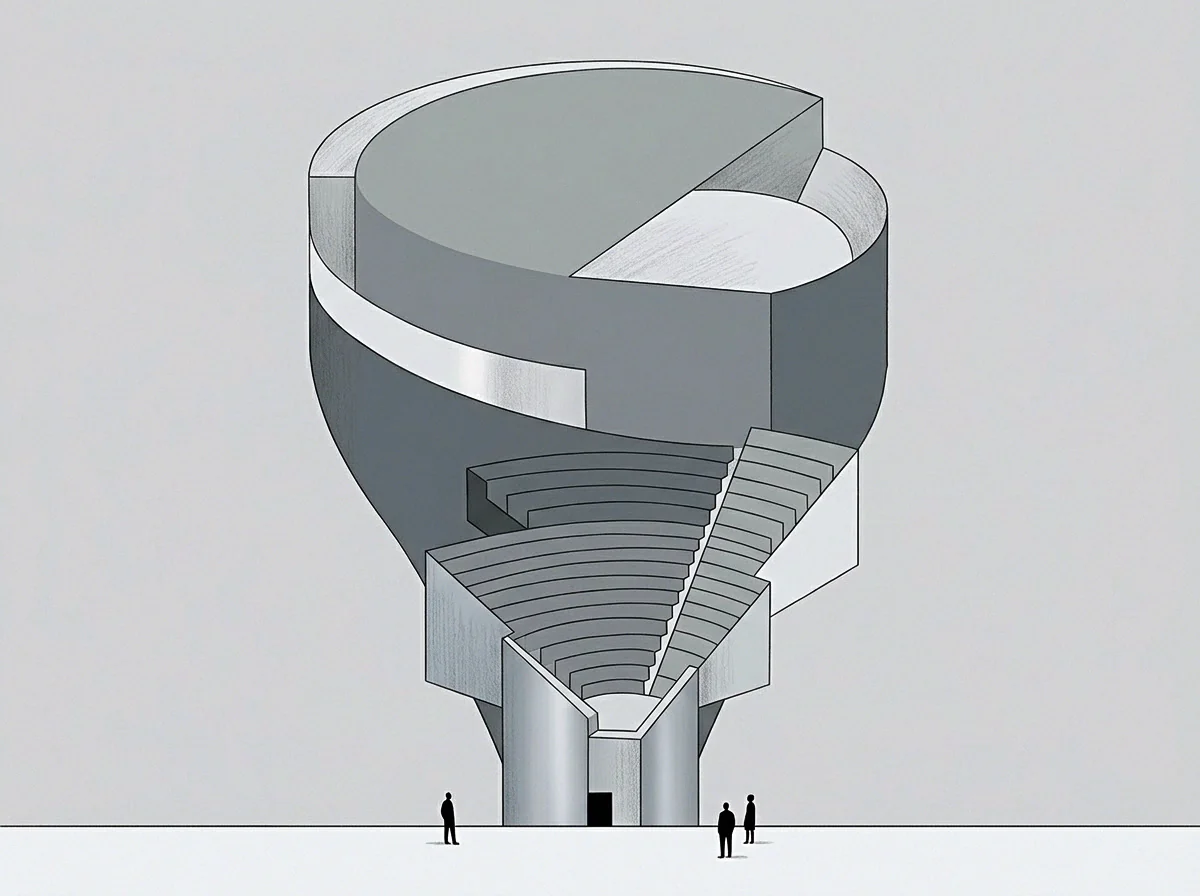
Tracking the ratio between scheduled tasks and spontaneous escalations exposes the erosion of structural reserve. In stable regimes, unscheduled interventions account for less than five percent of weekly labor expenditures. As the true operational boundary approaches, this metric climbs past thirty percent, even while headline productivity indexes show no deviation from historical baselines.
| Regime State | Off-Model Hours Ratio | Triage Escalation Rate | Downstream Error Variance |
|---|---|---|---|
| Nominal Slack | Below 0.04 | Infrequent weekly interventions | Stable within tolerance bands |
| Plastic Creep | Between 0.05 and 0.18 | Daily coordination conferences | Localized metric skewing |
| Terminal Boundary | Above 0.20 | Continuous management intervention | Correlated system failure events |
The boundary asserts itself through systemic unpredictability. Downstream error variance widens because workers can no longer predict when upstream dependencies will deliver inputs. To insulate themselves, downstream operators establish unauthorized local stores of materials, draft documents, and pre-approved sign-offs.
These safety stashes distort inventory reporting and obscure actual supply shortages from planning software.
Whether this creeping informational opacity stems from defensive employee self-preservation or from the mathematical impossibility of modeling distributed adaptive networks under severe resource starvation remains an open technical contention.

Strut
Physical machinery offers immediate clarity regarding capacity limits. A steel strut compresses predictably under an axial load until reaching its yield point. When the load recedes, the strut regains its initial length provided the stress stayed inside the elastic domain.
Once the load drives internal stress past the yield threshold, molecular slip occurs and the geometry permanently deforms.
Human operating units lack such clear material definitions, disguising plastic deformation as organizational resilience. A company that operates beyond its design limit for twelve consecutive months rarely breaks suddenly. It gradually sheds non-urgent institutional functions, including mentoring programs, documentation updates, exploratory testing, regulatory reconciliation, and infrastructure hardening.
The institution thins its structural members to preserve its external silhouette.
While the system survives the quarter, physical load-bearing capacity declines.

Mechanics of Phantom Compliance
When leadership imposes production targets that exceed computed feasibility, the organization develops phantom compliance mechanisms. Field operators understand that arguing with the formal spreadsheet results in friction. They choose the path of lowest personal resistance, confirming the model’s assumptions on paper while decoupling actual behavior from documented protocol.
Consider an enterprise logistics network operating forty distribution hubs across three time zones. Head office algorithms calculate that each driver can complete twenty-four delivery stops per eight-hour shift, assuming five minutes per stop and optimized routing vectors. Structural computation asserts thirty percent spare capacity remains across the fleet.
Out in the field, drivers discover that loading docks are congested, security gates demand manual logging, and freight elevators fail regularly.
- Shadow bypass protocol routes freight around corporate checkpoints using untracked courier vehicles paid out of discretionary petty cash reserves.
- Metric decoupling sequence records deliveries as completed upon arrival at municipal boundaries rather than upon signed customer receipt.
- Selective maintenance deferral keeps delivery trucks on active highways by ignoring non-fatal electrical warning lamps until component seizure halts the axles.
The field organization runs its own offline economy to sustain the corporate fiction. The executive dashboard displays immaculate mathematical efficiency, yet underlying capital infrastructure deteriorates three times faster than predicted by depreciation schedules.
Field operators simply deliver what the software schedules, exactly as corporate metrics demand.

Margin
Quantifying residual capacity requires calculating the delta between nominal throughput and true structural expenditure. Because operational managers avoid mathematical models that limit their discretionary power, this calculation cannot rely on voluntary self-reporting; it must derive from structural leakage metrics.
One primary leakage vector is staff attrition among mid-level coordinators. Senior executives set goals while junior staff execute tactical units, leaving mid-level coordinators to absorb the difference between computational fantasy and physical reality. When true residual capacity drops below zero, the capacity cost of maintaining operational cohesion falls entirely on this cohort.
Tenure drops, replacement costs rise, and institutional knowledge vanishes from the organization.
Operations maintain nominal performance until sudden breakdown occurs.
A second leakage vector sits in warranty claims, rework hours, and customer concessions. When throughput exceeds true capacity, output velocity is preserved by externalizing errors onto downstream clients. These costs appear in administrative ledgers months later, severed from the production decisions that generated them.
A system operating without structural margins burns its institutional reputation to buy temporary schedule adherence.
Extracting the true boundary limit involves tracking the gradient of secondary recovery costs. Plotting the monetary value of discretionary rebates against total volume shipped exposes the invisible capacity wall at the inflection point where marginal revenue from extra production matches the marginal cost of rectifying defects produced by operating above design tolerance.
The Computational Barrier in Complex Systems
Formal mathematical computation fails to capture these boundaries because modern workflows exhibit non-linear emergent dynamics. In an industrial machine shop, doubling raw materials yields double the finished parts until tool wear accelerates. In knowledge production, doubling active projects squares required communication links, following quadratic scaling rules that rapidly outstrip linear labor additions.
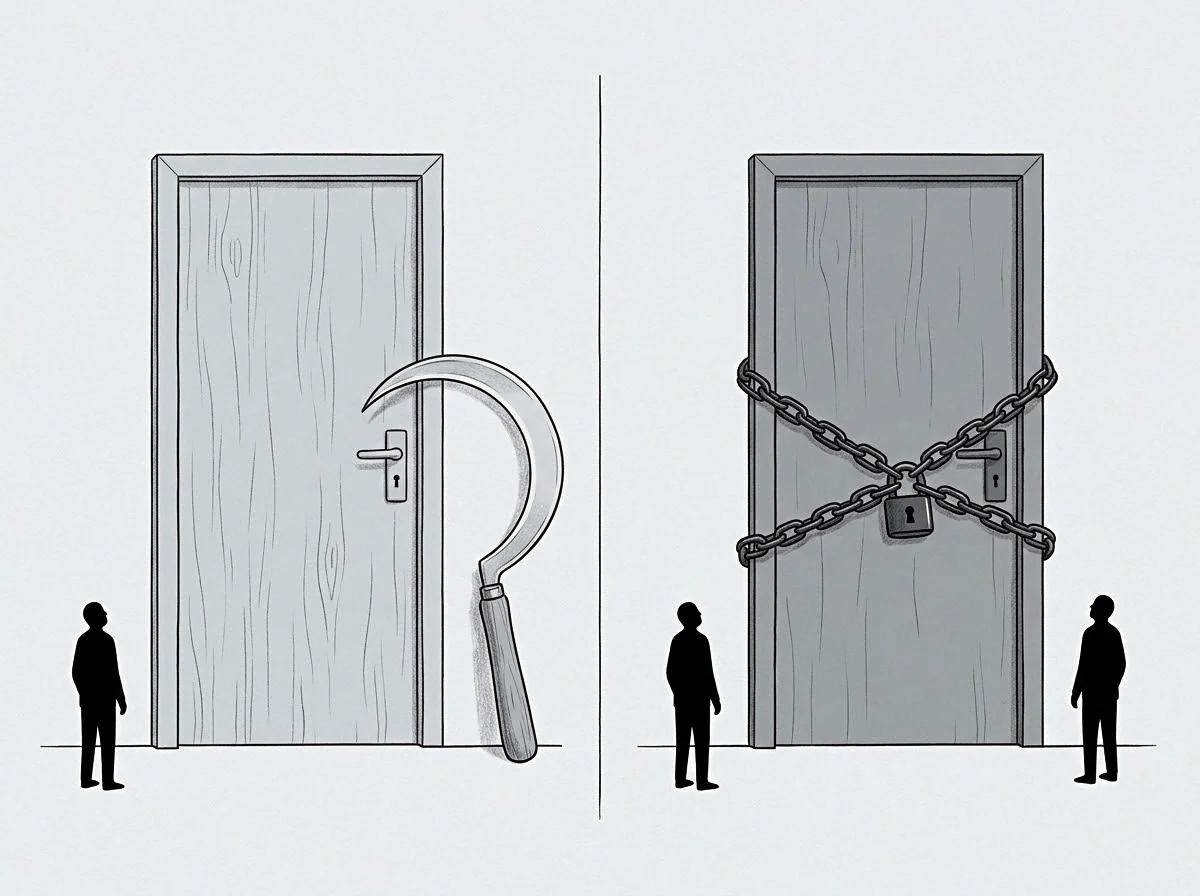
Operational frameworks resist structural computation because computing capacity reveals unpalatable trade-offs. If a formal calculation demonstrates that a division can securely deliver sixty units per month, accepting an eighty-unit contract constitutes deliberate negligence. Maintaining an ambiguous, uncomputed model allows executives to categorize subsequent failures as unexpected accidents rather than deterministic structural outcomes.
A formal service agreement containing mandatory liquidated damages for delivery delays removes this administrative refuge, forcing immediate physical reconciliation between contract volume and mechanical throughput limits.
Envelope
The operational envelope cannot expand through exhortation. It expands only through capital investment in structural dampening mechanisms or a reduction in scope. When an enterprise discovers that its models resist structural calculation, it has not uncovered a failure of mathematics, but an institutional choice to preserve operational ambiguity.
To measure the true envelope without operational cooperation, an independent evaluator isolates natural stress testing events. Unplanned holidays, supply chain disruptions, system outages, and sudden regulatory audits strip away informal workarounds used to hide boundary limits. The speed at which an organization recovers nominal cadence after a shock exposes its true residual capacity.
Resilient structures recover cleanly, while exhausted systems linger in extended state transitions.
An enterprise possessing authentic reserve capacity absorbs a twenty percent demand spike by temporarily lengthening shifts, drawing down buffer stocks, and activating redundant suppliers. Within forty-eight hours of demand normalization, backlog indicators return to equilibrium, overtime hours drop to zero, and scrap rates settle back inside standard deviations. The organizational membrane preserves its elasticity throughout the transient event.
An over-leveraged enterprise subjected to that same demand pulse enters chronic hysteresis. Overtime expenditures remain elevated for five months after volume subsides, defect rates stay volatile, and key personnel resign in clusters during recovery. The initial demand spike did not create the structural exhaustion; it merely made the absence of residual capacity undeniable by stripping away the informal human buffers masking true boundary limits.
When the true operating boundary is exceeded, secondary friction metrics double while primary productivity numbers remain motionless.