
Reconciling Divisional Operational Friction Through Continuous Enterprise Baseline Telemetry Mapping
Continuous enterprise baseline telemetry maps inter-divisional transit queues, converting friction into measurable gradients for systematic reconciliation.
Trace
An enterprise division records eighty milliseconds of compute execution while the receiving division logs four hundred milliseconds of idle wait state. The discrepancy sits in the unmonitored transit corridor between two isolated operational baselines. When divisional operators meet to discuss throughput degradation, each team displays green status panels compiled from local metrics.
The billing unit reports on-time batch dispatch while the fulfillment unit reports delayed payload receipt, leaving the missing three hundred and twenty milliseconds unrecorded in an uninstrumented queue buffer.
Operational units default to inward-facing instrumentation. Engineering measures execution cycles, product delivery measures feature velocity, and finance monitors invoice processing intervals. Each division constructs an operational baseline reflecting its local boundary conditions.
When these distinct baselines interact without continuous telemetry mapping, the enterprise experiences systemic drag at every point of handoff. Inter-divisional coordination deteriorates into speculative debate because neither division possesses telemetry spanning the interface boundary.
A telemetry pipeline operating without cross-boundary timestamps records local execution speed while obscuring transit latency.
Operational Drag Across Siloed Units
Production velocity drops when work packages transition between administrative domains. The handover between software development and security auditing illustrates this breakdown. The engineering division clears code packages within four hours of generation.
The compliance division ingests those packages into an asynchronous queue with an average holding interval of six days. The compliance dashboard reflects a two-hour review completion metric calculated exclusively from the moment an auditor claims the ticket.
The enterprise experiences a total cycle time of six days and two hours, yet divisional scorecards display four-hour and two-hour execution records. The unmeasured holding interval represents pure operational drag. Without telemetry mapping the state of artifacts during transit, divisional leaders attribute delays to organizational culture or personnel capacity.
The true cause remains unmapped transport queues across operational seams.
Divisional friction expands along predictable organizational junctures:
- Asynchronous Intake Queues create unmonitored holding states where artifacts wait for manual ownership assignment across team perimeters.
- Mismatched Data Schemas force downstream operators to perform manual transformation routines before initiating scheduled processing steps.
- Conflicting Operational Cadences generate periodic batch pileups when daily release pipelines feed monthly compliance verification windows.
Discrepancies in Local Telemetry Records
Measurement divergence begins with differing definitions of operational milestones. An engineering team marks an event complete upon transmission to an event broker. The data operations unit marks the same event complete only after schema validation, table ingestion, and index generation.
The gap between transmission and ingestion introduces unmapped drift.
When system volume increases, the duration of that unmapped state expands exponentially. Local monitoring tools continue to publish positive health signals because the event broker successfully receives the payload. The receiving database stutters under lock contention, yet neither operational group observes the compound degradation in a unified telemetry view.
Uncorrected telemetry blind spots compound until the enterprise pays for operational friction through delayed customer fulfillment, inflated hosting expenses, and degraded employee retention.
Joint
Enterprise architecture consists of discrete functional components connected by organizational seams. When telemetry streams capture events only inside component nodes, the connecting seams become informational voids. The joint between two divisions functions as an operational resistor where friction generates heat in the form of duplicated verification steps, prolonged escalation meetings, and defensive documentation protocols.
Continuous baseline telemetry mapping replaces localized reporting with continuous, cross-cutting observation of enterprise workflows. Telemetry agents deployed at the perimeter of each division record artifact state, payload volume, cryptographic provenance, and timestamp metadata at ingress and egress points. The enterprise constructs a unified telemetry fabric that models the entire operational surface as a continuous gradient.
When inter-divisional handoffs run without shared cryptographic timestamps, the duration of cross-team coordination increases in proportion to organizational hierarchy.
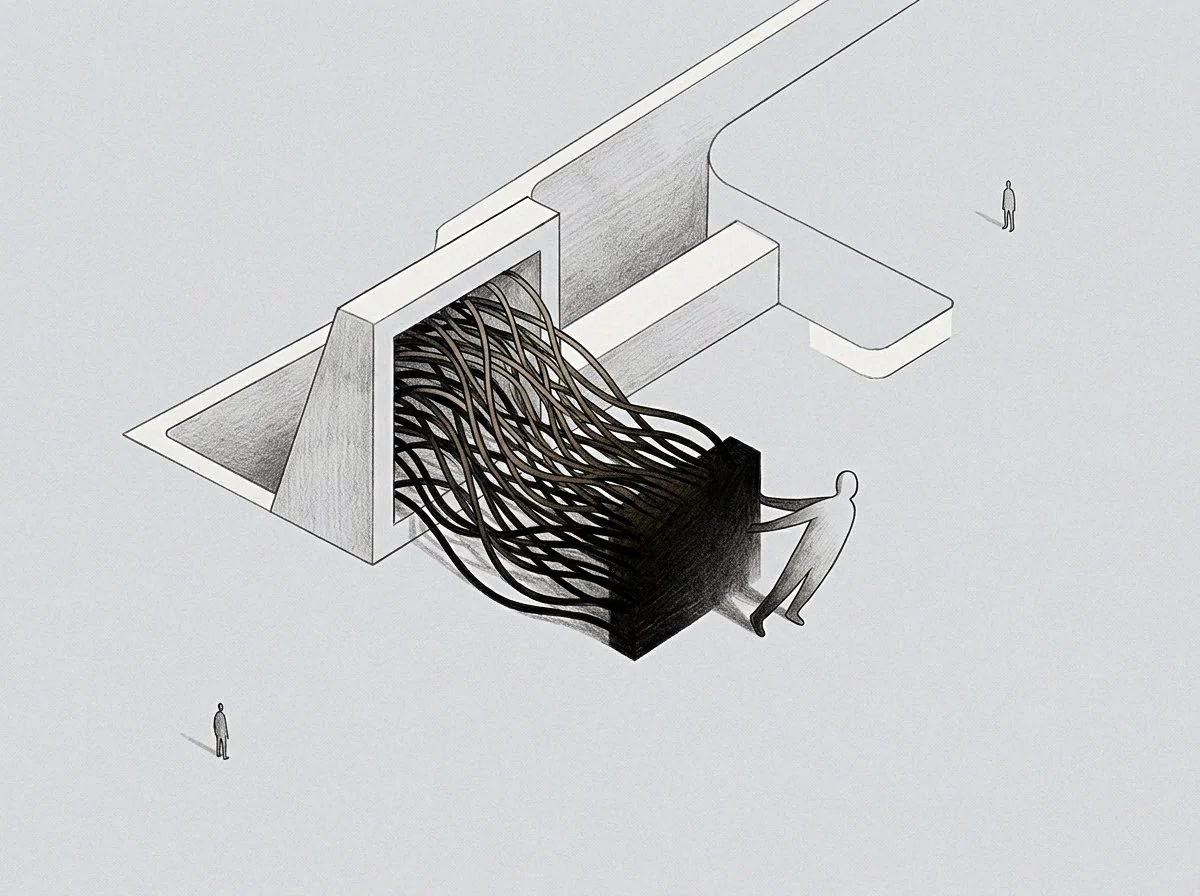
Interface Boundaries and Telemetry Gaps
The boundary separating distinct enterprise groups acts as an uncalibrated filter. Information moving across this perimeter loses contextual metadata. A customer support group logs ticket escalations with subjective urgency tags.
The sustaining engineering group ingests these escalations into a backlog prioritized by technical complexity. The translation between these two distinct semantic models introduces systemic delay.
Continuous mapping requires the deployment of unified event envelopes. Every work unit traversing an organizational seam receives an immutable tracing header containing origin parameters, transit duration, and cumulative operational latency. When telemetry capture occurs at the exact point of boundary crossing, operational friction transitions from an intangible interpersonal dispute into an observable physical metric.
| Telemetry Architecture | Measurement Perimeter | Latency Attribution | Resolution Protocol |
|---|---|---|---|
| Isolated Local Baselines | Intra-divisional execution cycles | Speculative assignment during retrospectives | Political negotiation between department heads |
| Perimeter Ingress Telemetry | Division boundary intake points | Queue holding time attributed to receiving unit | Service level objective reviews |
| Continuous Baseline Mapping | End-to-end enterprise transit gradient | Precise timestamp delta across organizational seams | Automated queue rebalancing and schema alignment |
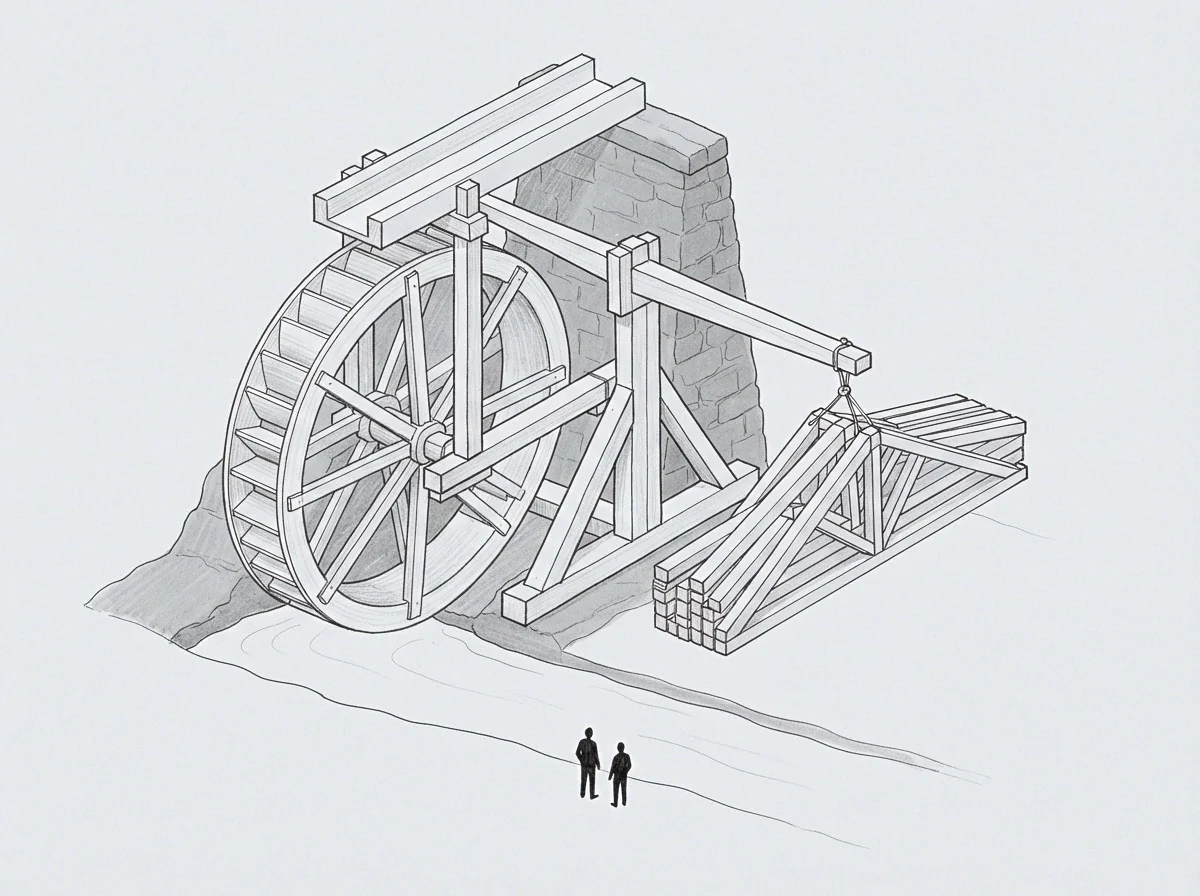
Structural Properties of Cross-Division Handoffs
Every organizational interface possesses three measurable attributes: transit latency, transformation overhead, and dropped payload volume. Transit latency defines the duration an artifact remains in unassigned buffers. Transformation overhead measures the compute and human labor expended to reformat payloads for downstream compatibility.
Dropped payload volume captures total communication failures requiring complete cycle re-initiation.
A continuous telemetry pipeline records these properties across every enterprise interface. The resulting telemetry map identifies specific operational joints that introduce disproportionate resistance into the workflow. Management allocates remediation capital directly to high-friction interfaces rather than distributing general improvement mandates across entire operating units.
A formal interface contract specifying timestamp synchronization, standardized event headers, and deterministic payload schemas converts volatile cross-division boundaries into measurable operational conduits.
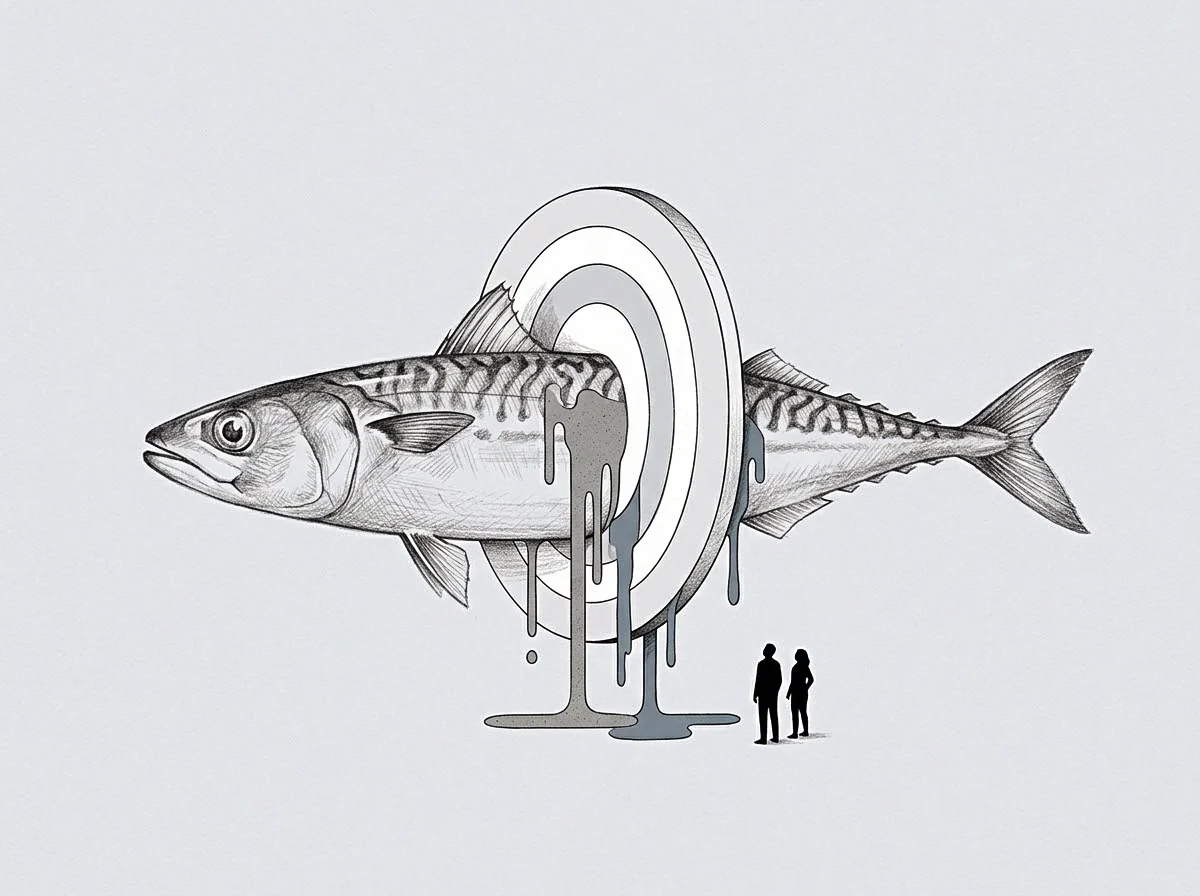
Gauge
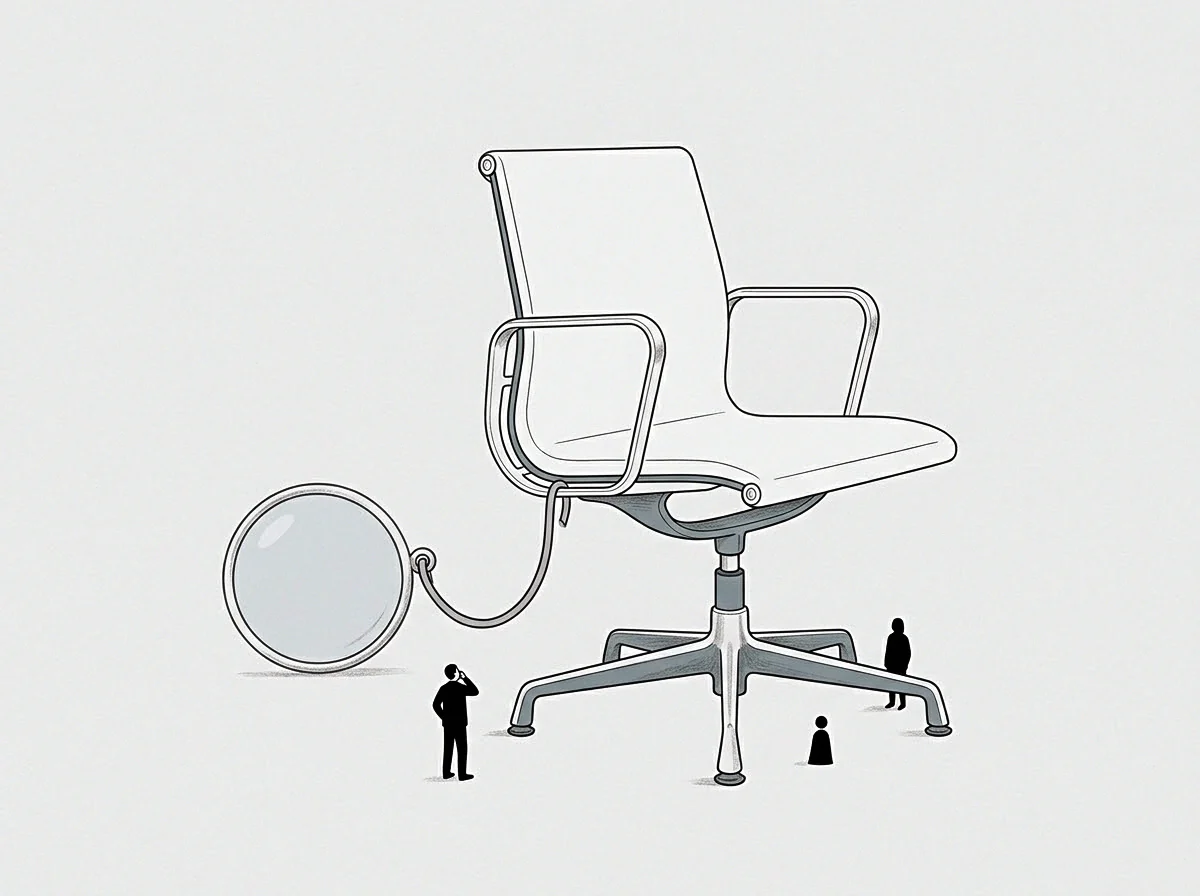
Accurate measurement demands an instrument calibrated to the true speed of enterprise transactions. High-frequency operations generate thousands of cross-divisional handoffs every hour. Monthly performance retrospectives and quarterly business reviews fail to capture transient operational spikes that degrade enterprise velocity.
A continuous operational gauge samples inter-divisional telemetry signals in real time, computing moving baselines that reflect true organizational throughput.
Baseline calculation relies on statistical process control applied to transit latencies. When a work package moves from sales contracting to finance provisioning, the telemetry stream calculates the rolling median duration and the ninety-fifth percentile boundary. A sudden expansion of the ninety-fifth percentile boundary indicates emergent friction long before project milestones experience noticeable slippage.
A rolling telemetry baseline identifies emergent coordination friction before project delivery timelines breach contractual thresholds.
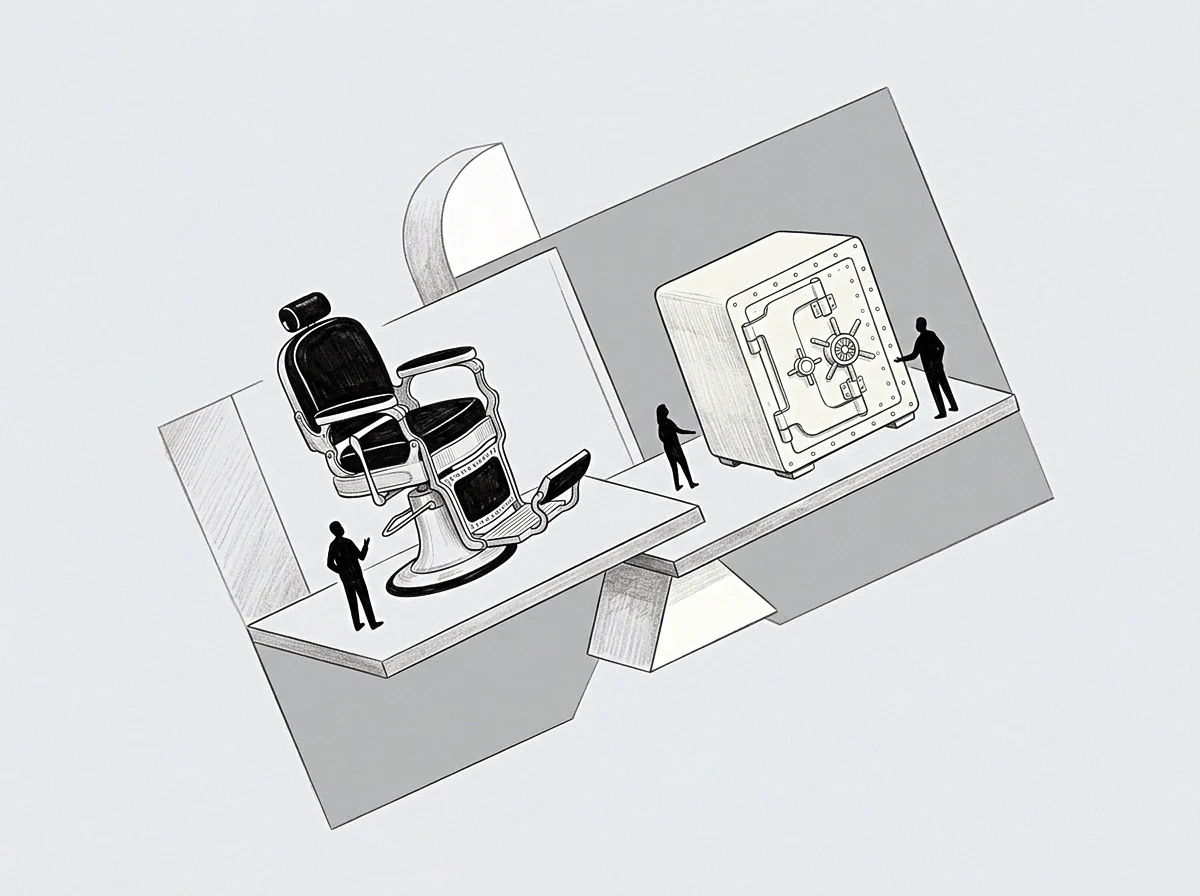
Can Baseline Calibration Prevent Structural Drift?
Dynamic calibration accounts for seasonal volume shifts and operational adjustments without triggering false degradation alarms. A financial settlement division processes triple its normal volume during the final three business days of each fiscal quarter. A static performance threshold flags this surge as an operational failure.
A dynamic baseline telemetry engine calculates baseline drift by comparing real-time operational gradients against historical reference envelopes for identical operating periods. The engine isolates structural friction from intentional capacity utilization. When friction appears inside a standard operating window, the system isolates the specific divisional seam responsible for the latency anomaly.
Deploying an operational telemetry gauge follows an exact diagnostic sequence:
- Instrumenting Boundary Egress logs outgoing artifact states and attaches synchronized high-resolution timestamps to every transaction record.
- Streaming Ingress Telemetry captures receipt confirmations and records initial processing states within the downstream divisional environment.
- Correlating Trace Identifiers matches cross-boundary transaction pairs across distributed event logs to compute precise transit deltas.
- Generating Baseline Distributions builds rolling statistical profiles of inter-divisional handoff latency across continuous operating windows.
Latency Signatures in Queue Divergence
Divergence signatures emerge when downstream intake rates drop below upstream output rates. In an unmonitored environment, upstream producers continue pushing volume into intermediate message brokers or document queues, exhausting buffer capacity and triggering silent re-transmissions.
Continuous telemetry maps this divergence as an escalating gradient. The telemetry system visualizes the queue depth between the two divisions as an accumulating mass of uncomputed work. Operators identify the precise constraint, whether attributable to downstream resource exhaustion or upstream batch scheduling misconfigurations, without convening inter-divisional discovery sessions.
Incoming files frequently arrive at the downstream boundary without the mandatory metadata required to initiate scheduled processing.

Span
Reconciliation occurs when enterprise leaders possess objective telemetry detailing the cost and location of operational friction. Subjective grievances regarding inter-departmental responsiveness dissolve in the presence of continuous baseline telemetry maps. Leaders examine verifiable data streams showing precise handoff latencies, queue holding durations, and data transformation costs across every organizational boundary.
The enterprise shifts from retrospective remediation to real-time structural adjustment. When baseline telemetry indicates rising friction across a specific interface, automated routing logic rebalances payload distribution, or engineering teams deploy targeted schema adapters to eliminate manual transformation bottlenecks. Continuous mapping converts organizational friction into an engineering parameter subject to systematic reduction.

Reconciling Systemic Variance Across Divisions
Operational variance across divisions stems from misaligned incentives and disconnected telemetry loops. The marketing division optimizes for lead volume, pushing unverified records into the sales operations pipeline. The sales operations team expends thirty percent of its weekly labor cleaning invalid contact entries before distributing accounts to field representatives.
An isolated marketing baseline displays high efficiency, while the sales operations baseline shows degraded conversion velocity.
Continuous enterprise baseline telemetry mapping spans the entire customer acquisition lifecycle, linking lead generation to ultimate revenue recognition. The telemetry engine surfaces the compound cost of raw lead ingestion, showing that unverified records cost the enterprise more in operational labor than they generate in pipeline value. Marketing adjustments follow directly from telemetry evidence, aligning upstream output parameters with downstream intake requirements.
Stabilization Through Shared Signal Observability
Shared observability creates operational parity between disparate divisions. When both sides of an organizational joint observe the exact same telemetry stream, collaborative troubleshooting replaces cross-functional blame. Teams detect friction patterns before they affect enterprise delivery schedules.
The continuous telemetry baseline functions as an impartial witness to all operational exchanges.
Maintaining long-term operational harmony across enterprise divisions depends on anchoring all inter-departmental performance discussions to continuous telemetry maps rather than periodic self-reported status reviews.