
The Gradient Computed From Value And Carrying No Judgment
A gradient computed from value measures directional change along an established coordinate without introducing qualitative assessment or moral judgment.

Axis
A software deployment running at a direct cash deficit of twelve thousand dollars a month while engineering velocity metrics climb steadily over three quarters shows how operational paths diverge. Bank balances decline along a cardinal monetary scale, while feature output accelerates along an ordinal release scale. Evaluating the system requires tracking these two lines separately rather than collapsing them into a single metric.
Value operates as a baseline dimension on which operational states rest; when a metric shifts, the resulting slope indicates direction and angle without assigning personal fault to the operator in the role.
Mathematical calculations of change across space treat decline and expansion as simple geometric facts, carrying no moral weight. In physical environments, potential energy drops along a downhill slope because gravity exerts constant pull. Organizational systems follow the same dynamic: when input falls below maintenance thresholds, execution drifts down the path of least resistance.
Calling this movement a failure of character merely obscures an otherwise plain calculation of force, mass, and drag.
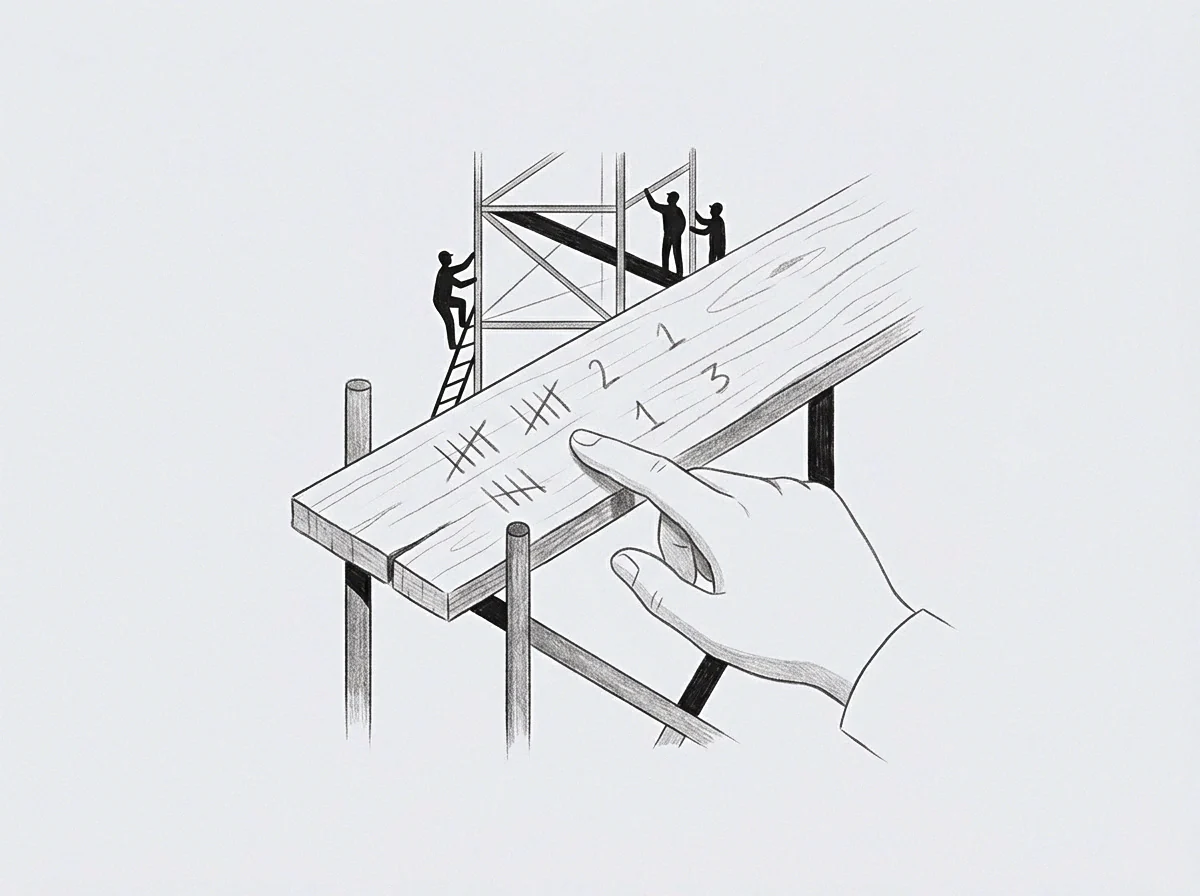
Scalar Drift and Cardinal Price
Financial accounting tracks cardinal figures through standardized currency units, while functional utility often runs on ordinal scales where preferences sit in rank order without fixed intervals. Conflating ordinal rank with cardinal quantities distorts operational reviews. An operator might spend substantial capital on software tooling that requires almost no engineering attention, while a minor contract revision takes weeks of executive focus, representing an operational cost that never appears on an invoice.
The financial record registers direct outlay, while energy allocation follows the geometry of the workflow. To measure operational changes over time, an operator plots coordinates from clear indicators like elapsed hours, capital burn, or code commits. The rate of change across coordinates defines a slope, showing whether the current posture draws down or preserves organizational capacity, separate from external opinion.
A monetary deficit recorded alongside rising software velocity marks two distinct coordinates on separate operational fields.
Derivation Without Moral Grading
Building an analytical framework requires removing judicial terms from day-to-day metrics. Labeling outcomes as poor performance or flawed choices conceals the mechanical drivers behind operational changes. If a sales pipeline drops forty percent over a fiscal quarter, the decline traces back to shifts in market demand, contact frequency, or message positioning.
Isolating the downward rate as a physical vector lets the operator determine the precise force needed to correct it.
Grading individuals creates defensiveness across teams, leading staff to hide markers and obscure actual operational conditions. When baseline metrics remain neutral coordinates, participants report operational status without concern over personal rating. That clarity allows the enterprise to map its path accurately before cash reserves run low.
The central operational question is whether the measured rate of change matches the organization’s destination, or whether unaddressed factors are pulling the system toward a lower resting state.

Descent
Physical bodies drift downhill without ongoing propulsion because gravity draws mass toward lower potential states. Organizational structures and individual routines follow the same vector patterns whenever external driving forces stop. Moving along the path of least resistance is the standard equilibrium for any system subject to energy constraints.
Treating this downward shift as an automatic physical reaction helps the observer map actual operational dynamics.
Before spatial transformation occurs, operational momentum drifts toward local minima whenever daily execution defaults to routine tasks. These positions represent stable states where immediate effort drops to a minimum, even if higher performance plateaus remain nearby. Leaving a local minimum requires applying deliberate kinetic work, whereas staying inside it takes no force at all.
How Does the Baseline Map Least Resistance?
A setpoint establishes the baseline condition around which an operating loop regulates its internal variables. In day-to-day operations, this baseline represents the working standard for output, response latency, and quality. When external demands increase without additional resources, the control loop lowers the setpoint to protect the wider operation from failure.
This adjustment happens automatically, preserving short-term stability while reducing long-term output.
Allostatic load research in biological systems shows that extended exposure to stress forces an organism to lower its baseline operating parameters to endure. Data collected from corporate workers facing sustained reorganization indicates that baseline physiological markers shift to lower functional capacities after six consecutive months of unmitigated pressure. This finding rests on metabolic marker tracking across corporate cohorts; it would be disproven if longitudinal tracking revealed zero setpoint shift under identical structural friction.
The human body reduces its energy output to protect core functions, much like a server cluster limits request processing when hitting thermal thresholds.
- Local Optimum Trapping occurs when an organization settles into a stable, low-effort routine that yields sufficient short-term revenue while blocking long-term technical evolution.
- Setpoint Attenuation develops when continuous operational overload forces leadership to lower baseline quality expectations silently to avoid total burnout.
- Velocity Confusion arises when rapid completion of low-value tasks masks the downward trajectory of primary enterprise objectives.

Local Minima in Operating Models
Operating inside a local minimum feels safe because the enterprise maintains predictable cash flows and minimal friction, leading management to assume the setup is sound. Yet the broader market frequently requires moving to higher ground, which demands immediate capital and effort. Shifting from a local minimum to a higher tier forces an initial uphill push, raising operational friction and short-term costs along the way.
Systems follow physical topology rather than stated intentions when operational energy drops.
Reference-class forecasting studies on capital allocation show that leadership teams regularly underestimate the kinetic energy required to pull out of operational dips. Research into enterprise software migrations shows that project managers tend to assume linear progress, overlooking the energy hurdle between their current baseline and the target state. This evidence rests on multi-year corporate IT deployment tracking; proving it incorrect would require controlled trials showing intuitive forecasting outperforming historical reference classes across non-stationary market regimes.
Without sustained energy input, the system simply settles back to its starting floor.
Water follows the steepest path available unless a physical barrier blocks the channel.

Mirror
Inverting a negative slope across the baseline exposes the unspent capacity sitting idle within a system. When an operator traces an avoidance pattern, the scale of that downward trajectory matches the potential energy stored on the other side of the axis. The negative vector mirrors latent performance, with every unit of effort spent navigating around an obstacle showing the scope of the remaining task.

Avoidance as Coordinate Marker
Avoidance provides distinct coordinates within an operational layout. When a founder defers reviewing contract terms, misses alignment calls, or avoids rewriting legacy code, those delays point directly to structural resistance. The scale of the avoidance reflects the size of the underlying obstacle.
Rather than treating delay as personal neglect, an observer reads it as an indicator of heavy processing demand.
Take an enterprise software firm with thirty-six months of operating history, two million dollars in annual recurring revenue, and eight engineers. Founder A oversees customer acquisition, while Founder B manages product infrastructure. Across twelve months, Founder B defers architectural fixes on the core database, focusing instead on minor interface updates.
These UI tasks take twenty hours per week for minimal customer gain, while database query latency grows fifteen percent each quarter.
| Parameter | Path of Least Resistance | Mirrored Latent Vector |
|---|---|---|
| Energy Allocation | Low initial effort spread across low-value tasks | High concentrated effort directed at core bottlenecks |
| System Friction | Deferred friction accumulating as technical debt | Immediate acute friction resolving structural impediments |
| Throughput Output | Marginal short-term gains with long-term decay | Step-function increase in long-term capacity |
| Boundary Posture | Retreats inside existing operational limits | Pushes against existing boundary constraints |
Founder B’s twenty weekly hours on cosmetic interface tasks represent a negative vector equal to the energy required for the database refactoring. The database overhaul demands heavy concentration, high cognitive effort, and risk of temporary downtime. By charting the twenty-hour diversion, both founders identify the exact bottleneck in the system.
The capacity absorbed by avoidance equals the effort available for technical repair.
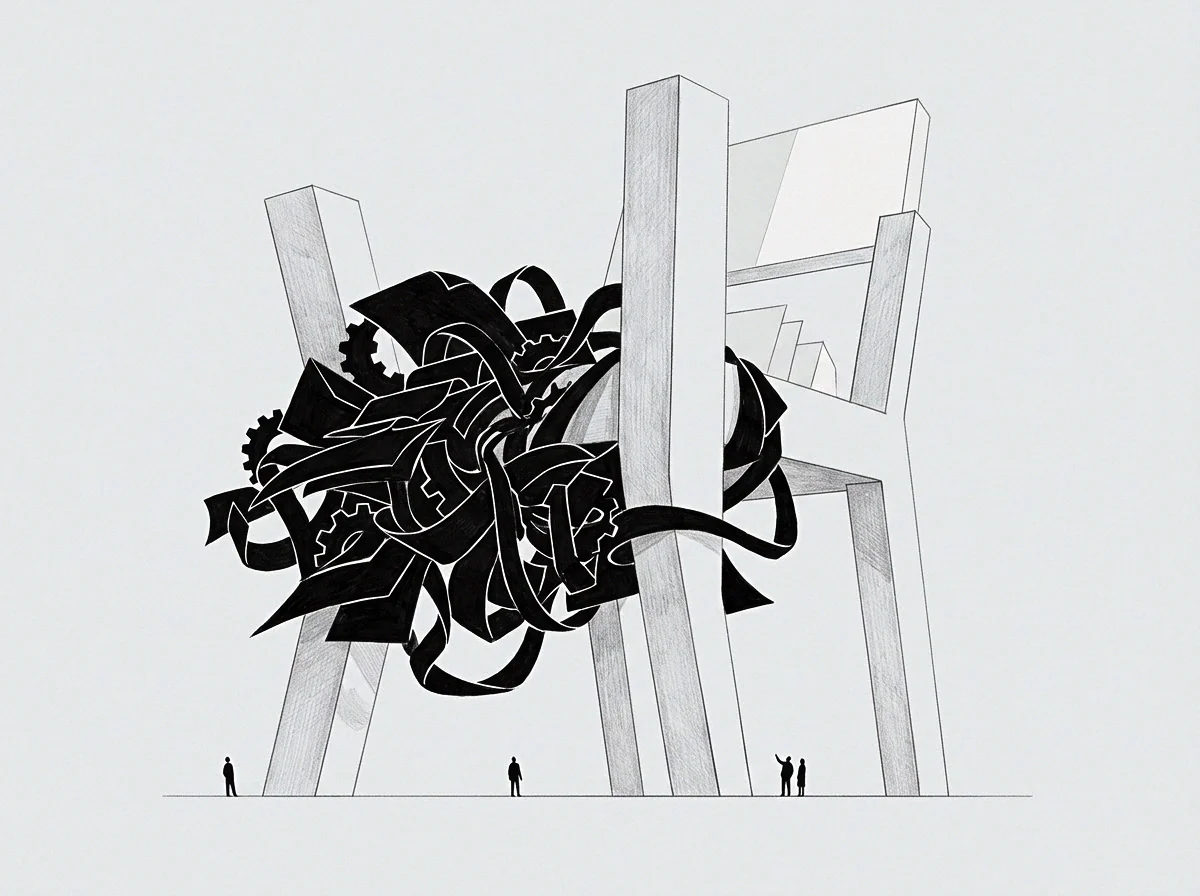
Quantifying Unspent Latent Volume
Operational capacity remains conserved: energy pulled away from core objectives collects in secondary channels instead, generating procedural overhead and internal delay. Calculating this volume requires tallying the resources spent on workarounds, stopgap measures, and status check-ins built to offset unaddressed structural faults.
Refusing to calculate the negative vector converts operational capacity into systemic friction.
A direct mathematical match between avoided effort and potential recovery capacity cannot be demonstrated conclusively in variable organizational structures. Factors like fatigue, market changes, and staff turnover complicate clean energy calculations. Because of this variation, an operator treats the calculated latent volume as an upper limit rather than an assured return, adding safety margins when organizing operational fixes.
Neglecting avoidance vectors leaves the operator blind to unspent capacity, allowing operational energy to leak into peripheral tasks.

Wall
Physical boundaries constrain machines, and structural limits restrict organizational output in the same way. The boundary wall marks the edge of an operating setup, defined by decisions, tasks, and changes the group avoids due to immediate cost. As an operation nears this limit, execution slows down, friction rises, and team energy drains quickly under the load.
Coordinates identify systemic refusal points where boundaries yield only after expenditure exceeds the active processing threshold. Working comfortably within the current frame relies on repeating established habits, whereas crossing the perimeter demands real-time adjustments and structural change. The resulting friction serves as a clear indicator that the system is doing active work rather than running familiar routines.
Computational Expense at the Model Boundary
Every operational setup has an outer limit where execution costs climb steeply. A sales approach built around founder deals hits a wall when applied across an enterprise sales team lacking standard collateral and onboarding. Pushing an existing model past its boundary without structural updates produces waste, as staff burn effort attempting complex work with outdated tools.
- Identify the recurring operational task deferred for longer than ninety days.
- Measure the energy consumed while routing around the deferred task.
- Plot the coordinate where system throughput drops to zero.
- Calculate the computational load needed to cross the boundary.
Discomfort as Active Processing Signal
Research in cognitive skill acquisition indicates that deep processing happens at the limit of current ability, where mistakes multiply and execution requires sustained concentration. During complex tasks, neural networks show higher metabolic activity as they adapt. In workplace operations, friction marks the point where standard procedures fail and new workflows must be built through active effort.
System boundaries expand only when energy expenditures cross the active computation threshold.
Unprocessed tasks accumulate at these coordinates, and when leadership retreats upon encountering discomfort, the operational perimeter shrinks. The working room narrows, confining the business to a smaller operational frame. Widening that frame requires holding pressure against the barrier until structural changes take hold and day-to-day execution eases.
The current operational system cannot process enterprise contracts without doubling engineering overhead and extending delivery timelines by six months.

Route
Plotting an ascent vector requires reversing the angle of the downward gradient while maintaining its overall magnitude. The operator uses coordinates recorded during avoidance tracking to map a direct path toward increased capacity. Ascent demands kinetic work, requiring deliberate, sustained energy applied directly at structural bottlenecks along the boundary wall rather than passive recovery.
Constructing the Ascent Vector
Ascent trajectories require dedicated capacity separate from everyday operational maintenance. If routine tasks consume one hundred percent of available resources, no room remains to move toward higher operational states. The operator creates operational margin by pausing lower-priority tasks or adding capital, building the reserve needed to work through bottlenecks at the boundary.
Targeting the ascent vector at the primary avoidance coordinate produces the clearest operational return. Instead of scattering effort over small tweaks, the operator focuses resources on the central obstruction. Resolving a primary bottleneck reshapes the operational landscape, turning a steep climb into a level path for routine execution.
Translating Errors into Systemic Geometry
System failures offer detailed data on the real limits of an operational setup. If a software deployment misses uptime goals, the breakdown points straight to issues in deployment scripts, testing procedures, or infrastructure capacity. Treating these incidents as geometric coordinates helps engineering leads adjust system parameters, swapping out assumptions for verified operating baselines.
Documenting an operating model through past errors turns operational missteps into durable structural improvements. Every resolved failure pushes the working boundary outward, establishing a wider stable footprint for future work. The organization develops by mapping its constraints, addressing friction at the boundary, and raising its baseline standards across every operational area.
Execution of the structural refactoring plan alters the baseline performance coordinate permanently, provided that weekly resource allocation to maintenance routines remains above twenty percent of total capacity.