
Tracking Buffer Exhaustion When Production Numbers Hide Team Workload Strain
Production numbers conceal workload strain by measuring lagging output while teams silently consume maintenance margins and personal recovery slack.

Dam
The operational reports closed on Friday showing thirty-two pull requests merged, four client releases deployed, and zero missed delivery dates across the sprint. The board summary displayed green markers across all production targets. Inside the engineering room, two senior staff members had worked through dawn on Wednesday to absorb a silent architecture break, the undocumented release script failed twice, and the planned refactoring window vanished to preserve the shipment date.
Delivery volume remained steady while the internal reserve capacity fell to zero.
Work systems absorb volatility through hidden margins before output degrades. When delivery expectations expand without added resources, teams maintain production figures by liquidating their own protective slack. Sleep intervals shorten.
Code reviews turn into cursory stamps. System documentation ceases. The cardinal count of finished tasks stays intact because the labor pool transfers energy from maintenance tasks directly into shipment throughput.
A team preserves nominal velocity during overload by consuming the unmonitored margin of safety that protects future throughput.
Production dashboards record throughput as a scalar value. They measure finished units, cycle completion times, and closed tickets. These indicators monitor output flow rather than system health.
An industrial reservoir releases water at a steady cubic rate even while the water level drops forty feet behind the concrete wall. Observers downstream see constant flow and assume endless water. The production line functions identically, presenting sustained completion figures until the underlying storage reservoir runs dry.
The contract owner reviewed the quarterly throughput numbers and remarked that the delivery cadence had never looked cleaner.
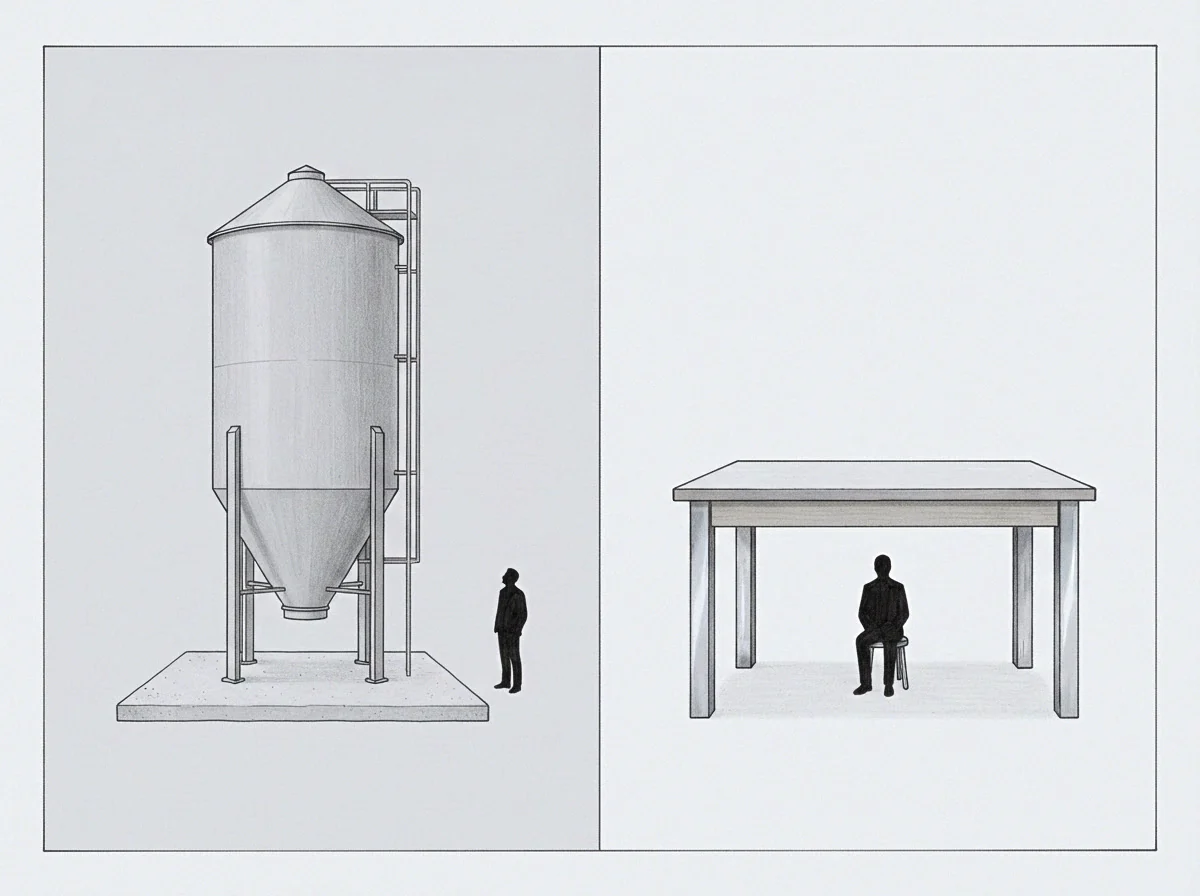
Deficit
Latent operational depletion begins inside the time intervals designed for recovery. Every functioning production cycle relies on slack to handle uneven task arrivals, minor tooling errors, and cognitive recharge. When the input volume exceeds standard operating limits, the workforce preserves the primary release schedule by cannibalizing these secondary allocations.

Unrecorded Labor Conversion
Primary schedule adherence during peak volume relies on undocumented compensatory actions. Staff members extend the working day by two unlogged hours to correct build regressions. Lunch hours convert into testing sessions.
Technical debt refactoring slots convert into feature implementation. This dynamic conceals mounting friction beneath the surface of regular performance charts.
The system routes around formal escalation by burning personnel endurance.
The loss gradient on organizational endurance behaves nonlinearly. In physiological systems described by allostatic load research, physical structures sustain function under stress through chemical adaptation up to a sudden metabolic breaking point. Software and operational teams follow this identical slope.
Early depletion generates zero visible yield degradation. The team absorbs the friction through internal compensation. As structural buffers reach zero, even minor random shocks produce immediate delivery stalls.
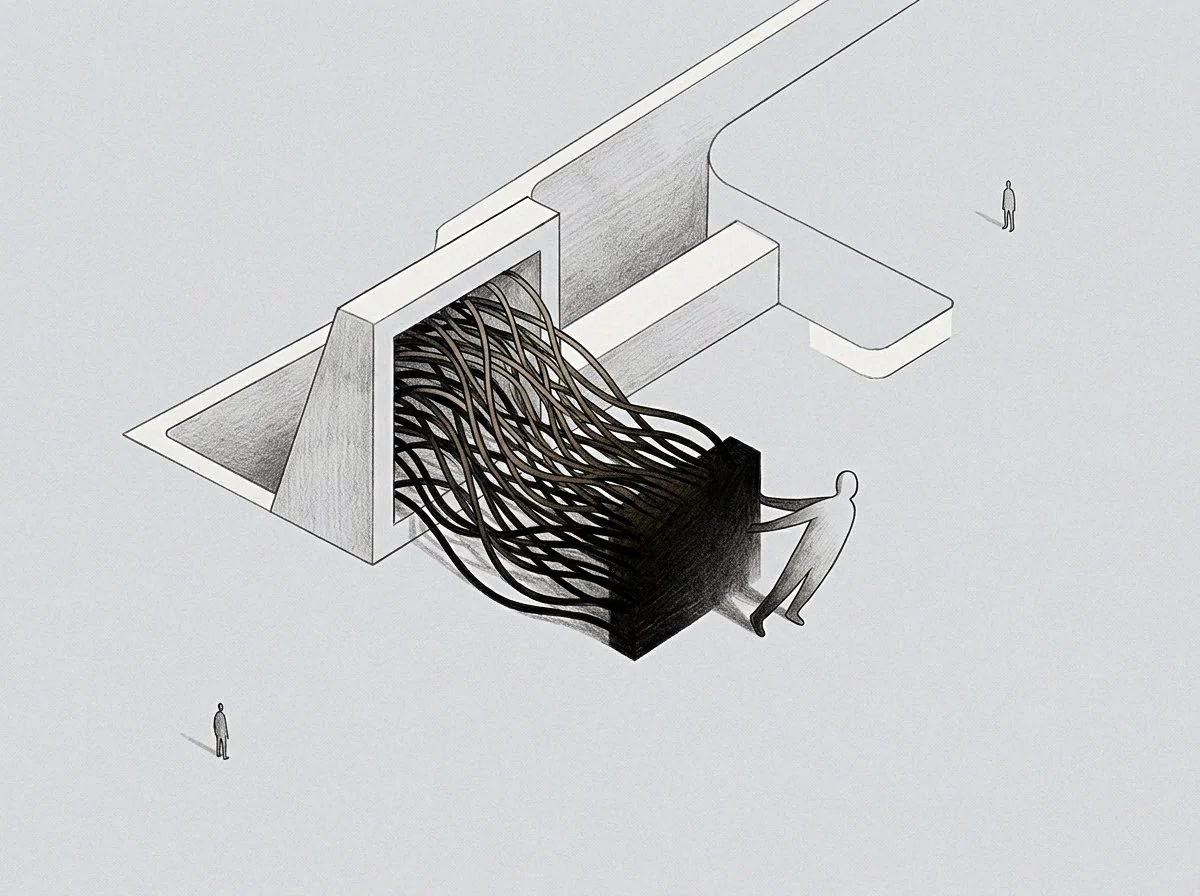
The Shift From Absorption To Fracture
Depleted organizations lose all recovery agility. A minor dependency outage or an unexpected illness that previously consumed an afternoon suddenly halts operations for five days. The surface metrics appear to show an abrupt, mysterious failure caused by a trivial event.
In reality, the collapse traces to months of silent reserve liquidation where the organization operated without protective clearance.
Buffer consumption accelerates whenever recovery windows become delivery time.

Table
Measuring team stability during high-volume commitments involves tracking structural slack rather than delivered volume. Standard executive views favor cardinal figures that show progress toward milestone dates. Detecting exhaustion requires observing the secondary indicators that show how much stress the system absorbed to meet those targets.
| System State | Output Rate | Buffer Condition | Observed Metric Signature |
|---|---|---|---|
| Balanced Cadence | Nominal | Full Slack Intact | Predictable cycle times with thirty percent time allocated to tooling and rest. |
| Active Absorption | Nominal | Partial Depletion | Off-hours message spikes, collapsed code review depth, abandoned backlog triage. |
| Exhausted Margin | Artificially Sustained | Zero Slack Left | Zero non-critical work completed, high rework rates, rising sick leave frequency. |
| Structural Failure | Abrupt Contraction | Negative Balance | Critical project stalls, delayed deployments, sudden resignations of key operators. |
The table isolates the dangerous operational window: the active absorption state. Output remains normal, leading observers to conclude the operating model is sustainable. Measuring the health of the operating unit in this phase requires surveying the margins that surround production.
The true cost of high production volume surfaces in the abandonment of preventative maintenance rather than in missed deadlines.
The operating agreement specifies standard delivery deadlines without defining mandatory recovery windows between intensive releases.

Sink
Consider an enterprise software unit composed of eight senior engineers and two product designers operating under a twelve-week fixed contract. The target requires delivering three complex customer integrations by the end of the third month. The initial resource model allocates thirty-five hours per week per worker to core feature code and five hours to architectural maintenance, automated testing suites, and operational reflection.
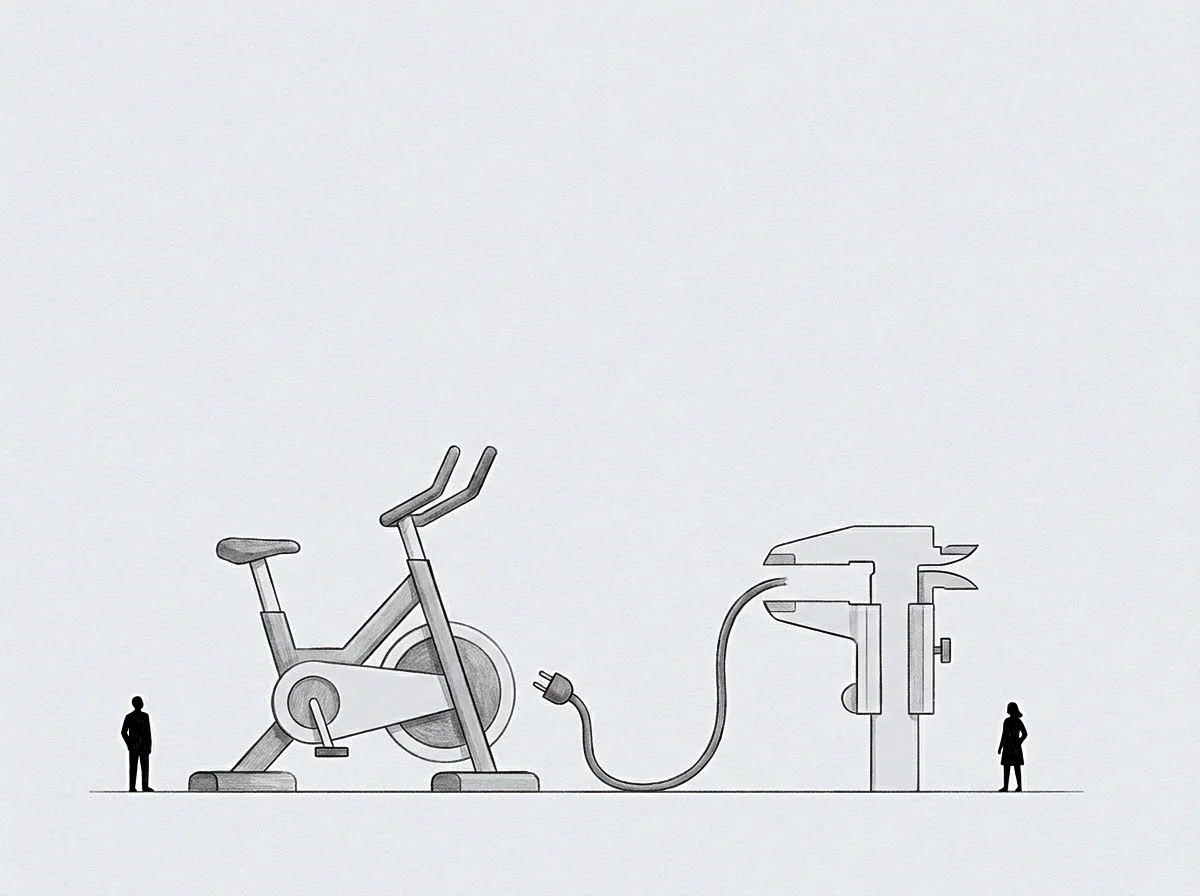
The Progressive Liquidation Sequence
Week four introduces an unpredicted vendor interface change. The product scope remains rigid. The team responds by consuming the five hours of weekly maintenance time to rewrite the integration adapter.
Shipments for week four and week five arrive precisely on schedule. The executive team views the velocity chart and congratulates the group on steady progress. The hidden ledger reveals a different reality: test coverage dropped four percent, automated regression runs began throwing intermittent warnings that nobody addressed, and documentation ceased completely.
By week eight, the vendor adapter develops subtle memory leaks. The team possesses zero allocated maintenance time to diagnose the root fault. The group absorbs the extra burden by working weekends, contributing twenty unlogged hours per person.
The delivery report at week eight shows sixty completed story points, marking the highest volume sprint in the project history. The cardinal output metric looks outstanding.
The team routes around structural repairs by spending personal vitality.
Week ten brings the breaking point. Two lead engineers contract seasonal influenza simultaneously. In an organization with preserved buffers, remaining members redistribute tasks, delay non-essential maintenance, and maintain the primary delivery path with minor adjustments.
In this depleted team, there is no slack left to redistribute. The remaining staff members are already operating at eighty hours per week simply to keep the unmaintained software build functional. The entire release pipeline collapses.
Structural Exhaustion Signals
Tracking the underlying depletion path requires watching specific markers that signal the destruction of organizational margins:
- Unplanned Off-Hours Activity rises as team members migrate difficult tasks to evening hours to avoid interruptions.
- Secondary Task Abandonment happens when engineers stop reviewing peripheral tickets to focus exclusively on urgent sprint deliverables.
- Review Latency Compression occurs when pull request approvals drop from hours of careful analysis to ten-second rubber stamps.
- Context Switching Escalation manifests as staff members juggle four concurrent emergency tasks to maintain surface momentum.
The company incurs catastrophic replacement costs and extended contractual penalties when an unmonitored team burns its structural resilience to maintain an artificial delivery pace.

Valve
Restoring visibility to team workload demands treating capacity as an absolute boundary rather than an elastic variable. Leaders must construct measurement systems that track reserve integrity with the same discipline applied to cash burn. When production numbers conceal operational strain, metrics must capture the price paid inside the machine to generate the outward result.
Instrumenting The Margin
Instrumenting team buffers starts with formalizing the distinction between primary task volume and operational overhead. Teams can log slack consumption by treating maintenance hours as inviolable inventory. When a production spike demands borrowing hours from the maintenance allocation, the tracking tool registers an immediate debt balance that prevents scheduling further commitments until repaid.
Capacity limits protect the long-term asset value of the personnel.
A production metric isolated from margin consumption measures speed while ignoring the disintegration of the engine.
The boundary between healthy exertion and structural breakdown often blurs inside fast-growing ventures. High-performing teams frequently take pride in their ability to absorb chaotic demands through temporary heroics. This psychological disposition makes self-reporting unreliable.
An operator who values competence will routinely report green status long after their internal reserves have reached exhaustion. Automated tracking of code review lengths, off-hours communication volumes, and maintenance ticket completion rates provides the necessary counterweight to stoic self-assessment.
What remains undetermined is the precise volume of structural slack an organization must hold in reserve during economic downturns when every unallocated hour appears to outside observers as pure financial waste.