
Evaluating Operational Overhead and Vector Drag Against Balance Sheet Allocations
Operational overhead generates directional vector drag that depletes human attention and organizational velocity without appearing on cardinal balance sheet ledgers.

Toll

Friction Unrecorded on Ledger Balances
An operations dashboard displays zero variance in general administrative expenses while twelve senior engineers spend thirty hours each week untangling internal permissions tickets. Cash reserves stay intact and invoices arrive monthly, yet internal engineering throughput drops by forty percent because every architectural change demands five manual compliance sign-offs. While the cardinal price of the tool is eighteen thousand dollars, the actual drain on the team is four hundred engineering hours, three stalled product initiatives, and exhausted organizational momentum.
Traditional corporate accounting captures financial transactions at the exact second currency changes ownership. When an enterprise allocates two million dollars of working capital into inventory, treasury bills, or operational software, the balance sheet balances assets against liabilities with precision. What the ledger fails to observe is vector drag, the multi-dimensional deceleration that operational procedures exert upon the productive core of a business.
A balance sheet records capital outlays as static scalar values, whereas operational friction acts as a directional force that depletes personnel capacity and consumes finite executive attention.
A stable expenditure can conceal directional deceleration when internal protocols consume operating capacity without generating market assets.
When an operating system inside a company demands continuous administrative compliance, human capacity moves away from primary production, leaving the operator to absorb the variance. A spreadsheet treats an hour spent by an engineer filling out timesheets identically to an hour spent deploying customer-facing features, because payroll leaves the bank account in identical paychecks. The administrative hour yields zero operational capability while exhausting the mental energy of the person performing it, compounding friction across quarterly cycles.
Direct expenses show zero variance while the operational engine freezes under self-imposed procedural drag. Persisting in evaluating operational health through static capital entries while ignoring directional friction leads directly to commercial paralysis, leaving leadership with balanced balance sheets and an organization that cannot ship code.

Table

Balance Sheet Capital Versus Operational Velocity
Corporate financial statements organize company resources into neat categories of current assets, non-current property, and accrued liabilities. This structure fosters an assumption that every dollar deployed inside an organization produces equivalent organizational yield. A balance sheet allocation toward enterprise resource software is categorized as a prepaid asset amortized across twenty-four months, yet the operational drag created by that software manifests as an unrecorded drain on team hours, extended feedback loops, and lost market agility.
| Balance Sheet Allocation | Cardinal Ledger Treatment | Primary Vector Drag Component | True Operational Toll |
|---|---|---|---|
| Enterprise Compliance Software | Amortized prepaid asset | Executive attention consumption | Thirty hours weekly in manual cross-department reviews |
| Centralized Procurement Office | Fixed operational overhead expense | Procurement cycle latency | Six-week onboarding delays for essential tooling |
| Contractor Contingent Reserves | Accrued short-term liability | Institutional context dissipation | Repetitive onboarding overhead without retained knowledge |
| Internal Quality Gate Committees | Capitalized internal labor | Organizational velocity reduction | Four-week release cycles replacing continuous deployment |
The cardinal price of an administrative layer is recorded as payroll, software subscriptions, or legal retainers. Internal drag remains ordinal, ranking higher or lower based on how many direct productive initiatives it stalls simultaneously. When a founder allocates three hundred thousand dollars to hire three middle managers to coordinate cross-functional alignment, the balance sheet treats the transaction as an incremental addition to operational expenses.
In practice, those three additions introduce fifty new recurring calendar meetings across eight functional teams.
A standard accounting ledger captures the price of capital deployment while remaining blind to the friction that depletes human attention.
The resulting drag consumes four hours daily and cuts delivery velocity in half. Every additional coordination layer increases the communication surface area quadratically, pulling builders away from customers and forcing them into defensive status reporting. The firm allocates cash to purchase stability, yet secures inertia instead.
The board reviews the quarterly income statement and praises the disciplined administrative budget, asking why feature delivery has slowed down.

Load

Attention Depletion Across Administrative Layers
Organizational drag accumulates in human attention reserves before registering on any financial statement. When leadership introduces an additional verification stage into an operational pipeline, the ledger records no immediate expense. The cost in attention registers instantaneously on the cognitive bandwidth of the team.
Administrative gatekeepers require documentation, justifications, status briefs, and follow-up threads, fragmenting the workday and forcing operators into constant context switches that disrupt analytical focus.
Mechanical friction in heavy industrial freight operates the same way. When container vessels idle off harbor berths waiting for pilotage clearance during high-tide windows, fuel burn continues while forward geographic progress stops. The commercial charter fee charges the cargo owner every twenty-four hours, but the compounding loss stems from missing the railway connection at the terminal.
Administrative burden inside a company behaves identically, holding skilled workers in procedural holding patterns while their core mission degrades.
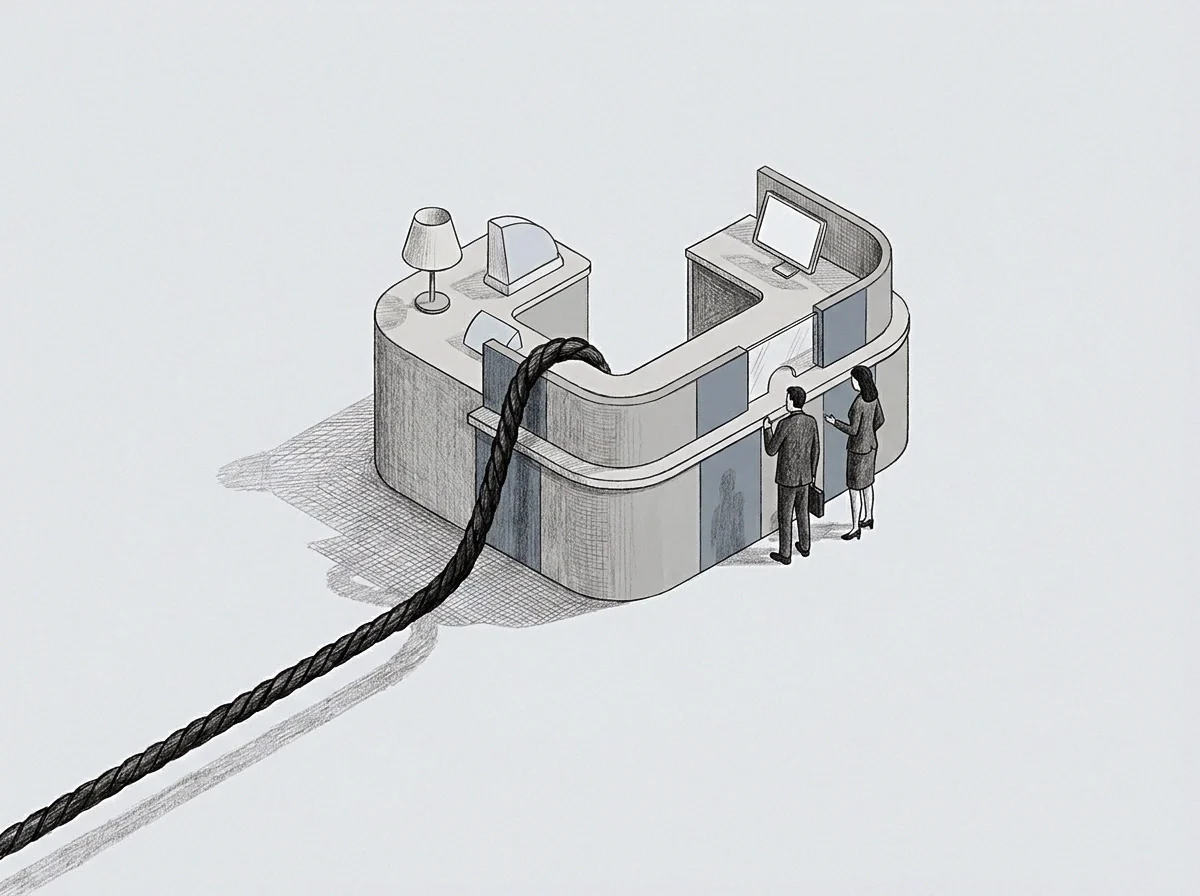
Capacity Sinks and Process Overhead
Administrative processes expand to consume whatever executive bandwidth is available to tolerate them. The burden falls directly on capable operators, who find their calendar space commandeered by administrative upkeep rather than market creation. This drag appears across four primary vectors:
- Context Fragmentation Drag fractures three-hour engineering blocks into fifteen-minute task slivers, destroying deep problem-solving velocity.
- Approval Latency Burden forces active projects into multi-week dormancy while cross-functional stakeholders sign off on trivial specification changes, draining initiative momentum.
- Documentation Redundancy Load demands that operators restate identical progress metrics into five disconnected management dashboards, consuming hours without generating insight.
- Defensive Alignment Meetings occupy mornings with consensus-gathering exercises designed to diffuse operational accountability rather than execute commercial decisions.
Organizational burdens settle on unmonitored calendar hours rather than line items on an income statement.
As attention leaks into process management, a founder observing an engineering team struggle to meet shipment dates often defaults to allocating more balance sheet capital by hiring additional staff. This move compounds the underlying vector drag. Adding more personnel to a high-friction environment multiplies coordination requirements, accelerating the rate at which human attention burns out on administrative maintenance until builder capacity is absorbed by bureaucracy.

Draft

Could Cardinal Accounting Mask Directional Drift?
Financial balance sheets assume that capital expenditures translate into forward momentum. When cash reserves convert into operational activities, standard financial statements record the outflow as an exchange of cash for inventory, intellectual property, or operational capability. Yet vector drag frequently pulls an enterprise sideways or backward.
A company can increase its monthly burn rate while drifting away from its market objectives, because the internal energy generated by the capital outlay works perpendicular to customer value creation.
The distinction between scalar expenditure and directional momentum becomes stark during rapid scaling phases. Two firms can spend five million dollars each over two quarters. The first firm deploys capital with minimal operational overhead, preserving high internal alignment, fast iteration loops, and unhindered customer feedback.
The second firm allocates the identical five million dollars into complex administrative hierarchies, heavyweight compliance protocols, and sprawling committee structures. The balance sheets of both companies display identical capital outflows, yet the first firm builds market defensibility while the second firm constructs internal procedural friction.
- The firm establishes centralized governance protocols to monitor operational risks across all functional teams.
- These governance protocols generate mandatory compliance workflows that increase project lead times from days to months.
- Senior operators spend their working hours navigating internal approvals rather than diagnosing customer pain points.
- Product delivery slows, prompting leadership to institute additional management oversight to diagnose the operational paralysis.
- The additional management oversight introduces further reporting meetings, deepening the systemic drag vector.
Capacity declines without financial trace because the balance sheet reflects only currency. The fundamental inquiry remains unresolved: how can an operating team definitively determine whether a newly instituted governance process protects corporate equity or simply diverts builder velocity into unrecorded structural drag?

Margin

Converting Vector Friction to Cardinal Rates
To evaluate operational overhead against balance sheet allocations, an operator must convert hidden vector drag into cardinal terms that external stakeholders can parse. Stating in a board meeting that internal processes feel heavy invites dismissal as operator fatigue. When an operator translates vector drag into cardinal prices, stating the exact toll in developer hours, delayed shipment dates, and idle capital capacity, the conversation shifts from subjective sentiment to financial reality.
When a contract states no delivery window while the counterparty demands immediate compliance, measuring operational drag requires establishing a baseline translation metric: the cost of operational drag equals the hours consumed by administrative verification multiplied by the fully loaded hourly billing rate of the personnel executing it, added to the opportunity losses of delayed customer deployments. When an internal compliance checklist requires twenty hours of senior partner review, that checklist carries a cardinal price of six thousand dollars in direct payroll, plus the unquantified loss of three client initiatives postponed to clear the queue.
A contract term specifying mandatory multi-stage reviews shifts internal operational velocity from an asset into an active operational liability.
Once vector drag is priced accurately, capital allocation choices on the balance sheet regain clarity. An executive evaluates a sixty-thousand-dollar software license against the five hundred hours of administrative drag it eliminates across the technical organization, rather than treating it as an isolated line item expense. If the tool removes eighty thousand dollars worth of engineering coordination friction, the balance sheet allocation represents positive operational yield.
If an enterprise compliance suite saves five thousand dollars in external audit fees while imposing two hundred thousand dollars of human attention drag, the allocation imposes a net operational deficit.
A stated contractual SLA penalty clause specifying financial remedies for operational delays forces internal administrative gatekeepers to measure the drag they impose against direct balance sheet cash allocations.