
Measuring Ordinal Capacity Vector Failure Modes Under Knightian Capital Shortfalls
Capital shortfalls under Knightian uncertainty force organizations to rank capacity vectors on ordinal scales when cardinal pricing mechanisms break down.

Vector
Capital reserves collapse quickly when liquidity evaporates or revenue lines freeze under unhedged market shifts. In a cash contraction of that severity, accounting statements fail to guide operational choices. Pricing mechanisms rely on liquid markets to translate internal resource use into cardinal numbers.
Without that liquidity, balance sheets obscure operational distress, since cash accounting does not register the depletion taking place across working teams. A founder managing an acute shortfall often watches bank balances while productive capacity erodes underneath.
Operational expenditure runs across several axes at once rather than along a single ledger line. Every initiative draws on engineering hours, leadership attention, platform capacity, and future technical capability. Together, these components form an ordinal capacity vector.
Unlike cardinal figures, an ordinal vector ranks commitments by friction and severity without attaching synthetic cash values. Because attention is an ordinal resource, an operator cannot allocate precisely forty units of focus to cash preservation and twenty units to product architecture; focus shifts entirely toward whichever operational pressure dominates.
When liquidity drops into unmeasurable terrain, survival depends on ordering human energy rather than balancing cash statements.
Under deep financial uncertainty, management often attempts to convert ordinal constraints into cardinal prices, treating attention loss as if it were a direct monetary line item. That conversion fails because ordinal scales allow relative ranking but cannot be summed or priced. When leadership assesses survival exclusively through cash costs, operational capacity breaks down without warning across core units.
Capacity vectors break when the relative ordering of operational demands collapses under stress. In stable conditions, engineering hours, managerial attention, and platform capacity move roughly in step toward delivery. Under a severe cash shock, those vectors decouple.
Engineers spend hours holding legacy infrastructure together while executive attention narrows to cash conservation, creating a structural drag that burns operational capacity without producing output. Teams evaluating decisions purely on cardinal metrics miscalculate the cost of keeping the lights on and surrender momentum long before bank accounts run dry.

Vault
Consider an enterprise software business operating with six months of absolute cash runway during an industry downturn. The firm maintains twenty technical operators, three enterprise distribution accounts, and two strategic infrastructure commitments. Leadership has two paths to navigate the contraction.
The first cuts hosting spend by fifty percent, requiring engineers to spend eighty percent of their weekly hours applying manual patches and running infrastructure maintenance. The second maintains hosting spend but halts feature development completely, redirecting technical staff to high-touch technical client onboarding.
Under the first approach, monthly cash outlays drop immediately, extending nominal runway by forty days. The ordinal vector, however, shifts severely: senior engineering focus leaves core platform work to manage daily triage. Latency rises, system uptime deteriorates, and the technical team carries heavy cognitive friction.
The capability gained is zero, while the operational hours consumed expand to fill the entire week.
Under the second approach, monthly cash burn stays flat, but the ordinal vector protects institutional stability. Technical attention centers on retaining existing revenue, infrastructure holds steady, and the engineering group builds direct integration experience. The cardinal burn rate shows identical short-term financial exposure, but the capacity vector preserves operational coherence.
A stated priority vector without ordinal ranking produces simultaneous resource contention across every active initiative.
When capital shortfalls persist, capacity vectors degrade across specific operational lines:
- Vector Inversion Failure occurs when operational teams spend more attention protecting legacy processes than executing strategic adjustments during liquidity shortfalls.
- Capacity Saturation Drift manifests when continuous crisis management consumes cognitive bandwidth, removing the ability to process new market feedback or client requirements.
- Capability Atrophy Cascade emerges when cost reductions dissolve specialized technical proficiencies that took years of operational work to build.
- Transmission Conversion Failure occurs when management flattens complex operational commitments into financial summaries, concealing operational drag from board members and capital partners.
Because unstated costs compound during shortfalls, evaluating tradeoffs requires pinpointing which operational layer absorbs the shock. Cutting costs purely to improve balance sheet presentation shifts severe friction onto execution capacity and working hours.
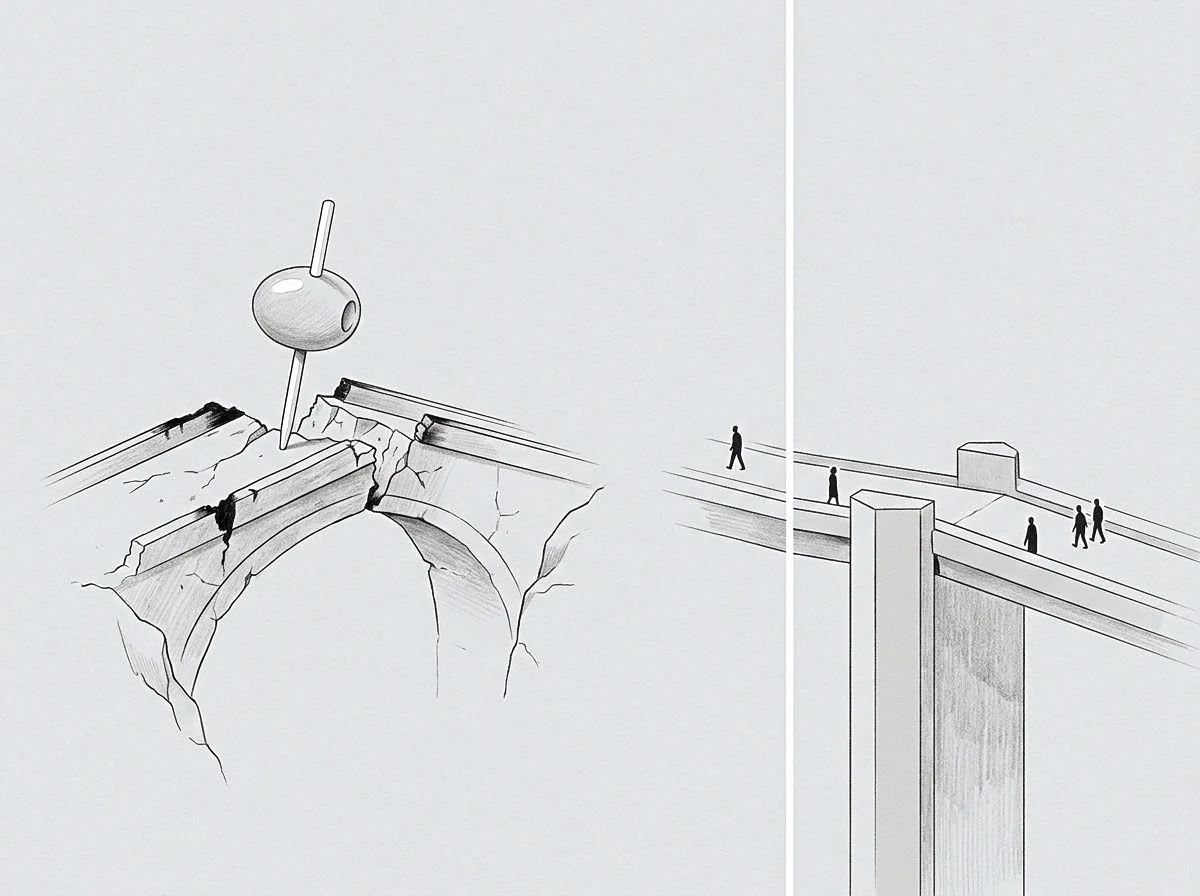
When management prioritizes balance sheet optics over capacity vector alignment during a contraction, failure arrives through operational exhaustion long before formal liquidation.
Gradient
Tracking operational capacity during market volatility requires distinguishing cardinal financial metrics from ordinal vector demands. The matrix below compares standard accounting treatments with ordinal capacity views during severe shortfalls.
| Dimension | Cardinal Pricing Model | Ordinal Capacity Vector Model | Operational Failure Mode |
|---|---|---|---|
| Executive Attention | Calculated as fixed executive salary overhead allocated across departments | Ranked by relative cognitive bandwidth consumed by crisis management tasks | Attention Saturation: Strategic planning halts as crisis response consumes focus |
| Technical Throughput | Measured by feature velocity metrics and direct engineering payroll cost | Ranked by relative expenditure of problem solving energy against platform debt | Technical Stagnation: Engineering hours absorb maintenance without product output |
| Customer Commitment | Valued by contract ARR figure and immediate expansion cash potential | Ranked by operational bandwidth required to maintain relationship baseline | Capacity Exhaustion: Account maintenance consumes technical delivery bandwidth |
| Organizational Capability | Capitalized on balance sheet as intangible asset valuation or goodwill | Ranked by cumulative technical mastery and execution speed under pressure | Capability Erosion: Key skill sets vanish as team bandwidth shifts to survival tasks |
Evaluating Multi Attribute Resource Expenditure
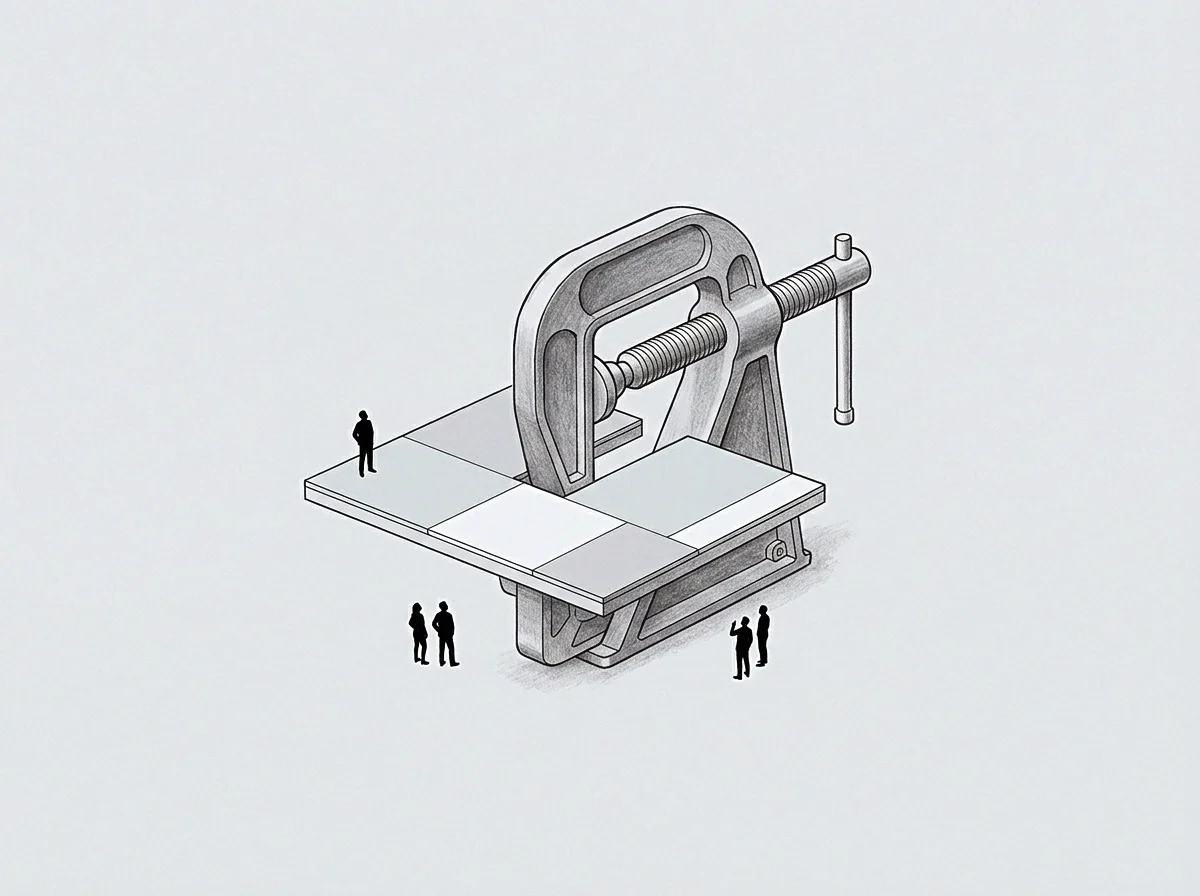
Under Knightian conditions where pricing fails and probability distributions for future capital cannot be calculated, cardinal metrics lose predictive value. Decision-making must shift to direct ordinal ranking of active commitments through four concrete operational steps:
- Identify every active operational commitment currently drawing on technical, distribution, and operational teams.
- Decompose each commitment into core components: managerial attention, engineering hours, and long-term capability impact.
- Rank commitments by the execution capacity consumed relative to their survival value.
- Cut the lowest-ranked commitments immediately to concentrate engineering hours and operational attention on higher-order priorities.
Ordinal capacity vectors dictate survival speed when pricing mechanisms cease to guide resource allocation.
When operational stress strains strategic alignment and teams work without clear ordinal priorities, individual units default to local survival metrics. Product groups skip platform maintenance to ship surface features, while infrastructure engineers slow deployments to prevent outages. These disconnected adjustments only accelerate broader systemic failure.
An engineering department cannot ship new features when its entire working capacity is tied up in infrastructure stabilization.

Mesh
Discussions between technical operators and capital allocators frequently stall during financial contractions because their measurement frames conflict. Capital allocators work with cardinal numbers: burn rates, remaining months of runway, and top-line spending cuts. Operators work with ordinal vectors: code complexity, release friction, and cognitive load.
When investors or boards mandate an across-the-board percentage cut, they assume operational output scales down proportionally with spending. That assumption contradicts the physical reality of running software infrastructure.
Where Do Ordinal Vectors Break First?
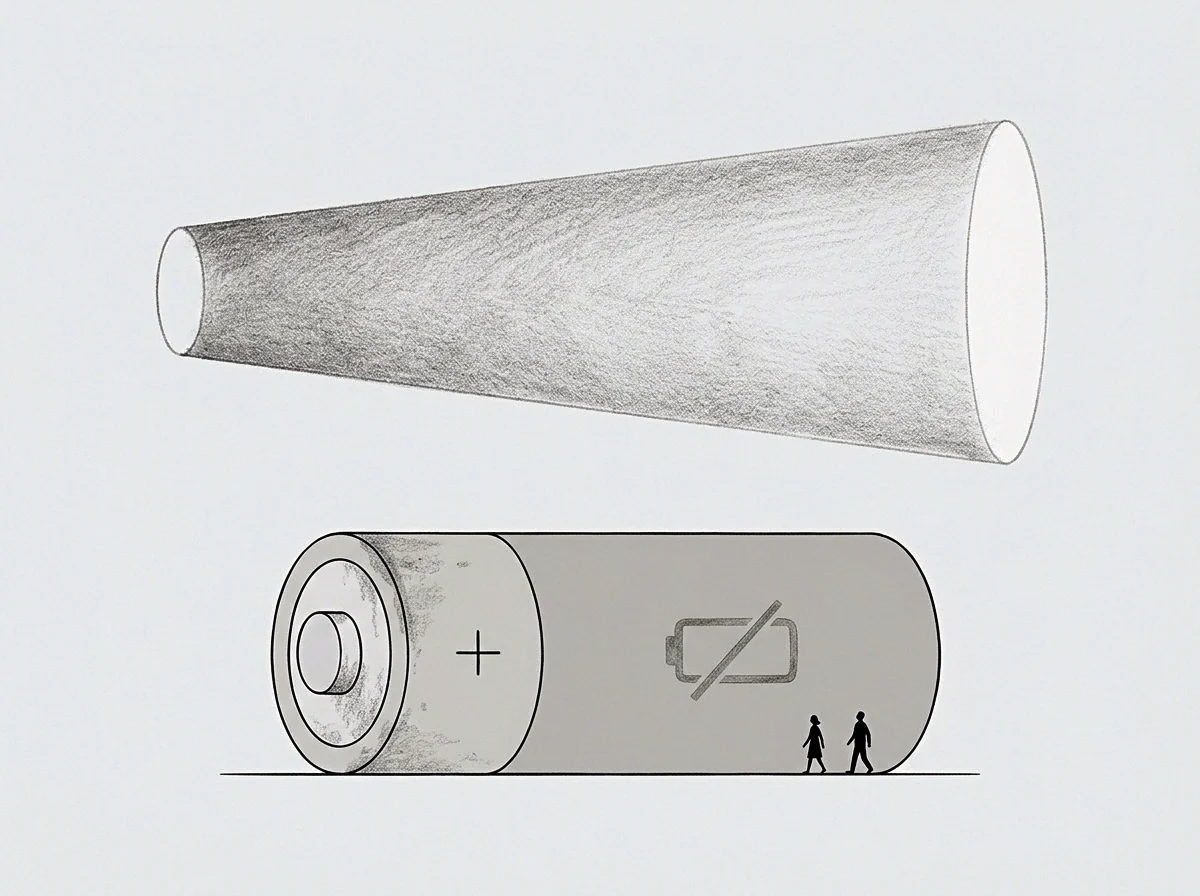
Breakdowns begin wherever leadership forces ordinal constraints into cardinal budget lines. Operational throughput degrades non-linearly once resource levels fall below baseline thresholds. Cutting engineering spend by twenty percent rarely drops feature delivery by twenty percent; it often halts delivery altogether, because the remaining engineers must absorb all baseline maintenance, and recovery speed depends directly on maintaining vector alignment.
A recurring failure during liquidity contractions is vector drift, where day-to-day operational execution diverges from strategic goals. Drift occurs quietly when management accepts budget cuts without shedding commitments. Teams attempt to deliver the same strategic scope with depleted capacity, generating silent code defects, exhausted engineering attention, and mounting platform debt.
Because capability loss precedes financial insolvency, leadership must formalize explicit operational priorities before shortfalls occur. A structured capacity agreement states in advance that product feature work automatically scales back whenever support bandwidth drops below defined levels. Setting that rule beforehand resolves operational ambiguity, eliminates unstated expectations, and keeps capacity vectors aligned with actual capital reserves.

Margin
Boundary conditions define the limits of organizational resilience. If a capital shortfall persists, capacity breakdown spreads from specific execution units into general paralysis. The terminal stage arrives when leadership can no longer reallocate attention across competing priorities.
At that point, immediate crisis response consumes executive attention completely, leaving zero capacity for repositioning or raising capital.
As engineering throughput degrades under financial uncertainty and capital markets freeze, organizations endure by protecting their core capability vector rather than optimizing short-term accounting metrics. That preservation requires dropping non-essential projects early, stating operational costs transparently to capital partners, and maintaining strict ordinal clarity on active priorities.
Engineers rank attention expenditures by immediate operational stress while capital allocators evaluate total runway in months.
Because vector breakdown eliminates strategic options, organizations managing capacity well treat human attention, operational bandwidth, and technical capability as hard physical constraints. By evaluating tradeoffs as multi-dimensional vectors rather than flat cash figures, operators preserve their execution capability through severe market disruptions.
How do operational leaders measure relative capacity vectors when market volatility prevents accurate forecasts of future capital availability?