
Quantifying Operational Friction In High Debt Engineering Teams
Operational friction measures technical debt as an ordinal vector of context switching hours, execution delays, and cognitive attention loss.

Clock
Software debt listed in issue trackers records historical architectural omissions. Operational friction measures the live resistance encountered during routine deployment cycles. Engineering organizations routinely confuse these two quantities.
A backlog item sitting in a tracking tool carries zero operational expense until a developer touches the surrounding codebase. Once work begins, structural flaws convert static debt into continuous friction. This friction acts as a multi-attribute vector.
The vector includes lost engineering hours, elevated context-switching frequency, reduced system deployment capacity, and exhausted executive attention.
Decomposing operational drag requires moving beyond static code analysis. Counting open debt tickets provides an incomplete metric of system health. Static counts treat every debt item as an equivalent unit, ignoring how system components interact under production load.
A single tightly coupled service module can introduce recurring friction across fifty distinct feature deployments. The friction manifests through extended pull request build times, manual regression validation steps, and repeated staging environment resets. Cost precedes price.
Internal friction accumulates long before financial statements reflect degraded delivery velocity.
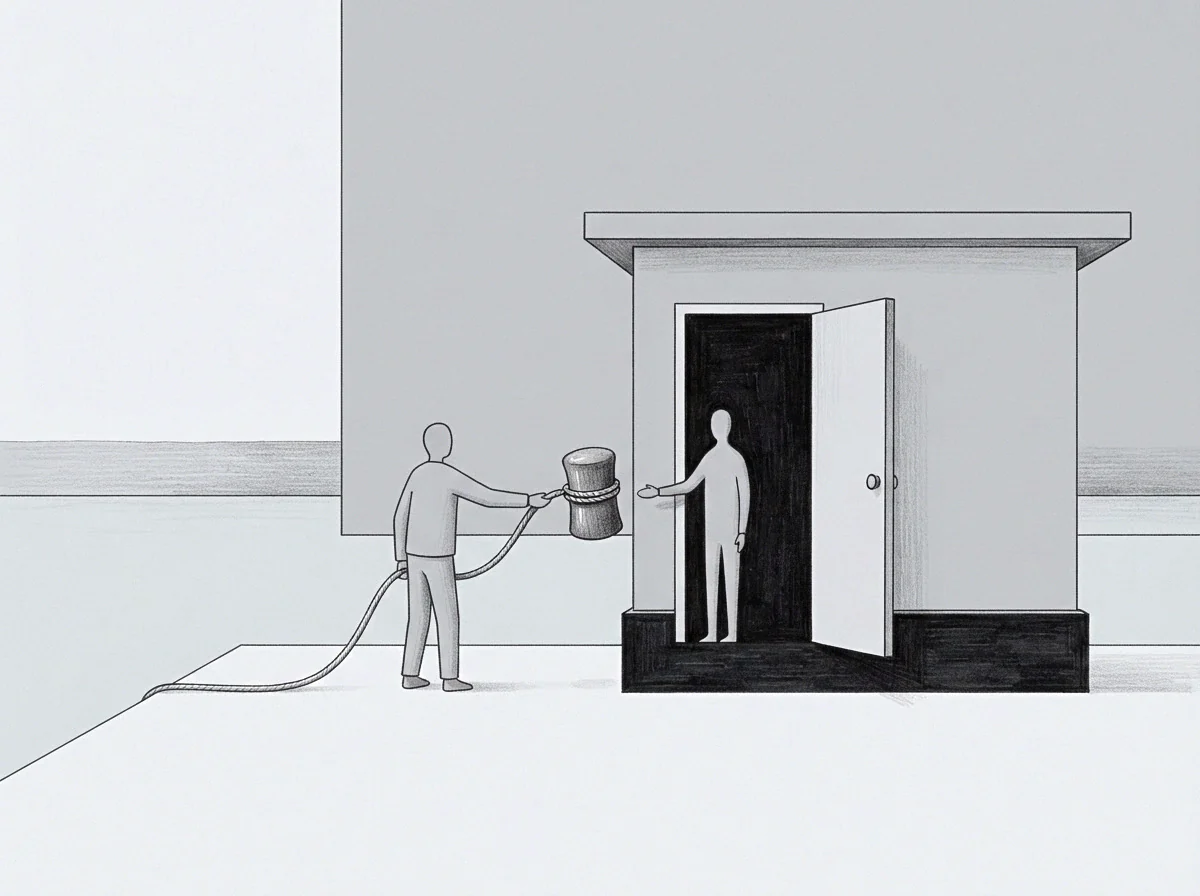
Decomposing Engineering Drag into Ordinal Vectors
Measuring operational friction requires an ordinal scale before attempting cardinal financial conversion. Engineering capacity cannot be evaluated purely through monetary expenditures. Hours spent deciphering undocumented legacy interfaces carry different operational weights than hours spent writing automated test suites.
Capacity drops first. When architectural complexity grows, developers reallocate their daily energy from system expansion to system defense.
An ordinal ranking of friction vectors establishes where engineering throughput degrades most severely. The primary vector component is context switching latency. Interruptions caused by failing build pipelines or fragile staging environments destroy deep concentration blocks.
The second component is diagnostic overhead, representing the time required to trace defects through unindexed log streams. The third component is manual recovery effort, which measures human intervention needed to complete broken automated releases. Ranking these components by magnitude reveals which architectural bottlenecks limit team velocity.
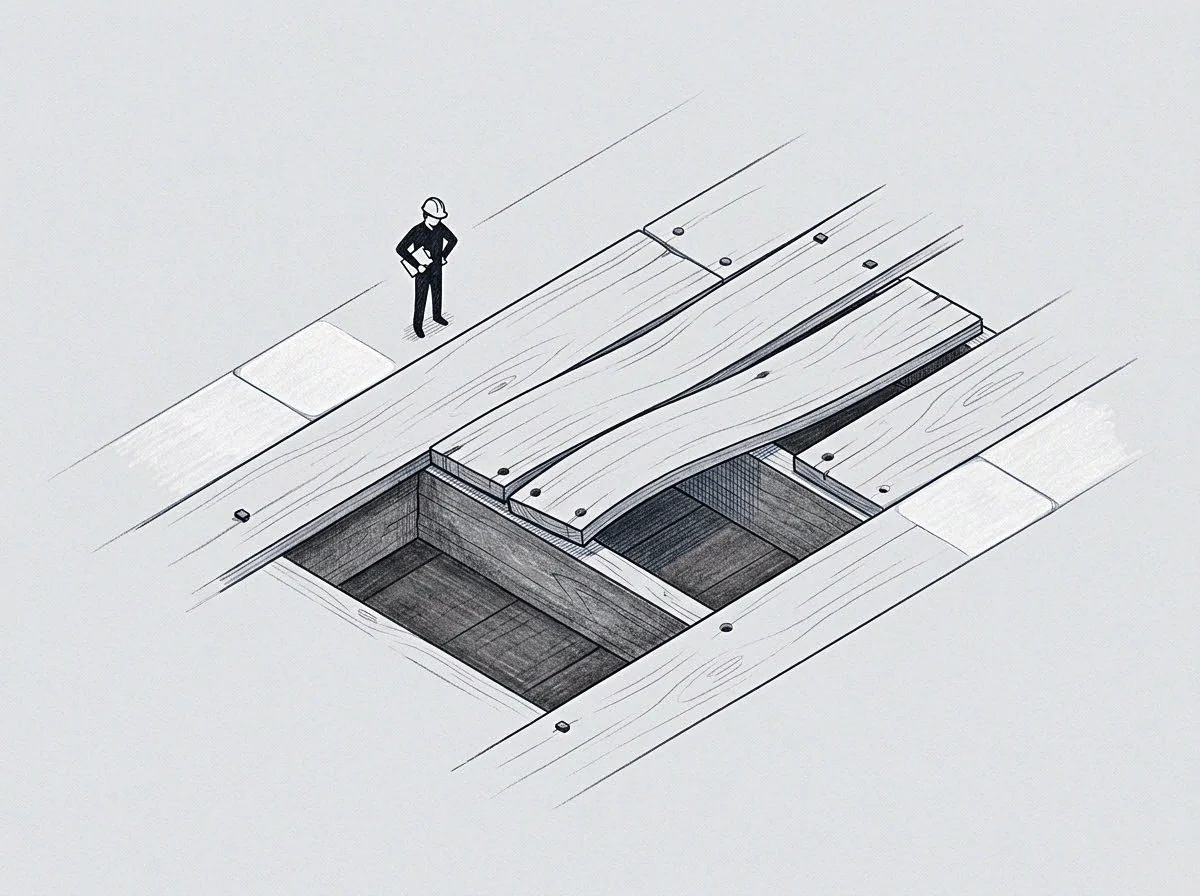
Why Static Backlogs Miscalculate Operational Resistance
Issue backlogs record what engineers plan to fix rather than what actively impedes current execution. Prioritizing remediation work based on ticket age or arbitrarily assigned priority numbers leads to misallocated engineering effort. High-friction areas of a codebase are frequently avoided by developers, resulting in zero new ticket creation despite severe operational drag.
Engineers construct informal workarounds, routing changes around brittle services rather than touching the core logic. Attention leaves the task. The system degrades quietly while official dashboards display stable task completion metrics.
Quantifying operational friction requires tracking live operational signals instead of passive backlogs. Metrics such as change failure rate, mean time to restore service, deployment pipeline duration, and developer wait time expose real structural resistance. When build validation takes forty minutes instead of five, every engineer on the team absorbs a recurring operational tax.
The tax compounds across daily operations, reducing total available execution windows.
When leadership evaluates engineering drag through ticket counts rather than operational vectors, technical investments target visible code artifacts while deployment latency continues to compound across every release.

Weight
Quantifying operational drag requires tracking how engineers allocate hours across production incidents, pull request reviews, and schema migrations. High debt environments create an invisible tax on daily focus. Developer capacity shifts from feature construction toward defect containment and manual infrastructure stabilization.
Context switching consumes hours. As system interdependencies multiply, simple modification tasks demand extensive coordination across multiple engineering squads.
The total operational load borne by a team consists of distinct friction channels that consume structural capacity:
- Context Switching Tax destroys cognitive focus when engineers pivot between fragmented maintenance tickets and core feature delivery within a single workday.
- Pipeline Latency Overhead forces engineers to monitor stalled integration builds instead of executing planned architecture tasks.
- Manual Recovery Expense consumes operational capacity whenever failure recovery relies on undocumented script execution rather than automated rollback systems.
- Defect Containment Price drains engineering hours through repetitive manual verification protocols before every production deployment.

Quantifying the Context Switching Tax
Cognitive focus fragments rapidly under continuous operational interruptions. When an engineer encounters a broken integration pipeline, attention diverts from product logic toward environment troubleshooting. Research in cognitive task management demonstrates that restoring deep concentration after an interruption requires significant recovery time.
In a high-friction codebase, engineers experience multiple disruptions per shift, effectively halving their productive focus windows.
Systemic friction expands when manual deployment verification replaces automated integration testing.
The time lost to context switching is an ordinal magnitude that cannot be recovered through overtime. Interruptions create mental fatigue, increasing the probability of logic errors in newly written code. Higher defect rates trigger additional production incidents, generating a self-reinforcing friction cycle.
Feedback loops widen. The organizational setpoint for acceptable delivery speed gradually degrades as teams normalize frequent operational delays.

Converting Time Loss into Cardinal Financial Figures
Internal operational friction remains hidden from corporate finance until ordinal time losses convert into cardinal price metrics. Translating developer hours into monetary terms requires establishing clear baseline cost rates. If a squad of eight engineers loses fifteen total hours per day to build pipeline instability and manual environment setup, the cumulative drag represents hundreds of wasted hours per month.
Direct compensation for those unallocated hours constitutes a direct financial drain.
Financial conversion exposes the true cost of deferred technical maintenance. While leadership may hesitate to allocate budget toward refactoring a legacy service, comparing the refactoring cost against the annual price of developer wait time changes the decision landscape. Deployment frequency slows.
The monetary expenditure required to fix the underlying architecture is often a fraction of the recurring capital burned by daily operational resistance.
An engineering team spending more capacity on keeping systems operational than on shipping code has transitioned from software development to manual site stabilization.

Grid
Subsystems within a software architecture generate distinct friction profiles depending on their placement in the data dependency path. Core domain services create broad operational blast radiuses when unstable, affecting multiple downstream teams. Auxiliary utilities or isolated background jobs produce localized friction that rarely impacts core business throughput.
Mapping friction across subsystem boundaries isolates where architectural investments yield maximum velocity recovery.

Comparing Operational Friction Across Engineering Subsystems
Different technical domains exhibit varied friction characteristics under high technical debt. The table below outlines how operational drag manifests across four common engineering subsystems, detailing the primary friction sources, the associated ordinal cost vectors, and the resulting cardinal financial conversions.
| Subsystem Category | Primary Friction Source | Ordinal Cost Vector | Cardinal Price Conversion |
|---|---|---|---|
| Architectural Core | Tightly coupled domain modules | High attention drain, high context switching | Extended sprint delivery timelines |
| Deployment Pipeline | Flaky integration tests and manual gates | High hours vector, idle compute capacity | Increased developer hourly rate per release |
| Data Infrastructure | Unindexed schema queries and manual fixes | Capacity consumption, high incident overhead | Elevated cloud infrastructure bill |
| Testing Rig | Stale test environments and environment drift | Attention loss, cognitive load tax | Delayed market introduction schedule |

Where Does the Hidden Context Switching Tax Accumulate?
Operational resistance accumulates disproportionately in shared deployment pipelines and staging environments. When multiple engineering squads rely on a single fragile integration environment, delivery queues back up rapidly. Engineers spend idle hours waiting for build lock releases or manually negotiating deployment windows with adjacent teams.
The local minimum holds. Squads accept extended release cycles as an unalterable operational constraint.
Unindexed schema queries convert hidden architectural friction into direct cloud infrastructure bills.
The accumulation of deployment drag creates severe scheduling unpredictability. Feature estimates expand to accommodate potential integration failures, masking true engineering throughput. Recovery windows shrink.
Management perceives slow feature execution as a talent limitation rather than recognizing the structural friction choking the deployment pipeline.
Establishing an explicit baseline window for build execution time transforms background engineering frustration into a clear operational metric for resource reallocation.

Gradient
Engineering teams operating under high technical debt spontaneously adjust their daily routines to route around failing system components. System behavior mirrors gradient descent in optimization algorithms, where activity flows along the path of least operational resistance. When modifying a legacy service requires weeks of manual testing and approval gates, engineers build shadow workarounds.
They create local data caches, write wrapper services, or duplicate database tables to avoid touching high-friction code modules.
Path-of-least-resistance routing creates short-term execution relief while compounding long-term system drag. The informal workarounds introduce architectural complexity and redundant data pipelines. Shadow maintenance accelerates.
Over time, the engineering organization manages multiple parallel software layers constructed solely to bypass unmaintained core systems.
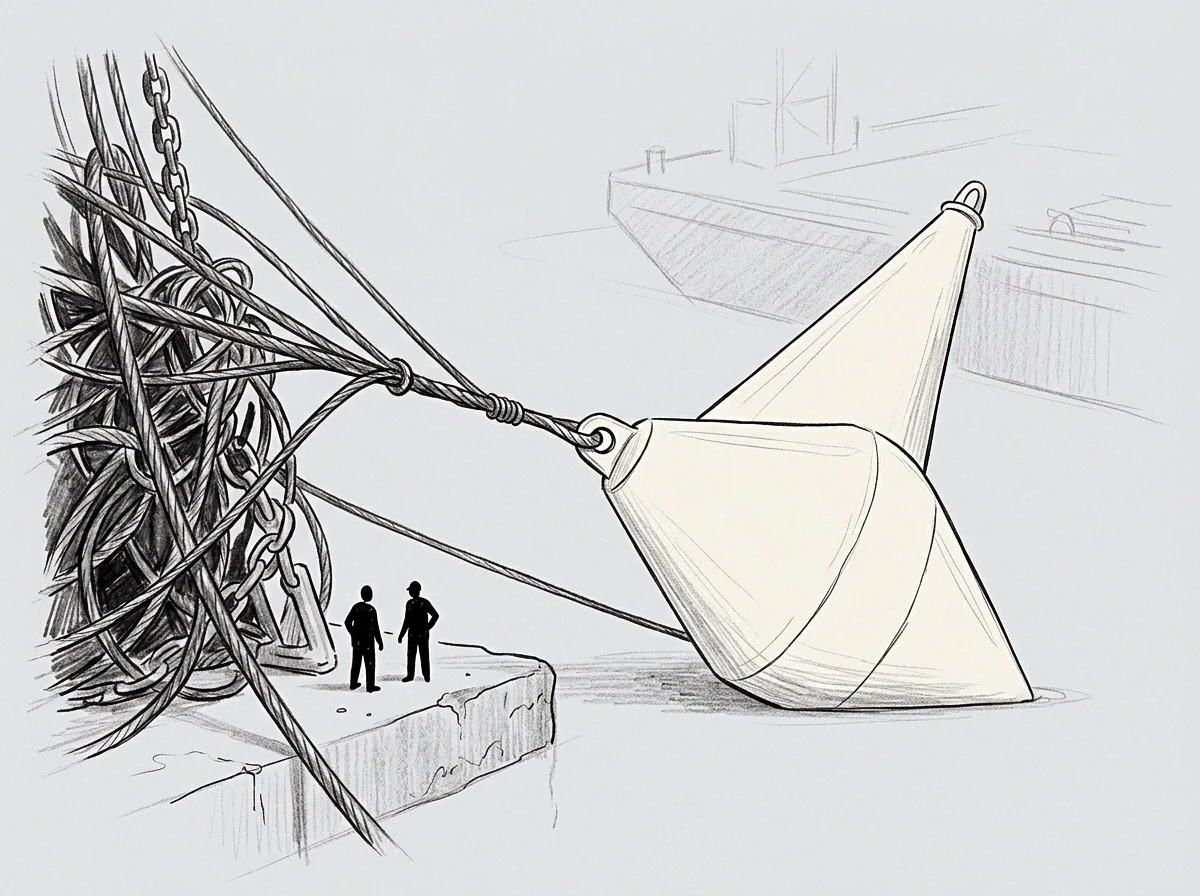
Systemic Routing Around Architecture Flaws
Organizational behavior adapts predictably to structural system friction. When formal processes impose heavy administrative or technical overhead, informal practices emerge across engineering squads. The progression follows an identifiable sequence of operational shifts:
- Workaround Adoption occurs when engineers build custom local scripts to bypass broken staging environments.
- Metric Masking takes place when teams shorten integration test suites to artificially improve deployment velocity figures.
- Communication Expansion increases meeting frequency to coordinate risky deployments across tightly coupled service boundaries.
Each phase in this sequence trades long-term structural clarity for immediate task completion. Manual intervention grows. Engineering leadership observes steady output metrics while remaining blind to the rapid accumulation of underlying operational drag.

Setpoints and Error Signals in High Drag Environments
Control systems theory provides a precise lens for analyzing operational friction dynamics. An engineering organization operates with internal setpoints for deployment frequency, build reliability, and code quality. When technical debt introduces continuous drag, system performance deviates from desired setpoints.
In healthy organizations, this deviation triggers an error signal, prompting immediate corrective investment.
Workarounds become permanent infrastructure when operational friction remains unquantified at the planning table.
In high-debt environments, persistent error signals cause organizational setpoint drift. When build failures occur daily, management stops treating failed builds as actionable anomalies. Error signals drop out.
The team re-calibrated its baseline expectations, accepting ten-hour deployment cycles and weekly production outages as normal operational conditions. Reversing setpoint drift requires establishing explicit operational boundaries that trigger mandatory engineering interventions.
Engineering promises rapid delivery schedules, yet every architectural change requires three weeks of manual regression validation.

Margin
Remediating operational drag requires converting internal ordinal vectors into clear cardinal figures before allocating quarterly engineering budgets. Operational friction must be presented as a quantifiable capacity drain rather than an abstract quality concern. When engineering leaders demonstrate that system drag consumes thirty percent of total productive payroll, architectural remediation secures executive sponsorship alongside feature development.

Stating Operational Vectors Early in Planning Cycles
Consider an engineering organization of twenty developers operating across two core service pipelines over a twelve-month period. Assume each developer earns an hourly baseline equivalent of one hundred dollars and faces two hours of context switching tax every day due to unstable test environments. Over one year, this context switching tax consumes ten thousand engineering hours.
The ordinal cost vector shows eight thousand hours diverted from core delivery, two thousand hours spent on manual recovery, and severe attention fragmentation across both teams.
Management faces two distinct investment options for the upcoming fiscal cycle:
Option A allocates full team capacity toward new product features while leaving existing deployment pipelines untouched. The team continues to pay the ten-thousand-hour context switching tax. Feature delivery timelines slip by forty percent, defect rates remain high, and total developer turnover increases due to persistent operational frustration.
Execution slows down.
Option B dedicates twenty percent of total engineering capacity for two quarters toward automated pipeline stabilization and core refactoring. The initial investment consumes two thousand hours of feature development time. By quarter three, daily context switching tax drops from two hours per developer to fifteen minutes.
The team reclaims seven thousand five hundred productive hours annually. The queue length doubles for initial feature backlogs, but long-term throughput accelerates permanently.

Establishing Bounded Capacity Windows for Technical Recovery
Sustained operational velocity recovery requires establishing bounded capacity windows dedicated exclusively to friction reduction. Treating debt remediation as a background task squeezed between feature deadlines guarantees failure. Product delivery pressures invariably displace background maintenance work, allowing friction vectors to resume upward growth.
The setpoint drifts lower.
A team spending ten thousand hours on context switching pays for technical debt through delayed execution rather than planned remediation.
Bounded capacity windows allocate explicit, unalterable capacity blocks toward architectural health. Whether structured as dedicated remediation cycles or fixed percentages of every development iteration, bounded windows protect engineering attention. Protecting focus allows teams to systematically eliminate high-friction bottlenecks, lowering context-switching taxes and restoring baseline system throughput.
When engineering leadership presents friction as a quantitative capacity vector rather than a vague complaint about legacy code, budget allocations shift from arbitrary feature promises to calculated architectural investments.