
Engineering Autonomous Regional Telemetry Windows to Prevent Parent Metric Contamination
Autonomous regional telemetry windows evaluate local signal variance within dynamic temporal boundaries, preventing transient edge anomalies from corrupting aggregate metrics.

Mesh
Distributed system telemetry streams transport operational metrics from regional compute nodes to central evaluation stores. High-frequency packet collection, local routing jitter, and regional compute bursts generate temporary variance. When local metric pipelines forward raw regional measurements directly into aggregated parent calculations, transient local anomalies alter aggregate statistical baselines.
The aggregate baseline stays clean when telemetry boundaries process local signals independently. Central observability engines rely on consistent baseline figures to evaluate system health, trigger automated recovery procedures, and balance capacity across computing regions.
Direct coupling between regional sampling pipelines and primary aggregate metrics introduces metric contamination. Localized network congestion in one availability partition causes queue build-ups, artificially inflating global latency metrics. A single regional compute cluster experiencing temporary garbage collection pauses can skew global percentile calculations, even when eighty percent of the compute fleet operates within normal latency bounds.
The baseline holds. System operators watching top-level dashboards perceive global performance degradation where only local variance exists. This false signal causes automated autoscaling controllers to over-provision global infrastructure, driving operational expense upward without improving actual user experience.
Preventing parent metric contamination requires local isolation layers. These isolation layers act as operational meshes, dampening short-term regional variance while preserving long-term metric fidelity. The regional telemetry topology processes high-frequency samples locally, converting raw signal series into bounded statistical summaries before upstream transmission.
Noise propagates quickly without bounds. By holding transient fluctuations within regional telemetry windows, the aggregate metric stream accurately reflects system-wide trends rather than local environmental spikes.
A regional telemetry stream running without dynamic local bounds converts temporary network jitter into permanent skew within aggregate evaluation baselines.
Telemetry propagation failures often stem from continuous unbuffered pass-through architectures. In these configurations, central processing engines treat every regional metric emission as an immutable truth regarding overall fleet health. When regional infrastructure suffers a localized storage delay, metric values spike by orders of magnitude.
The parent metric calculation ingests this value immediately, pulling moving averages away from true operational medians. Once polluted, parent historical baselines require extended recovery intervals before returning to accurate levels, during which operational visibility remains compromised.
System architects attempting to resolve contamination through simple static filtering frequently introduce blind spots. Dropping regional metrics above an arbitrary maximum value obscures real structural degradation across regional hardware partitions. Unfiltered propagation leads directly to false positive alerts across primary operational dashboards, while aggressive metric truncation hides regional outage indicators.
Unbounded local signal propagation creates continuous operational distortion across parent metric baselines.

Window
Autonomous regional telemetry windows isolate regional variance by computing signal metrics inside bounded temporal frames. Rather than streaming raw metrics continuously to primary collectors, the local telemetry agent maintains a rolling temporal window. This local window computes continuous regional statistics, including median values, interquartile ranges, and exponential moving averages.
The regional node evaluates local state. Measurements calculated within this local window remain quarantined until the window condition confirms whether variance represents a local transient spike or a persistent operational shift.
Dynamic dynamic attenuation logic governs signal passing between local windows and parent aggregators. During periods of normal operational variance, local telemetry windows emit compressed statistical summaries at fixed sync intervals. When local metric values breach regional statistical thresholds, the autonomous window switches to local evaluation mode.
Local compute nodes absorb short spikes. In this mode, local compute resources damp the signal amplitude, preventing short-term regional volatility from leaking into parent metric streams. Signal retention varies with window size.

Autonomous Bounds and Dynamic Attenuation
Local window configuration balances telemetry resolution against aggregate stability. Short time windows capture rapid regional changes but forward high levels of regional noise. Long time windows eliminate transient spikes but delay detection of actual regional outages.
Telemetry window engineering uses adaptive decay factors that dynamically adjust window size based on regional variance rates. When regional noise increases without structural error state changes, the local window extends its smoothing duration, absorbing the noise locally.
The operational logic of an autonomous regional telemetry window uses precise failure classification. Structural regional errors, such as database disk saturation or complete node isolation, generate signal patterns distinct from network jitter. Autonomous telemetry windows monitor local error rates, compute density, and memory pressure alongside metric amplitude.
When metric anomalies coincide with local component failure flags, the window opens immediately, transmitting critical failure telemetry to central management services without dynamic attenuation.

When Does Local Telemetry Overwrite Global Baselines?
Determining the exact boundary at which local telemetry alters parent baselines depends on signal persistence across consecutive sample windows. A single window displaying a latency increase of three hundred percent represents a candidate transient anomaly. Three consecutive windows exhibiting the same latency elevation indicate a sustained regional transition.
Measurement windows require local boundaries. The local engine holds regional metrics in local storage while calculating the delta between current regional performance and historical regional baselines. Once persistence criteria are met, the telemetry engine updates the parent metric store using a weighted smoothing factor, ensuring orderly baseline transitions.
Telemetry pipeline architecture relies on clear operational distinctions to govern metric flow across regional boundaries:
- Unbounded Exponential Smoothing allows localized traffic spikes to distort global percentile calculations for hours after regional recovery.
- Static Sample Windows truncate slow-developing hardware degradation signals by resetting measurement intervals before trends stabilize.
- Symmetric Outlier Clipping eliminates valid regional hardware fault signals alongside transient network dropouts, disguising systemic component failures.
Enforcing local telemetry evaluation prior to parent aggregation isolates regional anomalies while preserving baseline fidelity across primary compute clusters.
Telemetry window parameters set local boundary conditions. The telemetry engine determines signal validity by calculating variance against historic regional reference classes. When a regional node processes traffic within expected parameters, telemetry windows remain constrained, preserving central metric clarity.
Dynamic attenuation factors adapt continuously based on input volatility, maintaining precise mathematical separation between regional noise and central system performance metrics.
Regional metric containment relies on local mathematical evaluation rather than continuous centralized polling. Operating telemetry windows at the edge guarantees that aggregate system monitors retain structural stability regardless of regional network turbulence. Long-term baseline preservation requires isolated local calculation prior to central aggregation.
Valve
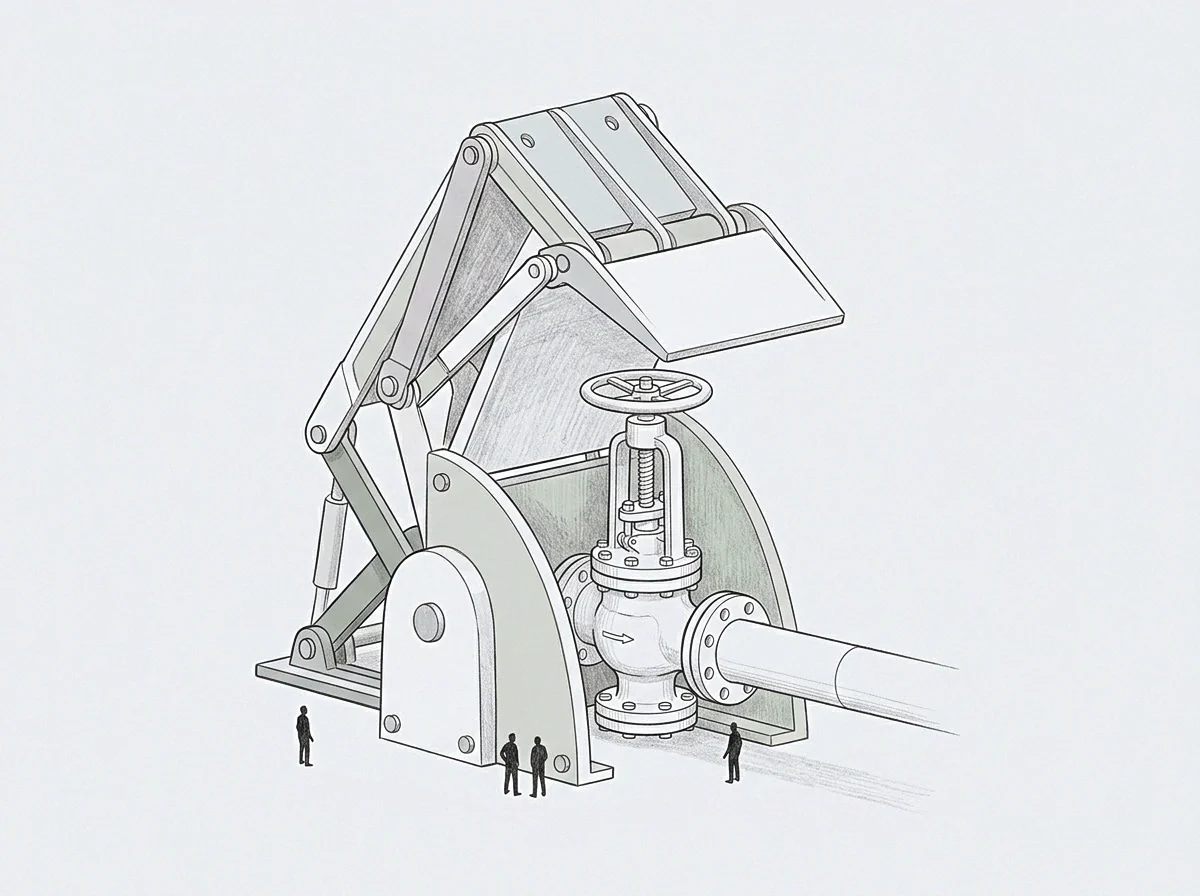
Gating telemetry streams requires specialized control structures that act as operational valves between local compute nodes and parent aggregation databases. A telemetry valve controls the velocity and volume of metric updates based on local validation criteria. When local metrics fluctuate within defined operational tolerances, the valve permits steady, compressed telemetry updates.
When regional volatility exceeds local tolerances without indicating hardware failure, the valve constrains update frequencies, protecting parent metric computation from high-frequency contamination.
State persistence within the telemetry valve prevents rapid toggling between open and restricted states. Rapid oscillation between metric streaming modes causes fragmented baseline trends in central monitoring systems. The valve mechanism uses hysteresis logic, requiring local regional metrics to remain within stable parameters for a continuous period before returning to normal passthrough operation.
The telemetry valve closes. This design prevents intermittent regional network flapping from causing recurring telemetry corruption at the global layer.

Gating Mechanisms and Local Telemetry State
Telemetry valves evaluate metric inputs using deterministic state machines running on regional edge collectors. The state machine evaluates three metric vectors: local sample variance, rate of metric change, and local hardware status flags. When all three vectors remain within expected operational ranges, the telemetry valve assigns high confidence to the signal.
High-confidence metrics flow directly to parent aggregation pools. Low-confidence metrics trigger local signal buffering, holding values in local volatile memory until local noise resolves.
Parent metric calculations require stable baselines. Direct streaming of unvalidated regional metrics leads directly to false operational conclusions. The table below outlines the operational characteristics of four common telemetry isolation strategies used across distributed cloud architecture.
| Isolation Strategy | Propagation Delay | Baseline Drift Protection | Local Signal Loss | Computational Load |
|---|---|---|---|---|
| Raw Passthrough | Zero | None | Zero | Minimal |
| Fixed Threshold Gating | Low | Moderate | High | Low |
| Dynamic Quantile Windowing | Moderate | High | Low | Moderate |
| Autonomous State Valve | Variable | High | Zero | High |
Local Validation Loops and Invariance Checks
Local validation loops check regional metrics against invariant system properties before releasing data upstream. An invariant property represents an established physical or operational limit, such as maximum network interface throughput or total memory capacity. Telemetry signals reporting resource utilization figures above theoretical physical limits represent corruption, hardware reporting errors, or driver glitches.
The dynamic evaluation loop catches these anomalies locally, preventing impossible metric values from polluting central database stores.
Data arrives continuously. Invariance testing ensures that edge node processing calculates metrics using live computation rather than retrieving stale cached states. A regional telemetry node operating correctly recalculates metrics based on incoming raw samples.
If a regional node repeatedly emits identical telemetry outputs under varying workload conditions, the invariance tester marks the regional engine as degraded, isolating its stream from parent metric pools.
Telemetry streams that update parent state without verifying regional invariance force high-level controllers to react to local noise.
Validation logic operates at the regional boundary, enforcing metric integrity before network transmission occurs. When regional inputs breach validation rules, the local node logs the exception locally and dampens upstream propagation. The system retains accurate local diagnostic logs while safeguarding parent evaluation metrics from localized calculation errors.
A regional telemetry pipeline operating under strict threshold gating drops all metrics exceeding defined bounds regardless of persistence.

Matrix
Evaluating telemetry requires establishing appropriate reference classes for regional performance. A reference class groups historical metric distributions captured under similar operational conditions, such as peak load hours, batch processing runs, or scheduled backup intervals. Comparing live regional telemetry against a global baseline creates false positive alerts, as individual regions exhibit distinct latency and utilization profiles due to geographic user distribution and local hardware variations.
Localized reference classes ensure that regional telemetry windows evaluate variance against true local baselines.
Dynamic matrix calculations track metric deviation across multiple operational axes simultaneously. Instead of evaluating CPU utilization or latency in isolation, the regional metric engine evaluates the joint probability distribution of CPU, memory, network I/O, and disk queue depth. A regional latency spike accompanied by normal CPU and network usage indicates an operational anomaly.
Conversely, a latency spike occurring alongside proportional increases in active user requests matches normal operational scaling behavior. The calculation completes locally.

Reference Class Alignment in Edge Metric Engine
Aligning regional telemetry with local reference classes requires continuous baseline calibration. The edge metric engine computes rolling statistical profiles of regional performance across seven-day operational cycles. This multi-day window captures cyclical diurnal patterns, preventing expected daily traffic spikes from triggering local telemetry dampening mechanisms.
The delta remains measurable. When live regional performance matches historical reference patterns, the telemetry node outputs high-fidelity metrics directly to parent aggregation pools.
Calibration errors occur when operators apply uniform performance baselines across heterogeneous compute fleets. Newer hardware components process transactions faster than older legacy nodes, producing different baseline operational profiles. Autonomous telemetry windows resolve this disparity by maintaining component-specific reference classes, ensuring that metric evaluation accounts for hardware variation without manual operator intervention.

Worked Evaluation of Dual Region Metrics
Assume a cloud system spanning two computing regions, Region A and Region B, operating under a unified central monitoring configuration. Region A contains older server hardware handling high transient batch traffic, while Region B runs newer hardware processing steady web requests. Without regional telemetry isolation, transient queue spikes in Region A continuously alter central p99 latency metrics, making Region B appear degraded on central management consoles.
Installing autonomous regional telemetry windows alters this behavioral pattern entirely. Region A’s telemetry collector initializes a local temporal window of sixty seconds, evaluating incoming latency metrics against Region A’s multi-day reference class. When a transient batch job causes a thirty-second latency spike in Region A, the local window detects the anomaly, verifies that hardware status flags remain healthy, and restricts upstream metric transmission.
The local engine calculates the regional median latency over the window and forwards only the attenuated baseline figure to the central store.
Meanwhile, Region B continues transmitting steady performance metrics. The parent metric calculation ingests Region B’s true operational metrics along with Region A’s attenuated baseline summary. The resulting central p99 metric reflects true system availability rather than Region A’s transient internal batch processing noise.
The regional node isolates the noise locally, preserving aggregate metric clarity across central management interfaces.
Parent metric calculations retain validity only when regional telemetry nodes resolve transient anomalies within local evaluation windows.
System operators reviewing central observability consoles expect aggregated metrics to reflect overall application service availability rather than localized hardware performance noise.
The regional network isolated the performance spike locally, preventing aggregate metric corruption without losing diagnostic data.

Clock
Temporal alignment governs how regional telemetry windows synchronize metrics with parent monitoring systems. Regional telemetry nodes operate on local hardware clocks that experience drift relative to primary system clocks. Transmitting time-stamped metrics from desynchronized regional nodes leads to out-of-order data ingestion at central aggregation points.
Out-of-order metric ingestion corrupts temporal time-series calculations, causing moving averages to recalculate historic intervals incorrectly.
Decay timers prevent stale regional metrics from persisting indefinitely within local buffering windows. When a regional telemetry node experiences a network isolation event, it continues recording metrics to local volatile memory. The dynamic decay timer limits how long metrics remain valid without upstream synchronization.
Once the decay timer expires, the local engine purges transient samples, holding only persistent baseline statistics to avoid flooding parent databases with historical data upon network reconnection.

Temporal Synchronization and Decay Timers
Telemetry clock synchronization uses monotonic regional clocks paired with central epoch offsets. Rather than relying on synchronized real-time clocks across distributed geographic sites, regional collectors measure relative time elapsed since window initialization. Upstream ingress gateways calculate absolute UTC timestamps upon receiving metric payloads by applying the known network transit delay to relative regional elapsed time.
Static thresholds fail under burst load. This architecture eliminates temporal distortion caused by clock skew across regional infrastructure partitions.
Decay algorithms apply time-weighted attenuation to historical regional metrics stored in local node memory. Recent metric samples carry higher statistical weight than older samples, allowing telemetry windows to adapt rapidly when operational conditions change permanently. The rate of temporal decay scales dynamically based on signal volatility, ensuring fast stabilization following severe operational disruptions.

Continuous Delta Verification Across Regional Nodes
Continuous delta verification measures the difference between expected baseline trends and live metric outputs across all regional compute partitions. The regional telemetry agent calculates local deltas continuously, verifying that variance stays within acceptable operational bounds. When local deltas exceed baseline variance floors, the agent executes local validation steps to confirm whether telemetry pipeline integrity remains intact.
Validating regional telemetry windows involves executing systematic operational verification steps:
- Record the aggregate baseline across all primary operational zones during stable load conditions.
- Inject synthetic transient latency bursts into a single edge telemetry partition.
- Measure parent metric divergence across three consecutive synchronization intervals.
- Adjust local dynamic attenuation thresholds until aggregate drift remains below the variance floor.
Local variance settles over time. System stability relies on maintaining structural separation between edge operational noise and primary performance metrics. Autonomous regional telemetry windows provide the mathematical and temporal boundaries necessary to protect aggregated system baselines while preserving complete regional operational visibility.
How do telemetry pipeline engineers verify that adaptive regional decay rates maintain aggregate baseline accuracy during extended cross-region network partitions?