
Estimating Energy Losses From Angular Velocity Differences Between Strategy And Operations
Energy losses between strategy and operations scale with the velocity difference between strategic directional turns and operational cycle completion times.

Shaft
Organizational motion relies on transferring directional momentum from strategic leadership into operational output. Strategy sets the rotational direction, pivoting toward new market conditions, competitive moves, or capital constraints. Operations supplies the rotational mass, maintaining the continuous execution loops that yield revenue, deliver products, and support existing commitments.
When strategy redirects at high speed while operations runs on a slower, fixed cycle, the interface between them absorbs severe mechanical stress.
Every strategic turn demands a corresponding change in the path of execution. Because the operational apparatus holds significant momentum in its current direction, it resists immediate realignment. When leadership alters direction faster than underlying delivery loops can complete their rotation, energy shifts away from productive output and directly into internal structural strain.
Energy transfer efficiency drops when the frequency of strategic directional changes exceeds the natural completion rate of the execution cycle.
This dynamic creates a structural disconnect between executive intent and practical delivery. Observing a slow operational response, strategic planners often adjust direction more frequently to force compliance. Operations experiences these rapid adjustments as turbulence, spending administrative effort replanning uncompleted tasks instead of finishing open work streams.
The organization consumes capital and labor continuously accelerating and decelerating its execution teams without increasing net forward trajectory.

Mechanical Coupling Across Operational Cycles
The mechanical efficiency of an enterprise depends on matching strategic decision cadences to the actual throughput time of execution units. High angular velocity differences occur when strategy recalculates its target weekly while software engineering or manufacturing cycles operate on six-week horizons. The resulting differential creates friction along every reporting line and task allocation channel.
Quantifying this friction begins by observing the percentage of operational work discarded before completion following each strategic pivot. In high-differential environments, teams start projects that become irrelevant midway through build phases. Energy expended on abandoned initiatives represents dissipated capital that yields zero long-term assets or external feedback.
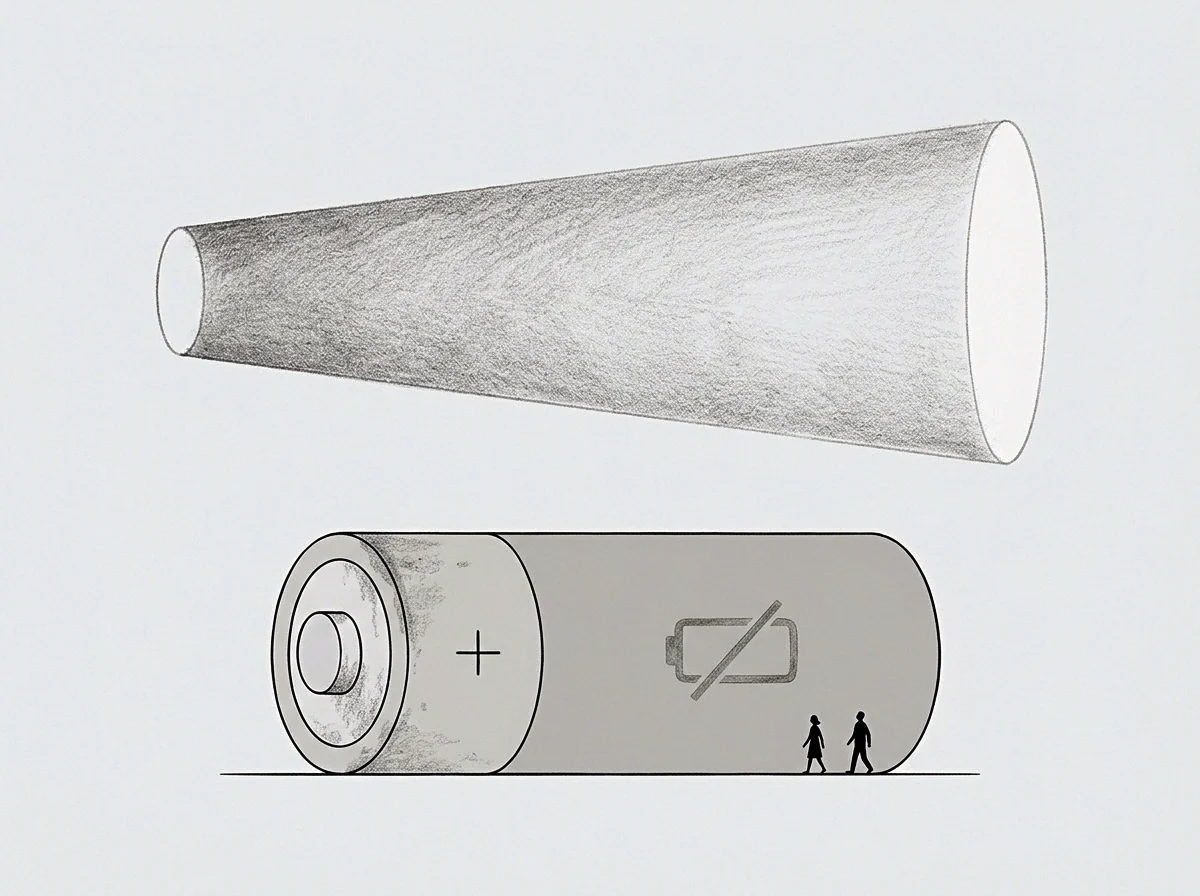
The quarterly target changed twice before the delivery pipeline completed its first deployment cycle.
Shear
Kinetic loss within an enterprise scales non-linearly with the divergence between strategic rotational speed and operational execution velocity. When strategic vectors pivot continuously, the implementation layers experience severe multidirectional forces. Executive leadership perceives these maneuvers as nimble market adaptations, while operational managers absorb them as turbulence that dismantles working processes.
Energy losses manifest across three main physical modes within the working environment. Each mode consumes operational capacity without contributing to the external product or service vector.
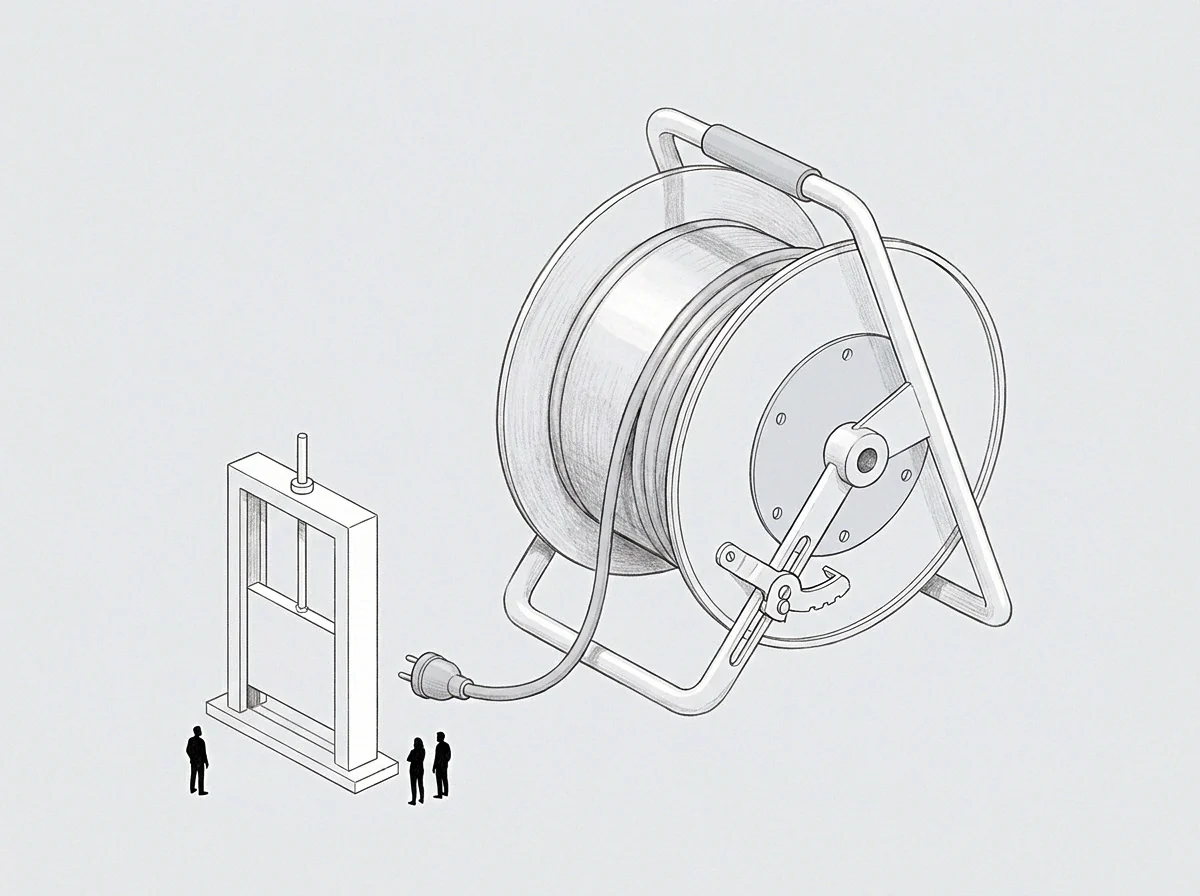
Unplanned structural refactoring forced by directional shifts dissipates capacity into non-productive internal realignment.
Operational teams forced to reorient before completing an iteration build latent resistance to future directives. This resistance shows up as compliance without commitment, where teams execute instructions formally while withholding the creative effort needed to solve unexpected delivery roadblocks.
Vectors of Kinetic Dissipation
Operational drag arises from specific structural failure points when rotational velocities separate entirely.
- Angular misalignment occurs when strategic re-prioritization outpaces the physical completion rate of open work items.
- Internal drag absorbs capital through repeated structural refactoring that produces no exterior output.
- Phase lag delays market signal validation because the system recalculates baseline targets mid-cycle.
When operational units spend more than thirty percent of their available work hours re-estimating and rescoping tasks due to altered priorities, the system reaches operational lockup. The energy spent keeping the system organized consumes the energy allocated for building external value.
Repeated directional shifts without dampening mechanisms exhaust operational attention long before the external market provides a valid error signal.
Gauge
Measuring lost capacity between strategy and operations requires calculating the difference between total energy expended and useful momentum generated. Traditional accounting tracks financial expenditures against budget lines, but fails to capture energy dissipated through velocity differentials. Tracking that loss demands evaluating the trajectory of work units over time.
Total work lost equals the area bounded by the strategic vector path and the operational execution path over a defined delivery window. When the strategic vector turns ninety degrees, operational momentum along the initial vector continues until counteracted by administrative intervention. The energy required to arrest that initial momentum and start movement along the new vector represents pure dissipation.
Aligning recalculation intervals to operational throughput prevents velocity decay across delivery teams.
The shear gradient measures the magnitude of this structural friction per unit of organizational scale. A wide gradient indicates an enterprise spending substantial capital simply maintaining internal order against conflicting directional forces.
When does velocity lag convert into total momentum collapse?
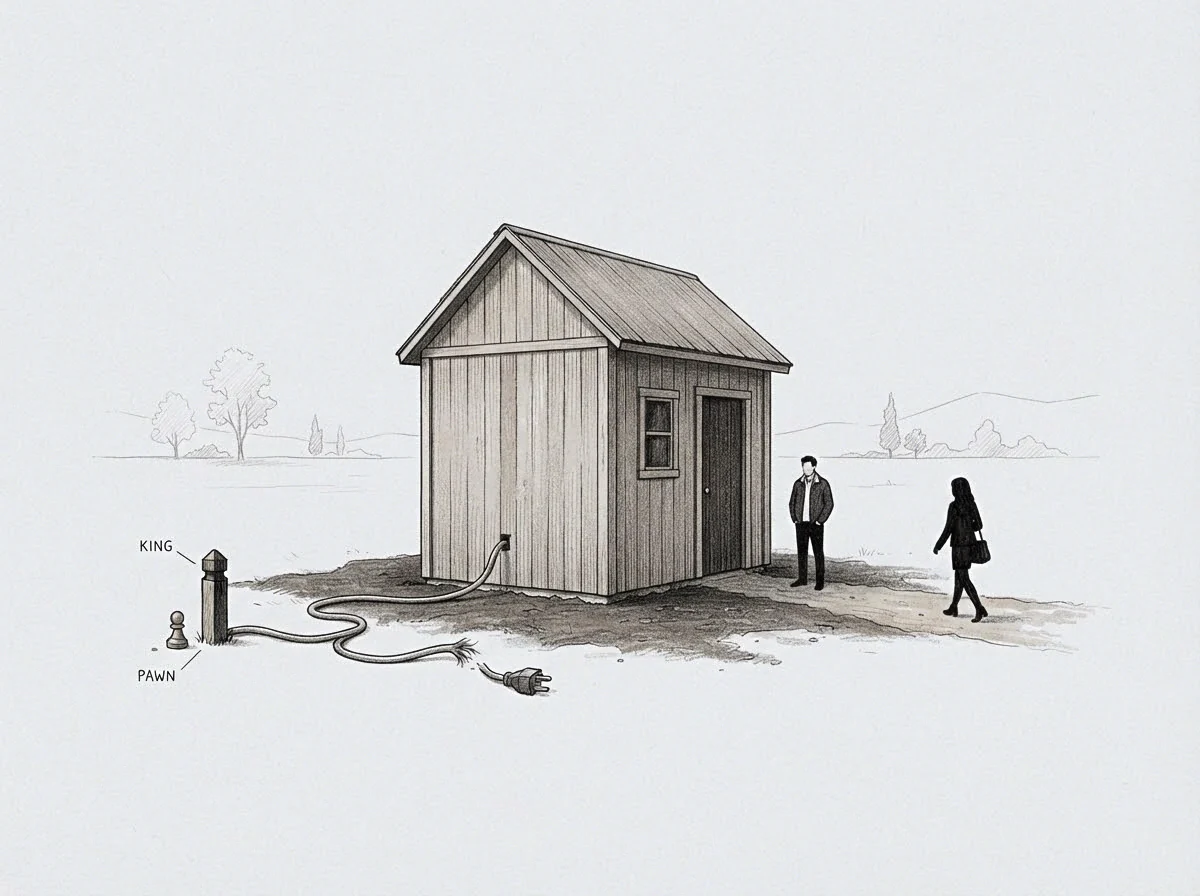
Breakdown occurs when operational realignment takes longer than the time available between strategic pivots. At that point, operational teams abandon attempts to finish work items, settling into a permanent holding posture characterized by surface compliance and minimal physical throughput.
Estimating total energy losses requires three structured steps to expose hidden operational friction.
- Track the ratio between planned strategic vector adjustments and completed operational deliverables per quarter.
- Measure the hours spent refactoring existing operational pipelines to accommodate unvalidated strategic directives.
- Calculate the unspent volume of stalled features abandoned before reaching production deployment.
High dissipation rates produce noticeable cultural artifacts, including widespread cynicism regarding executive announcements and systematic under-reporting of project completion timelines.
Setting the recalculation window equal to the minimum operational build duration eliminates phantom momentum markers from the capacity calculation.
Slip
Consider a tech organization operating over a twelve-month period where two senior leadership teams alter priorities four times a year, introducing new strategic vectors every ninety days. If the core engineering infrastructure requires a minimum of one hundred and twenty days to refactor codebases and deploy stable infrastructure, the angular velocity of strategy sits at four rotations per year while maximum operational throughput sits at three.
This differential creates a constant state of operational slip. Execution teams operate behind strategic intent, delivering features designed for previous market strategies while ignoring current executive priorities. The table below compares organizational performance across three explicit rotational velocity bands.
| Velocity Band | Strategic Rotation Frequency | Operational Delivery Cycle | Angular Velocity Delta | Dissipative Capacity Loss |
|---|---|---|---|---|
| Band A (High Differential) | Monthly recalculation | Quarterly iteration | High shear differential | Forty-five percent of total capacity |
| Band B (Matched Cadence) | Quarterly recalculation | Quarterly iteration | Zero phase lag | Under eight percent of total capacity |
| Band C (Stagnant Strategy) | Annual recalculation | Monthly iteration | Negative differential | Twelve percent due to unguided drift |
Operational Cadence and Strategic Rotation Bands
Analysis of Band A reveals that nearly half of all available operational hours burn off through non-productive realignment. Work started in month one receives instruction to change direction in month two, leaving incomplete code branches, unedited copy, and half-configured infrastructure scattered across administrative environments.
Band B demonstrates optimal structural coupling. Locking strategic recalculation cycles directly to the operational iteration boundary eliminates mid-cycle redirection costs. Operational mass completes its rotational arc naturally before executive leadership introduces new directional vectors.
Whether an organization can deliberately slow strategic recalculation without ceding market responsiveness remains an active point of operational debate.
Torque
Correcting energy losses from angular velocity differences requires adjusting the structural coupling between leadership directives and execution units. Executive leadership cannot simply order operations to move faster; physical processes, deployment protocols, and human cognitive bandwidth set hard limits on operational speed. Modern governance focuses on dampening strategic recalculation frequency to match operational reality.
Establishing strict recalculation limits protects the operational layer from excessive directional chatter. Strategic turns occur at predictable, scheduled intervals, creating protected execution windows during which operational units build without external interference. That boundary sets the limit of what the system can absorb before execution degrades.
Stabilizing strategic directional changes transforms internal friction into useful external market force.
When strategic vectors remain fixed throughout an execution cycle, applied force translates directly into measurable progress along the selected axis. Operational teams generate clean velocity, reaching output milestones that yield real data on market fit. Feedback signals stem from complete deployments rather than incomplete prototypes.

Stabilizing the Execution Coupling
Dampening operational slip requires governance structures that force strategic decisions to honor execution timeframes. Executive teams introduce dampening by committing to fixed priorities for the duration of an operational cycle, treating mid-cycle changes as expensive exceptions that demand explicit capacity trade-offs.
The reciprocal commitment from the operational layer is delivering completed work units at the boundary of each cycle. High operational reliability allows executive leadership to trust that strategic turns made at cycle boundaries will translate into rapid execution without continuous oversight.
Aligning the strategic recalibration cycle with the longest unbroken operational delivery loop prevents structural fatigue across execution teams.