
Mapping Avoidance Vectors to Calculate True Operational Capacity
Subtracting the unspent volume bounded by avoidance vectors from nominal output reveals true operational capacity.
Baseline
Calculations of organizational performance routinely start with resource inventories. Engineering hours, cash balances, server capacity, and headcount form the standard arithmetic of capability. This paper tally treats every unit of assets as equally available for execution.
Operational reality diverges from this inventory quickly. A system holding forty engineers and six months of operational runway often executes at the pace of a twelve-person team. The discrepancy is rarely caused by lack of effort or clear objectives.
It is created by internal diversion of force.

Nominal Capacity Against Functional Throughput
Resource accounting records what an organization owns rather than what it can direct toward a goal. When an operational unit approaches a complex transition, specific tasks generate disproportionate internal friction. Technical debt, unstated partner agreements, unclear product boundaries, and delayed contract reviews draw energy away from primary objectives.
The total force spent resolving or circumventing this friction represents lost capacity. Subtracting these defensive allocations from paper inventories reveals the true operational ceiling.
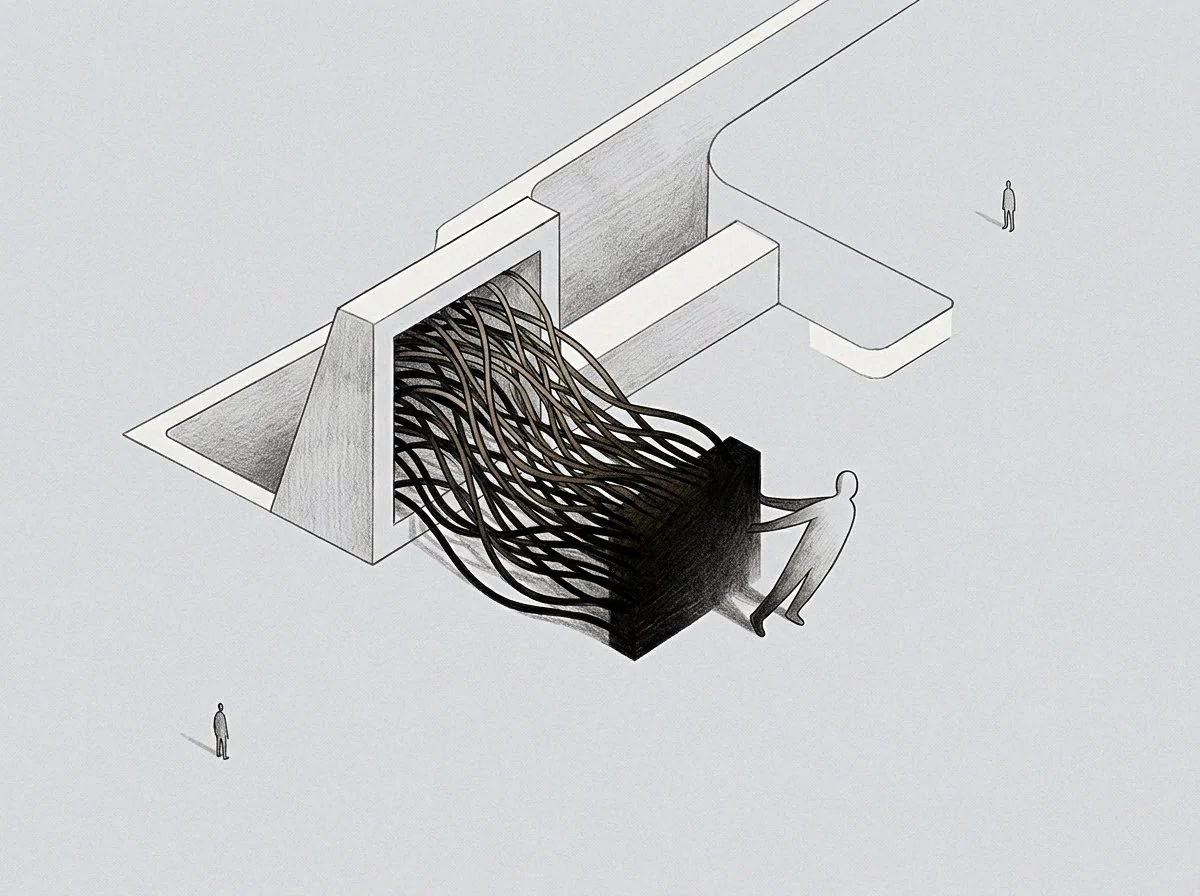
Friction alters output. Standard accounting treats operational capacity as a fixed reservoir, yet actual execution behaves like a flow rate throttled by narrow conduits. An engineering team facing an unaddressed architectural flaw will spend half its weekly cycle building workarounds rather than shipping features.
The hours appear fully utilized on internal timesheets, but functional throughput drops. Measuring input hours creates an illusion of high utilization while the actual trajectory flattens.
A system running near nominal limits diverts energy into structural workarounds long before output metrics register failure.
The gap between nominal assets and functional execution widens whenever a team expands without resolving underlying procedural blocks. Adding headcount to a throttled system increases administrative overhead while leaving the primary bottleneck untouched. Energy moves downhill.
Systems naturally route around points of high internal resistance, choosing path efficiency over structural resolution. Whether an organization can permanently reduce this internal diversion without resetting its operational goals remains an open variable.

Deflection
Systemic resistance leaves a distinct directional signature. When an task presents high psychological or operational friction, execution shifts away from the direct line of work. This structural shift forms an avoidance vector.
The angle of vector movement indicates which specific operational dimensions carry unbearable cost, while the vector magnitude measures the volume of work currently being bypassed.

Whose Latent Volume Expands Under Extended Pressure?
Every operational system operates along a slope derived from effort and reward. Optimization models select the path of least immediate resistance, steering work toward familiar tasks and away from computational heavy lifting. Discomfort marks the exact location where active calculation is occurring rather than simple pattern retrieval.
When an operator systematically avoids reviewing vendor terms, auditing legacy code, or settling equity splits, the delay is not passive absence. It is an active expenditure of energy dedicated to maintaining the current operational model.
The math applies. The path chosen around a difficult operational task reveals the boundary of the current operating model. Avoidance acts as a precise coordinate marker in organizational space.
The system routes around specific nodes because crossing them requires paying an upfront structural cost that the leadership declines to spend.
Coordinate Mapping Along The Cost Axis
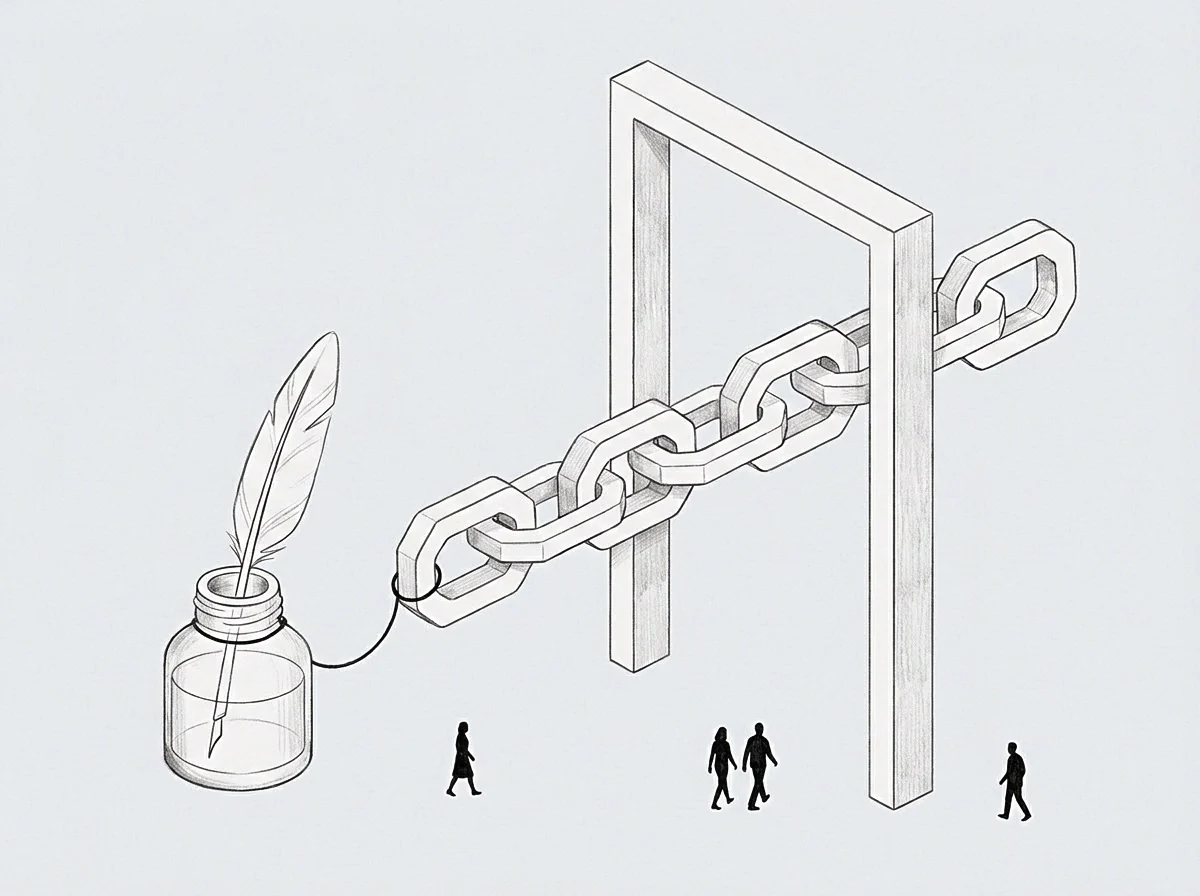
Mapping these deflections requires tracking task deferral patterns across successive planning cycles. When an initiative is pushed into subsequent quarterly roadmaps three consecutive times, the delay ceases to be a scheduling conflict. It establishes a coordinate point for a systemic boundary wall.
The wall consists of everything the organization will not do because execution is deemed too expensive on non-financial axes.
Silence carries signal. By projecting these avoidance coordinates onto a structural grid, an operator reads the true shape of organizational resistance. The volume of material accumulating behind an avoidance vector mirrors the unspent latent potential of the team.
If a key product decision is avoided for six months, the unspent technical capacity of the entire engineering division remains locked behind that unresolved choice. The magnitude of the vector equals the magnitude of the stalled progress.
Unstated operational limits produce exponential friction when systemic workload crosses the baseline boundary.
Ignoring these directional signals leads directly to misallocated capital. A founder observing delayed execution often diagnoses a lack of motivation or insufficient headcount, responding with additional hiring or incentives. This intervention fails because it targets team velocity rather than structural deflection.
Pushing harder against a deflected system simply accelerates the rate of diversion. A seasoned operator tracks the deflection angle first to identify which internal boundary is blocking the path.

Room
Consider two venture-backed hardware software companies operating in parallel markets, each starting with identical capital reserves of five million dollars and twenty engineers. Company Alpha calculates its capacity using paper metrics, projecting product delivery based on twenty engineers working forty hours a week. Company Beta maps its avoidance vectors weekly, tracking which architectural modules, customer calls, and legal agreements experience persistent deferral.

Worked Analysis Of Alternate Capacity Models
Company Alpha assigns its team to launch a major feature set without resolving a core database scaling issue that the infrastructure lead routinely avoids addressing. The team builds complex caching layers, custom monitoring tools, and manual override scripts to keep the legacy database functioning. Six months into development, eighty percent of engineering hours are spent maintaining the workarounds.
Nominal capacity remains listed as eight hundred weekly engineering hours, but actual feature output drops to eighty hours. The rest is consumed by structural maintenance of the avoided core issue.
Company Beta identifies the infrastructure lead’s avoidance vector during the second sprint. Recognizing the deflection as a marker of structural risk, the leadership halts feature development and assigns three senior engineers to rewrite the database core. The intervention costs three weeks of total product progress.
Once resolved, the vector disappears, and functional capacity returns to ninety percent of nominal levels. Company Beta reaches market four months ahead of Company Alpha while spending thirty percent less capital.
| Operational Variable | Unmapped Operating Model | Avoidance Mapped Model |
|---|---|---|
| Capacity Basis | Nominal headcount and payroll hours | Vector adjusted functional throughput |
| Friction Response | Layered workarounds and added headcount | Direct boundary resolution at coordinate point |
| Decision Latency | Cumulative deferral across cycles | Bounded intervention windows |
| Throughput Yield | Degrades continuously under load | Stabilizes near real ceiling |
Pressure reveals limits. Systemic failure occurs when the cost of maintaining workarounds exceeds total available operational energy. Organizations that compute capacity exclusively from financial inputs find themselves insolvent while their nominal spreadsheets still display surplus reserves.
When an operating team treats avoidance as an individual personality trait rather than a structural system vector, the structural debt compounds until primary execution collapses under the weight of its own workarounds.
Plenum
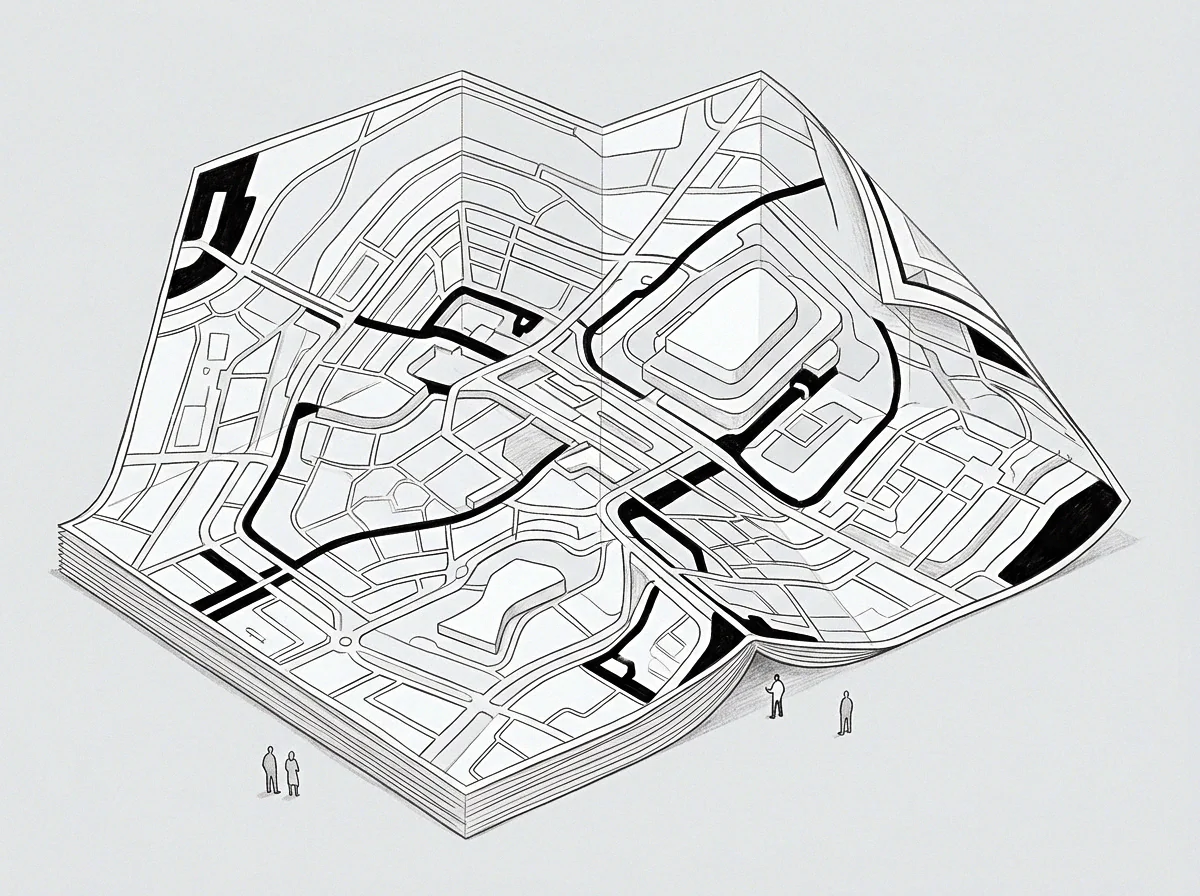
The space bounded by an avoidance vector holds unprocessed organizational material. This material does not disappear when ignored; it accumulates in an operational plenum, building static friction that degrades adjacent workflows. Measuring the volume of this plenum provides an exact read on the organization’s unspent potential.

Mirroring Negative Gradients Above Baseline
To calculate the hidden capacity locked within a system, an analyst mirrors the negative gradient of avoidance above the operational baseline. The negative vector shows where energy is diverted; its positive mirror reveals the exact yield available if the underlying block is resolved. Unprocessed legal liabilities, unresolved team conflicts, and deferred technical migrations represent potential kinetic energy.
Reclaiming this energy requires moving directly through the point of maximum computational cost.
Organizational resistance displays recurring structural signatures across different growth phases:
- Deferred Structural Handover: The reluctance of early founders to transfer operational sign-off to qualified managers creates a bottleneck that limits middle-management throughput.
- Bypassed Review Loops: Skipping rigorous code or financial audits to maintain short-term launch momentum accumulates hidden compliance debt.
- Unassigned Friction Coordinates: Leaving ambiguous operational dependencies unowned ensures that minor cross-departmental disputes escalate into permanent delivery stalls.
Coordinates locate wall. The presence of these structural signals indicates where energy is being drained from the core mission. An operator who records these coordinates builds an accurate map of system bottlenecks.
Avoidance maps the exact shape of unprocessed organizational friction.
The calculation holds. Resolving a single major avoidance vector often unlocks more operational throughput than hiring an entire department. The primary impediment to capacity expansion is rarely a lack of incoming resources, but the accumulation of unaddressed internal friction points.
The partner operating the adjacent desk will privately admit that the team is spending all its time managing around the founder’s preferred blind spots.
Bearing
Calculating true operational capacity requires a systematic protocol for adjusting paper expectations against measured vector deflections. The following sequence establishes the actual execution floor for an operating organization.
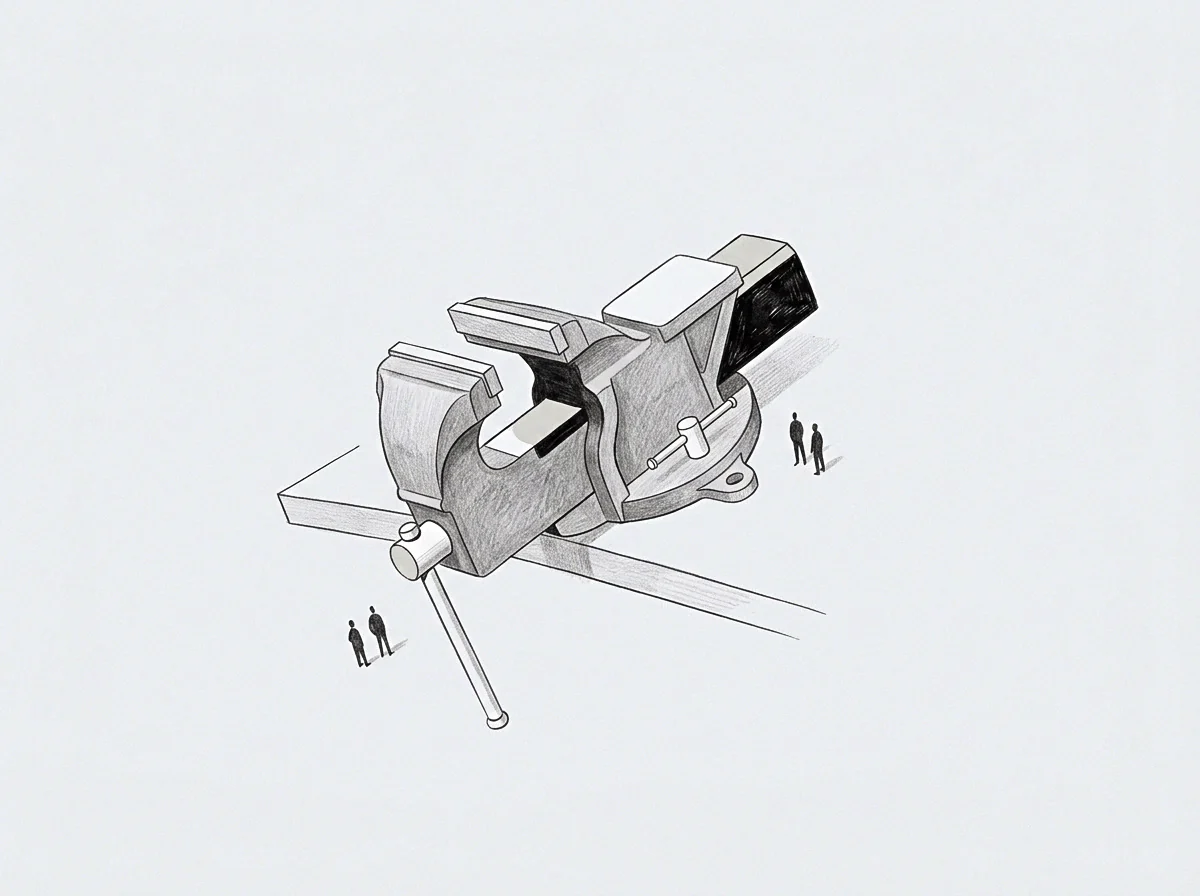
Calculating The Floor Of Execution
Numbers reflect inputs. The transition from nominal estimates to true throughput relies on rigorous mathematical subtraction of deferred tasks.
- Establish the nominal baseline by cataloging total stated resource reserves including capital, labor hours, and infrastructure throughput.
- Plot avoidance vectors across all operational domains by logging recurring task deferrals, roadmaps edits, and indirect process routing.
- Compute the unspent volume of each vector by measuring the labor and time spent creating and maintaining procedural workarounds around the deferred nodes.
- Deduct the total accumulated workaround volume from the nominal baseline to reveal the true operational floor.
Reserve collapses quickly. True operational capacity is not a static ceiling to be estimated once during annual planning. It is a dynamic index calculated continuously by subtracting measured deflection volumes from nominal resources.
The operator who measures paper hours while ignoring deflection pays for the total headcount while receiving only the residual capacity.
Routing determines yield. Operational leaders who incorporate vector analysis into their weekly accounting establish a realistic foundation for strategy. They cease planning based on idealized assets and begin executing within the precise limits of their functional capacity.
Cost stays ordinal. Under the terms of this operational protocol, any project plan that fails to adjust for measured avoidance vectors is classified as an invalid forecast.