
Measuring The True Operational Cost Of Enterprise Growth
Enterprise growth cost operates as an ordinal multi-attribute vector of hours, capacity, and attention long before converting to cardinal financial figures.
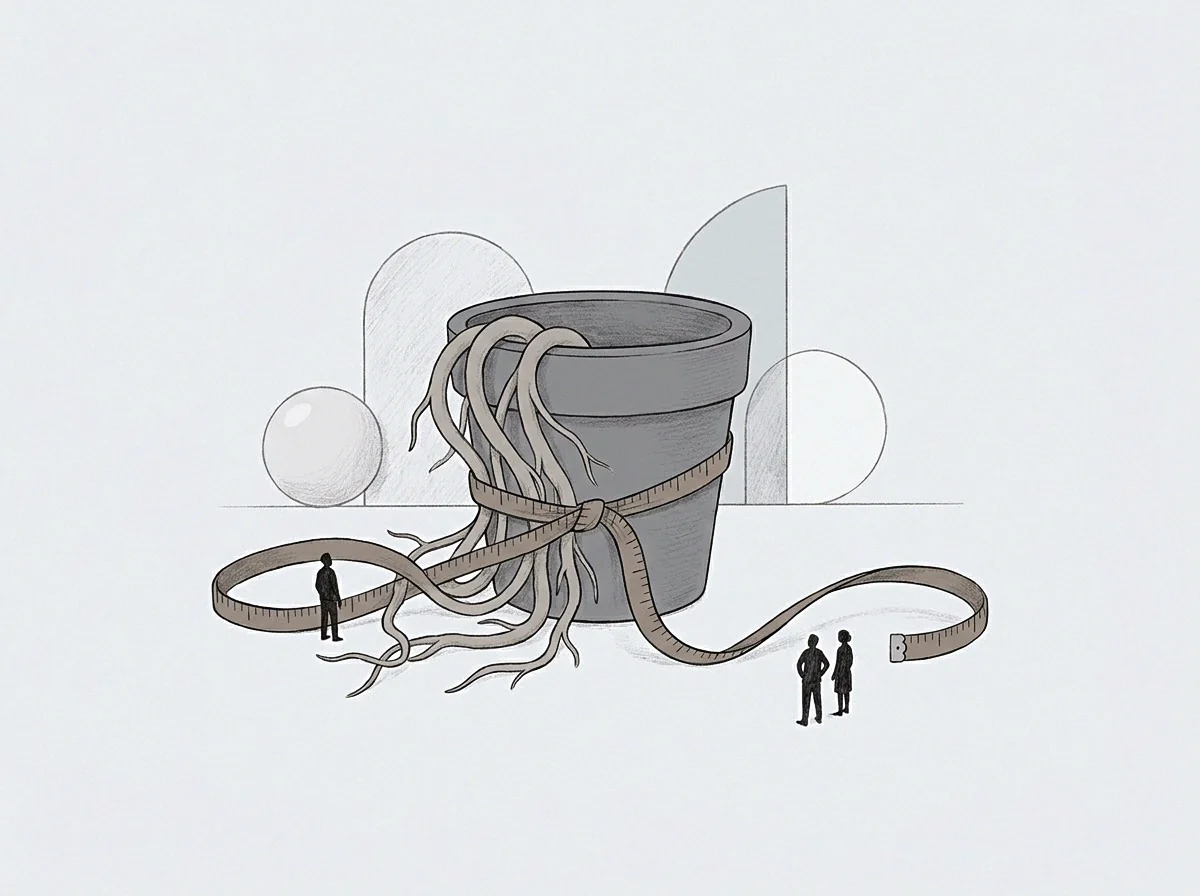
Vector
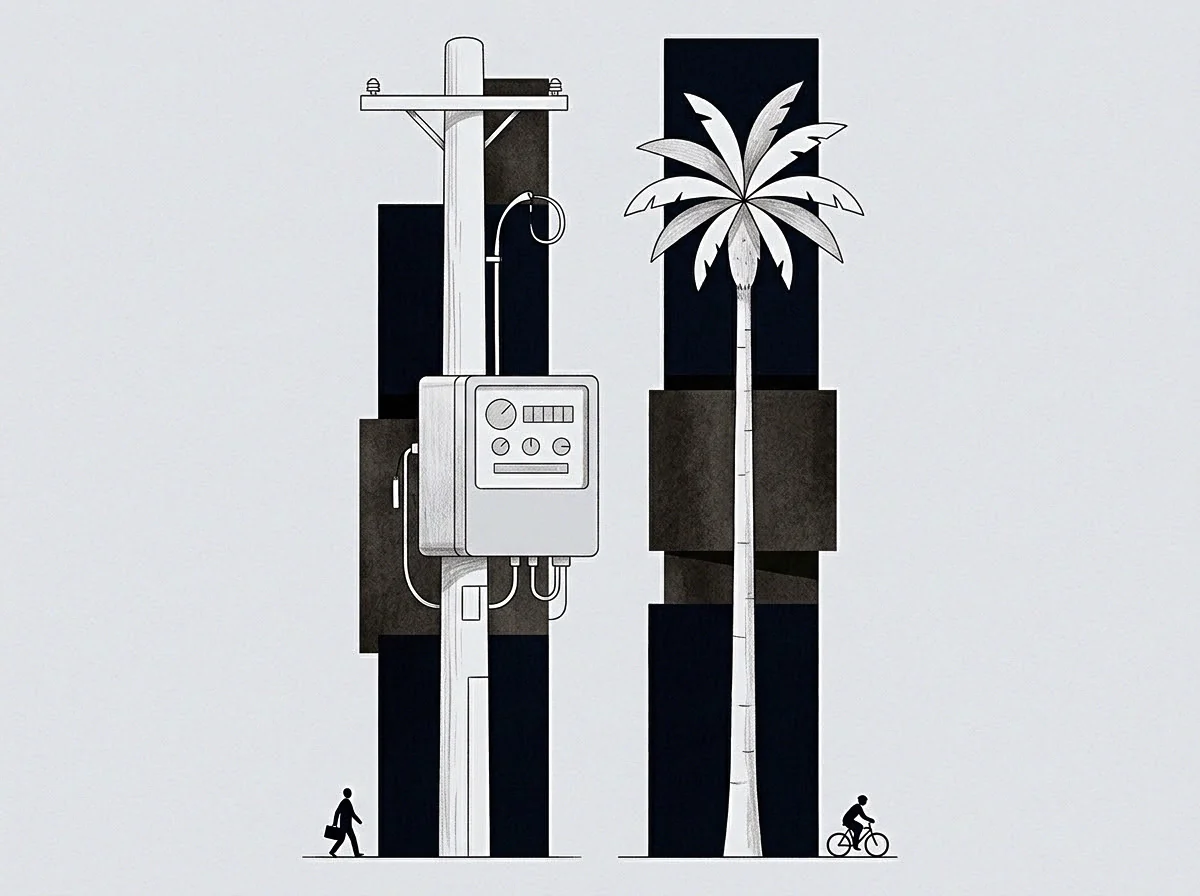
Separating Cardinal Price From Multi-Attribute Drag
Financial ledgers record cardinal figures. Operational consumption during expansion operates as an ordinal vector containing distinct magnitudes that move at different rates.
An enterprise expansion consumes resources across discrete dimensions simultaneously. Money moving out of a bank account reflects a single cardinal number. Internal operational drag incorporates attention allocation, working capacity, institutional hours, and capability accumulation.
Evaluating expansion purely through monetary expenditure disguises the true consumption rate inside the operating layer.
Decomposing operational drag requires isolating each magnitude prior to aggregation. The components move independently under structural expansion pressure.
- Hours Vector captures the absolute time dedicated to coordinating expanded operations across teams.
- Capacity Magnitude measures the available operational buffer remaining before throughput degrades.
- Attention Expenditure registers the focus diverted from core execution toward structural governance.
- Capability Delta tracks the systemic skill acquired by the organization during the expansion cycle.
A positive capability vector can accompany a declining cash position. Operators often sustain monetary outlays when the organizational learning magnitude rises. Conversely, positive financial income frequently masks severe capacity depletion across senior operational roles.
High monetary yields obscure internal structural decay until throughput fails completely.
A cost vector maintains ordering across multiple operational dimensions long before conversion into monetary terms.
Measuring expansion through ordinal comparison isolates relative operational states over consecutive quarters. An operator evaluates whether structural drag sits higher or lower than the prior baseline. The internal assessment stays internal because multi-attribute vectors cannot pass directly into external contractual terms.
Stating operational consumption early preserves deliberate decision rights.
The cardinal translation occurs only when internal drag requires external settlement through financial compensation or extended contractual timelines.
Room
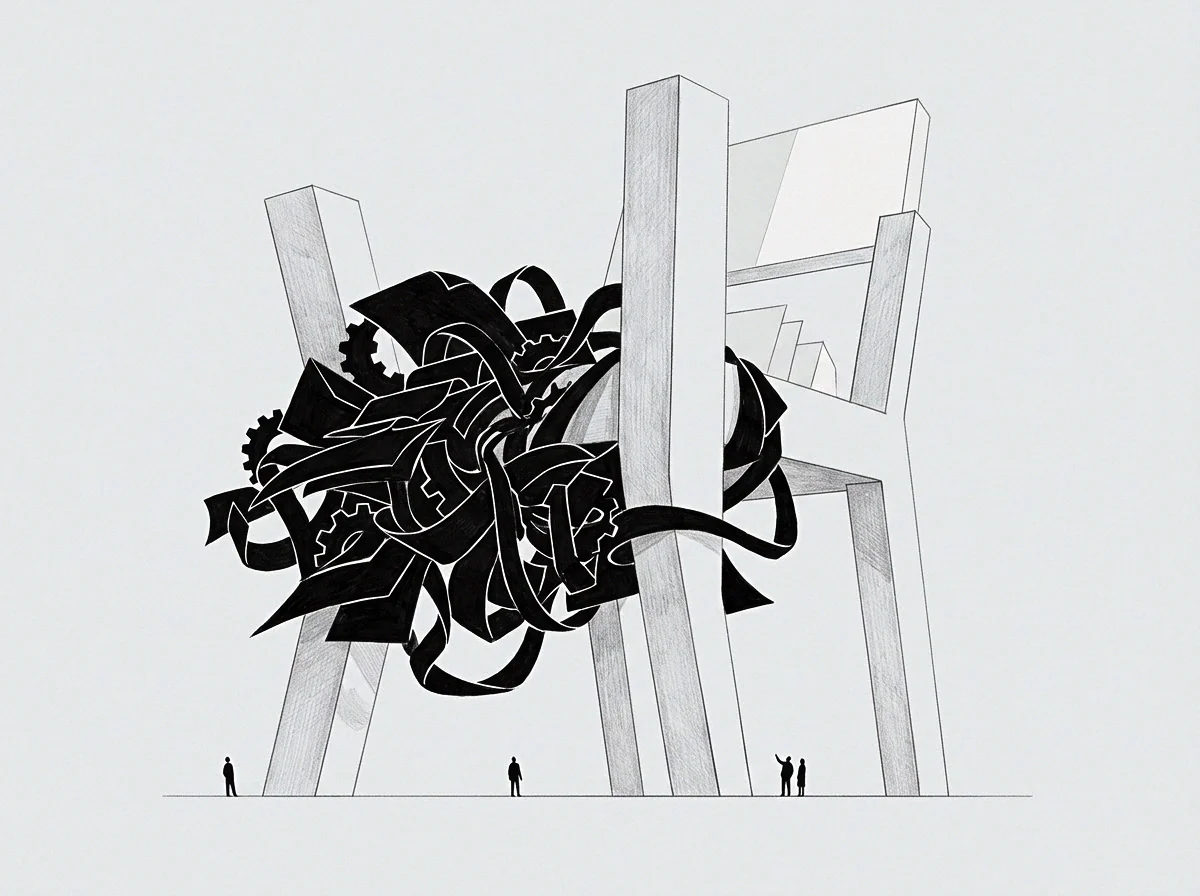
Physical Limits of Coordination and Attention
Every operational structure possesses a physical ceiling defined by coordination overhead and communication geometry. Adding headcount to address workload expands communication channels exponentially rather than linearly.
Consider two scaling models operating within a three-year expansion window. The first model scales by multiplying frontline execution roles while maintaining centralized approvals. The second model decentralizes authority, increasing local variance while capping central coordination hours.
The first structure consumes operational capacity through approval queues. The second structure consumes capacity through quality auditing and variance reconciliation.
| Governance Model | Primary Consumption Axis | Queue Latency | Structural Resilience |
|---|---|---|---|
| Centralized Approval Architecture | Senior Attention Expenditure | High Systemic Delay | Brittle Under Volume Spikes |
| Decentralized Execution Architecture | Audit and Variance Hours | Low Systemic Delay | Flexible Across Regional Nodes |
| Hybrid Matrix Architecture | Cross-Functional Sync Time | Moderate Systemic Delay | Variable Based on Node Density |
| Metrics measured under high throughput load expansion conditions. | |||
Communication friction expands as headcount multiplies. Ten operators sharing one channel generate forty-five unique connections. Expanding the team to twenty operators creates one hundred ninety potential lines of interaction.
The physical hours spent aligning these channels reduce the hours available for direct service delivery.
The seat holds the operator. The hours fix the remaining daily focus. Focus dictates execution speed.
Executive attention represents the most constrained operational asset during growth phases. When daily focus shifts entirely to resolving internal coordination failures, strategic execution halts. The entity consumes its internal energy to maintain internal alignment.
Unmonitored coordination growth degrades operational throughput until external delivery promises fail completely.
Gradient
Balancing Capability Gained Against Capacity Consumed
Operational optimization follows a continuous gradient. System design naturally routes activities along the path of least immediate resistance, often creating long-term structural debt.
Expansion forces a persistent trade-off between immediate capacity consumption and long-term capability acquisition. A rapid increase in transaction volume consumes working capacity instantly. Building automated infrastructure or training specialized staff consumes immediate capacity to yield future capability.
Misjudging this trade-off creates operational collapse.
System capacity depletes instantly while capability accumulation follows an extended temporal curve.
A baseline assessment identifies the exact threshold where workload exceeds operational design. When processing volume crosses this threshold without structural adaptation, error rates compound. Operators frequently mistake temporary extra effort for sustainable throughput.
Prolonged reliance on baseline over-exertion causes systemic fatigue and sudden operational drops.
When Does Volume Consumption Outpace Capability Acquisition?
Volume consumption outpaces capability acquisition when routine throughput demands exhaust all available working hours, leaving zero operational margin for process development. The system operates entirely in emergency response mode.
The setpoint of an operational control loop dictates how the system responds to variance. If the error signal measures only immediate output volume, the system prioritizes speed over structural integrity. Quality control measures decay.
Rework volume grows quietly in the background.
A project running at a financial loss for twelve months remains rational when the organizational capability vector moves upward sharply. The acquired capability creates permanent enterprise value that survives transient monetary deficits. Conversely, high immediate revenue combined with declining capability signals systemic risk.
The delivery schedule fell behind because central sign-off sat unread for three weeks.

Converter
Translating Internal Drag Into External Cardinal Terms
Internal operational drag remains hidden from external counterparties until explicitly converted into cardinal pricing, clear contractual limits, or extended service timelines.
Counterparties do not evaluate internal attention drain or coordination friction. They observe only delivery speed, price tags, and contractual compliance. The founder translates complex internal vector costs into simple cardinal terms during commercial negotiations.
Value remains untransmissible between distinct parties while exact operational cost vectors convert directly into cardinal price figures.
The conversion process follows a structured sequence to ensure internal operational costs are fully captured in external agreements.
- Decompose the internal operational commitment into labor hours, executive attention, and system capacity outlays.
- Apply an internal risk premium to account for unexpected coordination drag and process variance.
- Map the aggregated internal vector onto a cardinal currency figure or firm contractual milestone.
- Establish clear boundary conditions that trigger price renegotiation if client scope alters operational load.
Failing to convert internal operational drag into cardinal price structures creates covert structural subsidies. The enterprise effectively absorbs client-side complexity without receiving corresponding compensation. The operating margin shrinks even as top-line revenue expands.
Unpriced operational complexity always converts into uncompensated internal labor.
Tide

Long-Term Structural Lag and Baseline Drift
Operational cost vectors manifest fully over extended temporal horizons. Baseline drift occurs so gradually that operators rarely notice the steady accumulation of administrative overhead until total system flexibility vanishes.
Legacy processes designed for early-stage operations linger long past their utility. These residual procedures act as fixed friction points within expanded workflows. Every legacy approval step, redundant reporting loop, and manual data re-entry consumes daily operational capacity silently.
System capacity recovers only through deliberate structural pruning and explicit removal of obsolete governance layers.